$FET Does Zooming out look better?NYSE:FET has been underperforming lately and the local chart looks trash so I wanted to zoom out to give us all some context on the larger picture which hasn't really changed.
Price appears to have completed wave II at the High Volume Node (HVN) support and 0.5- 0.618 'Golden Pocket' Fibonacci retracement and wave 3 is underway but finding local resistance.
Pivots are warped due to the strength of the move last year so wouldn't count them as reliable so focusing on support and resistance. The megaphone pattern is clear and the next area of resistance when FET starts moving is the $1.2
Weekly RSI is decreasing and is attempting to cross bearishly. If Bitcoin has a significant pullback I would expect new lows for FET at this rate. I have a neutral stance at this point.
Analysis is invalidated below $0.546
Safe trading
Elliott Wave

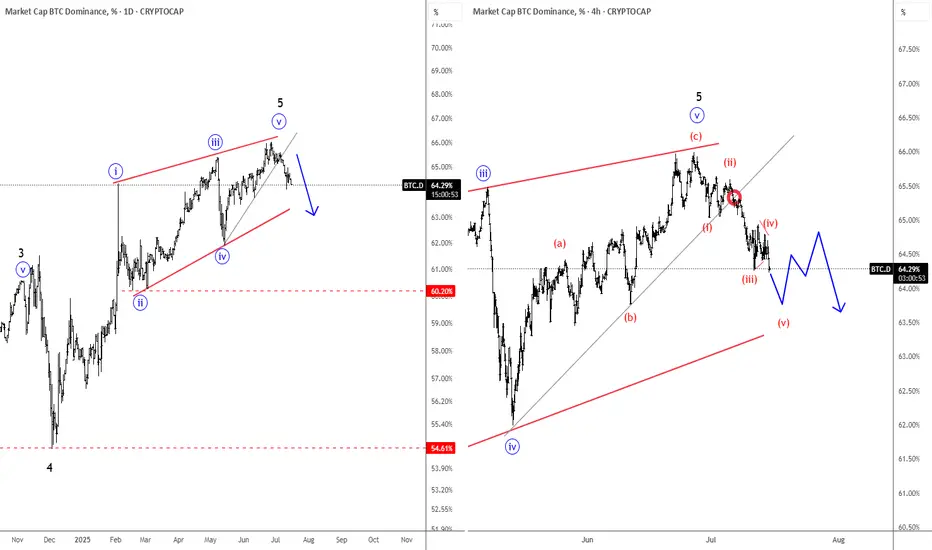
Bitcoin Dominance Found The Top; ALTcoin Dominance Stepping InHello Crypto traders! BTC.Dominance is falling in an impulsive fashion after we spotted the top within the wedge pattern. Now that is trading in wave (v) of a five-wave impulse from the highs, it just confirms a bearish reversal, which indicates that ALTcoin dominance is stepping in. And with still bullish Crypto market, we might be in the ALTseason.
$ETH Pullback to $2630 Support?CRYPTOCAP:ETH has a great week pushing through resistance and making new local highs after testing the daily 200EMA and daily pivot as support.
Price is likely to retest the swing high and previous resistance as support around $2600-2700, also the .382 Fibonacci retracement.
RSI is printing daily bearish divergence in overbought from the wave (3) top to current as it did at the wave (5) top seeing large rejection. The retest of $2600 would reset RSI.
Price is ultimately set to test $3600 as the next resistance if the Elliot wave count is correct.
Analysis is invalidated below $2050
Safe trading

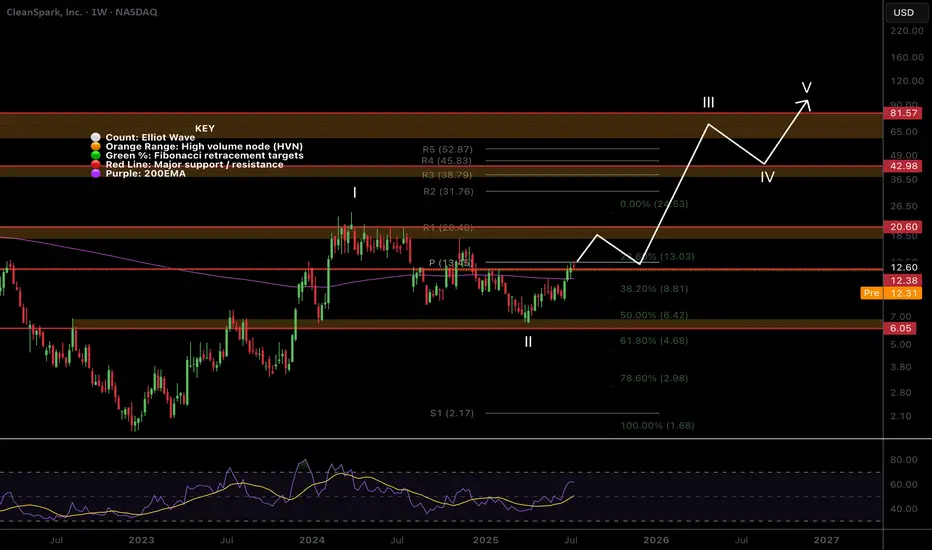
$CLSK Trapped between Critical Resistance and Support?NASDAQ:CLSK Shot through the weekly 200EMA and hit the weekly pivot resistance and was rejected into the High Volume Node (HVN) just below.
If the count is correct we should see price breakthrough in wave 3 after some consolidation and continue up after wave 2 tested the .618 Fibonacci retracement and HVN as support.
Heavy resistance HVN coupled with the R1 pivot at $20.40 will prove another challenge to overcome. Ultimately, if the count is correct AND Bitcoin doesn't tank we can expect a challenge of the all time highs up at $60.
I already closed partial take profit myself at the weekly pivot on a recent trade and will be looking to go long again to the those targets. Make sure to always be taking profits on the way as nobody has a Crystal ball!
RSI is currently printing a bearish divergence on the weekly so we need to see that negated.
Analysis is invalidated below $6.
Safe trading
$AAVE Macro outlook Grinding the PathCRYPTOCAP:AAVE continues to grind higher poking above the swing high which was rejected to test the weekly pivot and .382 Fibonacci retracement as support successfully. This was a shallow wave 2 so I am expecting a big thrust up in wave 3. However, the alternative count could suggest a wave is only completing now with wave 2 actually being wave (4) of 1, this would be the case if price falls back below $171.
Weekly RSI is still bullish with plenty of room to rise ahead of it. It printed a weekly bullish divergence at the wave II low and major support high volume node.
AAVE is definitely one too watch this cycle.
Safe trading

ETHEREUM → Correction to 2900 before growth BINANCE:ETHUSDT is entering a correction after a strong breakout of resistance. At the same time, Bitcoin is falling from 123K to 116K, triggering a pullback across the entire market...
On D1, ETH is facing strong resistance and is not yet ready to break it (it lacks strength after the rally). The most likely scenario after a false breakout is a correction to support. But the main focus is on Bitcoin — will there be a correction or a reversal of the local trend? If the flagship continues its decline, the cryptocurrency market will humbly follow suit.
ETH has a nearest zone of interest at 2913, where liquidity capture could attract buyers, but I do not rule out the possibility that the correction could go much deeper before further growth, for example to 2879-2827 (support on D1).
Resistance levels: 2992, 3041
Support levels: 2913.7, 2879, 2827
Technically, consolidation against a bullish trend. Confirmed support area 2913 - 2879. As part of the correction, the market is interested in capturing liquidity. If, against the backdrop of the current correction, the bulls manage to hold their ground above the specified support, ETH may still surprise us with its growth :)
Best regards, R. Linda!

Oil Futures Approaching Key Reversal Zone – Bullish HarmonicOil futures may be forming a bullish Shark harmonic pattern, with price approaching the potential reversal zone at point D. This pattern suggests a possible bounce if buyers step in around this area. If price action shows signs of support or a shift in momentum, it could offer a solid long opportunity. Look for confirmation like bullish candles or indicators turning up before entering. If the pattern plays out, it could provide a strong risk-to-reward setup.

GOLD → Consolidation. Long squeeze before growth to 3400FX:XAUUSD has broken through resistance at 3353-3357 since the session opened, and bulls are currently trying to keep the market in the buying zone. Should we expect a long squeeze before growth?
Gold is in local consolidation after breaking through a key level. The price is still in the consolidation phase formed during a week-and-a-half correction. The price reached a three-week high of $3,374 on Monday but fell after the EU's conciliatory statements. Investors are awaiting US inflation data and Chinese GDP figures as they assess the prospects for a Fed rate cut. Heightened geopolitical and trade tensions are keeping demand for safe-haven assets high.
Technically, gold has entered a local buying zone, but there is a fairly complex resistance zone above it, and consolidation is needed to break through it. Such patterns could include a retest of support and a liquidity grab before growth.
Resistance levels: 3373, 3394
Support levels: 3357, 3353, 3345
There is a possibility of a retest of eql 3353 in a long squeeze format and a return to resistance at 3373 for a breakout. I also do not rule out a retest of the key level of 3345. The global trend is bullish, with the price locally in a fairly wide range, with an emphasis on the support zone of 3345-3355. If the bulls can hold this zone overall, the market will have a good chance of rising to 3400-3450
Best regards, R. Linda!

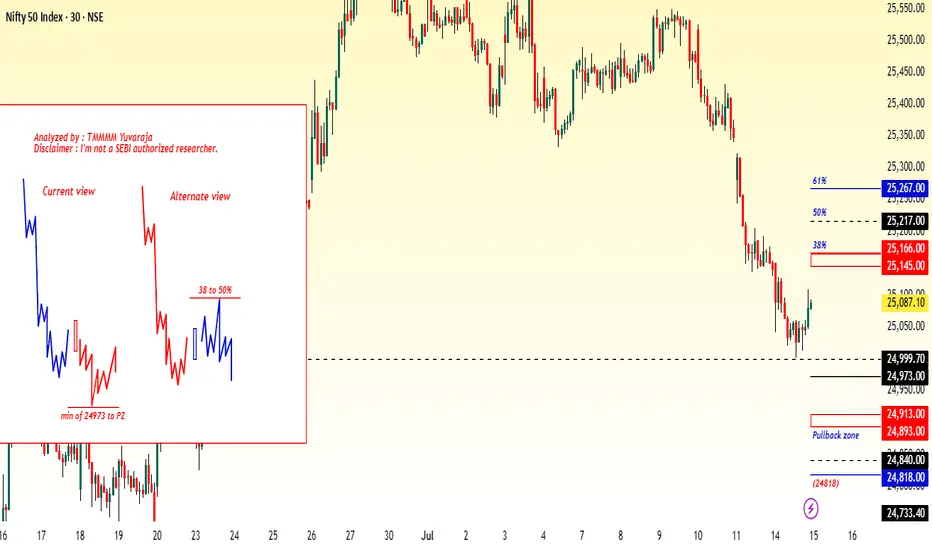
#Nifty directions and levels for July 15th:Good morning, Friends! 🌞
Here are the market directions and levels for July 15th:
There have been no major changes in the global market; it continues to maintain a moderately bearish sentiment, and our local market is also reflecting the same tone. Today, Gift Nifty is indicating a neutral to slightly gap-up start.
So, what can we expect today?
Current View:
Structurally, we are still in a minor downtrend. So, if the market fails to sustain the neutral start, we can expect a minor correction in the initial stage.
if the correction comes with a solid structure or the price consolidates around the immediate support, then the correction is likely to continue.
On the other hand, if the correction reaches the support with gradual moves, then the support may hold, and we can expect a minor pullback with a bearish bias.
Alternate View:
If the market takes a pullback, we can expect a maximum of 38% to 50% retracement on the upside. However, since we are still in a downtrend, once the pullback starts correcting again, we may expect a range-bound market or further correction, similar to what we saw in the last session.
#Banknifty directions and levels for July 15th:Current View:
Structurally, we are still in a minor downtrend. So, if the market fails to sustain the neutral start, we can expect a minor correction in the initial stage.
if the correction comes with a solid structure or the price consolidates around the immediate support, then the correction is likely to continue.
On the other hand, if the correction reaches the support with gradual moves, then the support may hold, and we can expect a minor pullback with a bearish bias.
Alternate View:
If the market takes a pullback, we can expect a maximum of 38% to 50% retracement on the upside. However, since we are still in a downtrend, once the pullback starts correcting again, we may expect a range-bound market or further correction, similar to what we saw in the last session.

USDJPY Short: Completion of Triple Combination Sub-wave 2Hello everyone! Over in this video, I analyzed the USDJPY and go through how I counted the waves and go through the lower levels sub-wave counts. I believe that USDJPY has completed a triple combination with the Z wave as a 5-wave structure. I talk about how this final wave might not be ideal and propose how the waves might be viewed in a different perspective. However, I believe also that the price is now good enough to short and propose a scaling-in method to short USDJPY.
Eventually, I think that USDJPY will go down to the lower trendline and break it. However, we will have to revisit the chart again when it does to see how the waves unfolded and then decide how to trade it.
Finally, as always, keep your risk tight and Good luck!

Bitcoin still a long: Target remains at $124,632This is an update to the wave counts for Bitcoin. We are in the final wave 5 of 5 of 3 and the target remains at around $124,632.
The stop can be adjusted to around $120,433, below the wave 2 of 5 of 3.

NSE IONQ - Are we ready for a breakout?The corrective phase is complete and an impulse move appears likely. A strong buy above the A-B-C channel could target levels around 30 - 37 - 45 or higher. Good entry is possible above 26. However, if conditions worsen, further corrections may ensue.
I will update further information soon.

XAG/USD Eyes Upside Targets as Wave C MaturesXAG/USD is currently trading in a corrective phase where wave B appears to have completed, and wave C is currently forming. Based on the current price action, it doesn’t seem likely that this entire move will result in a full bullish recovery. The structure suggests that this could be sub-wave C of wave 4, potentially completing around the 26.79944 level. Going forward, if the 5th wave begins to unfold, potential targets could be in the range of 29.74182 to 30.57528.

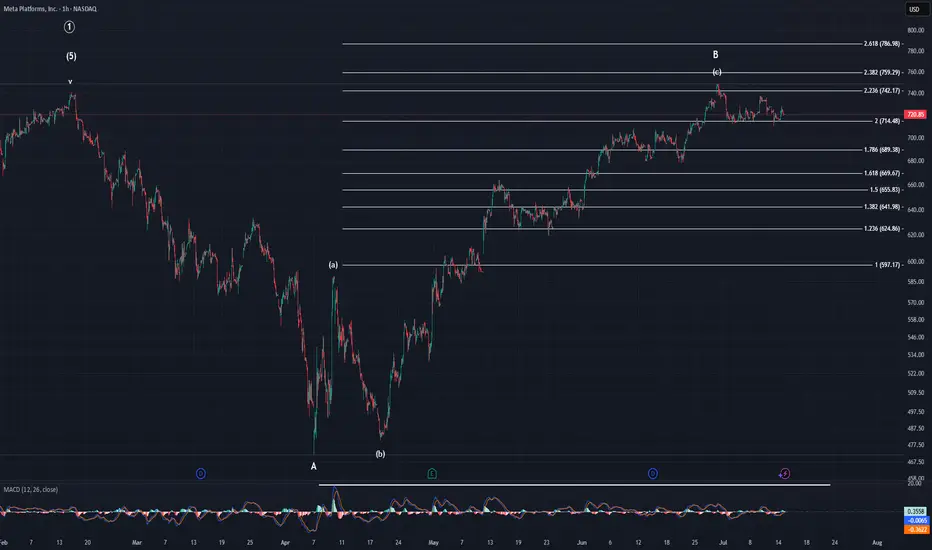
MetaSince the last post I made price has yet to make a new high. It has managed to chop in this area with a slight downward bias. If we're on the verge of the top of the indices, there is no reason to think Meta will continue higher much longer. This pattern, which is clearly corrective in nature, is way overextended. We started off with a 3-wave move higher off the April low and have risen all the way to the 2.236. Even if you could somehow say this is impulsive, it would still be over extended. So, no matter how you look at this pattern, it is in need of a correction. The question is how will that correction look. IMO, it will look like a minor C wave of intermediate (A). However, if it is somehow impulsive, then it would look like either minor A just now starting, or a smaller degree wave 2.
US500 evening analysisMy primary count of bullish price action since 7 April 2025 low sees regular flat (regular flat A, zigzag B, impulse C), impulse C with ending diagonal 5 of (5).
Median line (red line) of pitchfork was never tagged, implies price action eventually returning to origin (5098.6).
Ending diagonal invalid above 6307.2, bears with high reward, low risk opportunity.

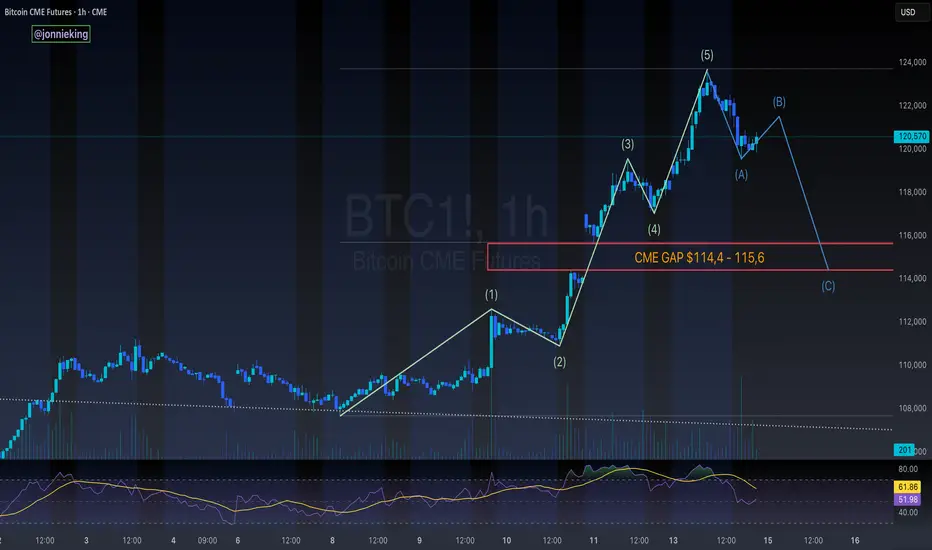
$BTC 5-Wave Impulse > ABC Correction > CME GapCRYPTOCAP:BTC appears to be headed towards an ABC correction after this impulsive 5-wave move to the upside
Would be a great opportunity to fill the CME gap ~$114k
Lines up perfectly with the 50% gann level retracement to confirm the next leg
don't shoot the messenger..
just sharing what i'm seeing 🥸
Gold Breakout and Potential RetraceHey Traders, in tomorrow's trading session we are monitoring XAUUSD for a buying opportunity around 3,340 zone, Gold was trading in a downtrend and successfully managed to break it out. Currently is in a correction phase in which it is approaching the retrace area at 3,340 support and resistance area.
Trade safe, Joe.

The XRP/ETH Supercycle I am anticipating ETH gets flipped by XRP.
Long term bearish trend has broken and with that - a longer term up trend appeared.

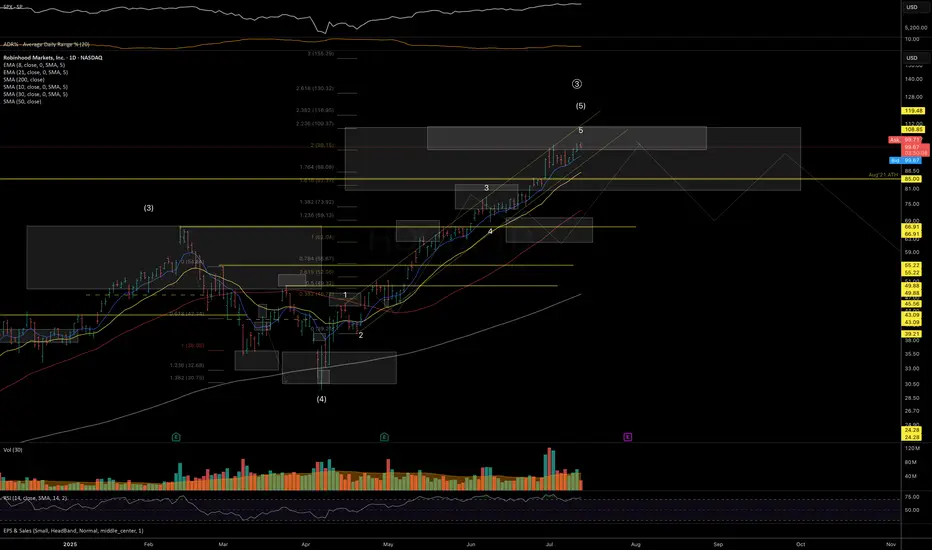
HOOD — In Key Macro Resistance ZonePrice has reached a major resistance zone, with the 110 level marking an ideal spot where downside pressure may begin to dominate and a mid-term top could start forming. Macro support for the macro-uptrend structure is at the 80–65 area.
Hedging near current levels may be prudent - especially ahead of earnings and while volatility remains relatively cheap.
Weekly view
Daily view:
Thank you for your attention and I wish you successful trading decisions!
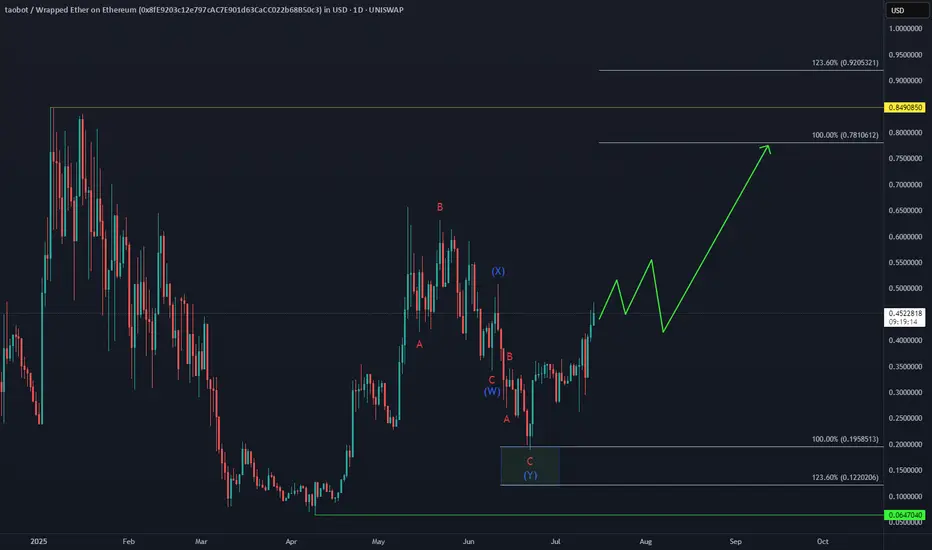
TAOBOT Eyes Further Upside Toward New ATHAfter forming a short-term higher high sequence from the June low, UNISWAP:TAOBOTWETH_8FE920.USD is building bullish momentum.
The next target sits in the equal legs area $0.78–$0.92 zone potentially paving the way for a new all-time high.
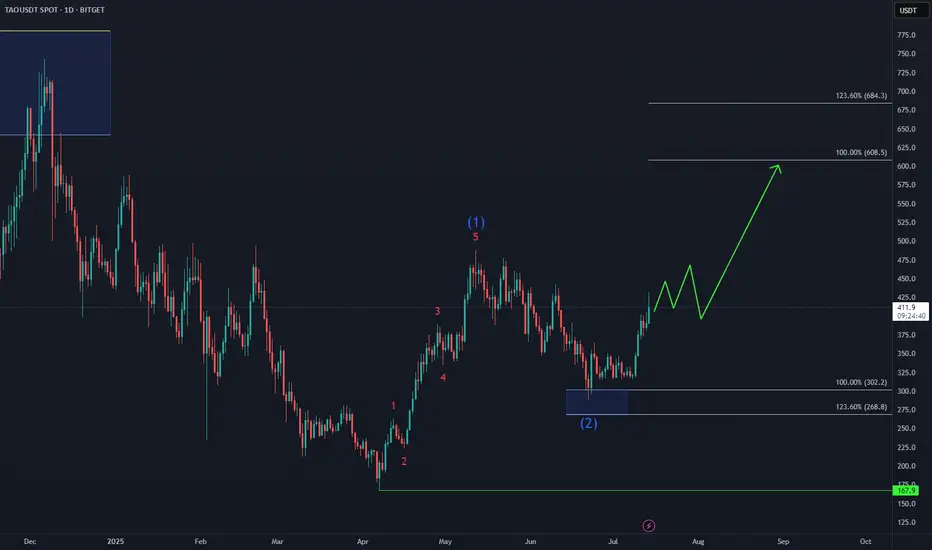
Bittensor TAO Eyes Next Upside Target📈 BINANCE:TAOUSD attracted strong demand in the Blue Box buying zone at $302–$214, triggering the next bullish leg.
Elliott Wave projections now point toward a move into the $608–$684 target area, supported by impulsive structure and rising momentum.
As long as price holds above the recent low, the bullish sequence remains intact.
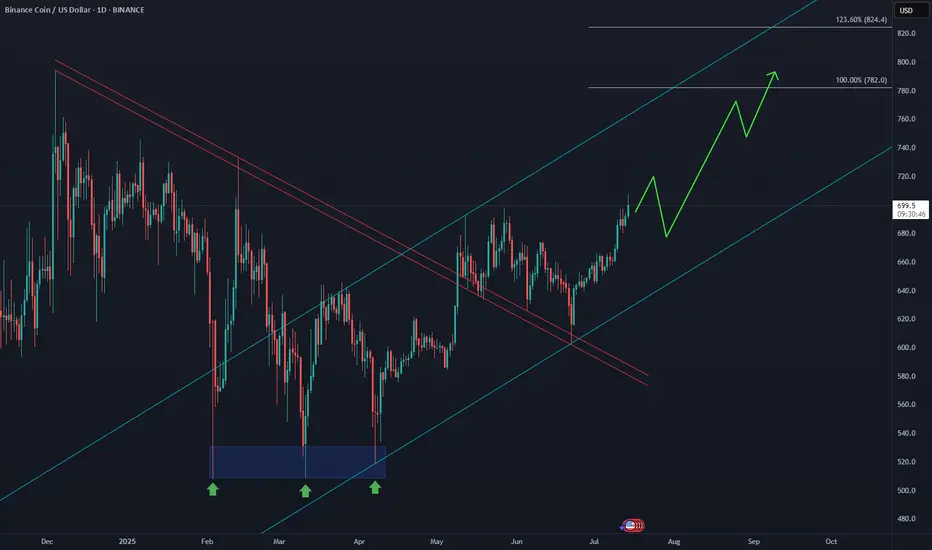
BNB Aiming for New All-Time Highs📈 After breaking above the May peak, CRYPTOCAP:BNB has activated a bullish sequence, with the equal legs target zone projected at $782–$824. This aligns with Elliott Wave extensions and confirms strong momentum from the June lows.