Smart 15-Min Entry on USDJPY – Clear Plan with 2.33 R/R📢 Hey Guys;
I've placed a buy limit order on USDJPY at a key support level.
🔵 Entry: 145.956
🔴 Stop Loss: 145.743
🟢 Targets:
• TP1: 146.069
• TP2: 146.232
• TP3: 146.468
📐 Risk/Reward Ratio: 2.33
-------
Your likes and support are what keep me motivated to share these analyses consistently.
Huge thanks to everyone who shows love and appreciation! 🙏
Elliott Wave

NASDAQ Potential DownsidesHey Traders, in today's trading session we are monitoring NAS100 for a selling opportunity around 22,750 zone, NASDAQ is trading in a downtrend and currently is in a correction phase in which it is approaching the trend at 22,750 support and resistance area.
Trade safe, Joe.

GOLD → Readiness to test the local bottomFX:XAUUSD is under pressure from the rising dollar and uncertainty, breaking through support levels, which opens up a corridor for the market to fall to 3255 - 3246
The price of gold is consolidating around $3300 after falling more than 1% amid expectations of the Fed minutes and news about tariffs.
Investors remain cautious: the dollar is supported by hopes for US trade deals, while the threat of new tariffs from August 1 is holding back gold's growth.
Weak inflation data in China did not support the metal, while expectations that the Fed will not rush to cut rates due to inflationary pressure from tariffs are also limiting interest in gold. Traders are waiting for the Fed minutes and new statements from Trump to determine the further direction.
Technically, the market looks weak (on D1, the price closed below the key level of 3300 on Tuesday) and there is a chance of a further decline.
Resistance levels: 3300, 3311
Support levels: 3295, 3255, 3246
Consolidation below 3295-3300 could trigger a further decline to 3255, from which the market could react with a correction.
Buying can be considered if gold reverses the short scenario, manages to strengthen to 3311, and consolidates above this level. At the moment, the price is in the selling zone...
Best regards, R. Linda!

AAVE prepares for the back-test
After a sharp decline, AAVE formed a textbook spring, signaling that strong buying demand has returned to the market.
The recent bullish leg appears to have completed a 5-wave impulse structure (H4 timeframe), suggesting a high probability that a corrective phase may follow.
Currently, EURONEXT:AAVE is testing the resistance boundary of its ascending channel. I’m looking for signs of an upthrust here, with two primary scenarios in mind:
Scenario 1: If the recent surge to $300 is confirmed as an upthrust, we could see a mild correction back to the $279 area for a support back-test—possibly forming a secondary spring within the rising channel (lower probability).
Scenario 2: If price wicks above $300 but then reverses, I anticipate a back-test at $289, which could set the stage for a new rally to break ATHs (targeting $325) and potentially reach the $370 area.
RSI is approaching overbought territory, but there’s no clear sign of a reversal yet. It’s crucial to watch for divergence signals at this stage.
Key Points:
AAVE is in a strong bullish phase, but a short-term pullback to retest the $279–$289 support zone could offer the optimal entry for the next leg up.
Risk management first: Keep stops tight below $275 to protect capital.

$SUI Gearing Up to Break Triple Resistance?CRYPTOCAP:SUI is consolidating under resistance which often leads to a breakthrough but can take some time.
Price is sat above the daily pivot after breaking the downward trend resistance, but still under the daily 200 EMA and High Volume Node resistance. A pop above $3.09 swing high would be a bullish signal to long towards a first target of $4.2 High Volume Node.
Analysis is invalidated with a move below $2.7, leaving heavy resistance still ahead.
Safe trading

EURUSD → Bullish daily structure. Correction before growthFX:EURUSD , after significant growth and a break of structure, has entered a local correction, the target of which may be a phase of accumulation of potential for updating intermediate highs (1.183).
The daily market model is bullish. A break of the structure has formed on D1, and the market is entering a correction phase, during which it may be interested in testing 0.5 or the 0.7 Fibonacci area before continuing its growth. I would also like to draw attention to the previously broken resistance level of 1.164 - 1.163, which, within the current correction, may act as a support level for buyers...
In addition, the market has not yet reached the liquidity level it was heading for during the correction for a possible continuation of growth. Zone of interest: 1.168, 1.164, 1.159
Resistance levels: 1.1728, 1.1766
Support levels: 1.168, 1.164, 1.159
A false breakdown of the specified support zone could change the market imbalance and attract buyer interest, which could generally support the bullish trend.
Best regards, R. Linda!

$AAVE Ready to Pop?EURONEXT:AAVE long signal is now active.
Price is still well above the daily pivot and daily 200EMA showing a strong local trend.
I am still expecting a decent move to test the all time high, High Volume Node at $460.
Safe trading

ETHUSD SHAPING THE BEARISH WEDGE, READY TO DECLINE
Ethereum has been forming the bearish wedge since the June 23th. The asset goes precisely according to Elliot 5-waves formation and is currently starting the wave E, rebounding from the lower border of the chart pattern.
What a trader may do?
We may go aggressive and trade long right immedia CAPITALCOM:ETHUSD tely with a take profit slightly below the 2,700.00 resistance level
🔼 a market buy order at 2544.19 with
❌a stop loss at 2489.90 and
🤑a take profit at 2691.35,
risk-reward ratio is 1:2.71 (nice one!)
However, I prefer to stay conservative and wait till the price tests the 2,700.00 level and enter the position there with
🔽 a pending sell stop order at 2691.35 with
❌a stop loss at 2759.92 and
🤑a take profit at 2409.89
risk-reward ratio here will be 1:4.1 (even better!)
In mid-term, I still expect ETHUSD to trade within a 2,400.00-2,700.00 range. So after assets reaches the 2,400.00, could be reasonable to look for new long opportunities! But will see.

Hang Seng Index (HSI) - Macro CountHSI:HSI
This is the most bearish scenario I’m considering for the Hang Seng Index, though it is not my preferred outlook. For this idea to play out, we would still need to see a substantial downward correction in the form of a zigzag. While such a move is technically possible, it seems unlikely given that the index has already been in a corrective phase for nearly 15 years.

AMD: Elliott Wave Cycle Shows Impulsive RecoveryAMD has seen a deep retracement from its 2024 highs, but it now looks like the stock is trying to stabilize. However, a straight push to new highs may not be likely just yet, as we’re still tracking an ongoing running triangle—an A-B-C-D-E pattern.
Looking at the daily chart, things do look promising for more upside into wave D as we’re seeing a clean five-wave move up on the lower time frame, suggesting we may be in wave A of that D-leg. After a pullback, there could be some very interesting opportunities on the long side.
Support levels on dips to watch are around 115 and 123, while upward projections for this three-wave D-leg rally could be toward the 166 gap area and potentially 185.
Highlights:
Direction: Up after pullback
Support: 115–123
Upside projection: 166 (gap), 185
Grega

Gold Finds Supports – Is the Rebound About to Begin?Gold ( OANDA:XAUUSD ) declined to the Support zone($3,312-$3,290) and Support lines as I expected in the previous idea .
Gold is currently trading in the Support zone($3,312-$3,290) and near a set of support lines .
In terms of Elliott Wave theory , it seems that Gold has completed the Zigzag Correction(ABC/5-3-5 ) and we should wait for the next 5 impulse waves . One of the confirmation signs of the end of these corrective waves could be the break of the resistance line .
I expect Gold to trend higher in the coming hours and rise to at least $3,343 AFTER breaking the Resistance line .
Second Target: $3,364
Note: Stop Loss (SL) = $3,287
Gold Analyze (XAUUSD), 1-hour time frame.
Be sure to follow the updated ideas.
Do not forget to put a Stop loss for your positions (For every position you want to open).
Please follow your strategy; this is just my idea, and I will gladly see your ideas in this post.
Please do not forget the ✅ ' like ' ✅ button 🙏😊 & Share it with your friends; thanks, and Trade safe.

XAG/USD elliot wave countFXOPEN:XAGUSD
📊 Silver – Elliott Wave Analysis (Overview)
🔹 Macro Structure:
We’ve already completed the larger Wave 3 and are now transitioning into Wave 4.
🔹 Corrective Structure – Wave 4:
The A wave of the correction is already completed.
The B wave has also been completed.
We are now in the process of building the C wave, which will complete Wave 4.
🔹 Internal Structure of Wave C:
From the end of Wave B, we’ve already formed a (1) and (2) (in brackets).
Within this move, another smaller (1) and (2) have now unfolded, and we are currently on the way to the (3) of C.
🔹 Market Context:
Target zones and entry zones are already marked on the chart.
These zones can still be adjusted, depending on how price action develops in the coming days.

XAU/USD elliot wave countOANDA:XAUUSD
📊 Elliott Wave Analysis (Overview)
🔹 Primary Structure: We're currently moving from white Wave 3 into white Wave 4.
🔹 Wave 4 Breakdown:
So far, Wave 4 is developing as a typical ABC corrective pattern.
Waves (A) and (B) (in brackets) have already been formed.
🔹 Wave (B) Internal Structure:
Wave (B) is unfolding as an impulse: we’ve completed Bracket 1, Bracket 2, and we’re now on the way into Bracket 3.
Within Bracket 3, we've already built a yellow Wave 1 and a potential yellow Wave 2.
🔹 Current Market Condition:
For the bearish scenario to stay valid, we must remain below the red trendline.
If we break above the red trendline, then yellow Wave 2 would likely extend higher and complete itself inside the red Fibonacci zone — making the correction deeper.
🎯 Target Zones:
Targets for yellow Wave 3 and the broader Bracket 3 are already displayed on the chart.
However, these targets can still be adjusted depending on how price unfolds in the coming sessions.

Gold Long: the video explanationHere I discussed how I came out with the completion of the correction for Gold and explain why it may be a good idea to set the stop loss slightly lower.

Bitcoin - Bull Trap! Don't get caught (Buy at 102,909 USD)Bitcoin has been pumping last week, but the problem is that the bulls made a false breakout above the bullish flag / descending channel. We see that the price went above the channel but failed to continue in the uptrend. This is called a false breakout of a pattern or a bull trap. Usually what happens next is that the price goes in the opposite direction!
That's a pretty bearish case because the bulls are now trapped in their long position, and we all know that the whales need liquidity (orders and stop losses). That's why they will be ready to push the price to the downside, potentially to the 0.618 Fibonacci retracement of the previous impulse wave.
From the Elliott Wave perspective, this is a bullish setup, but we have just finished an impulse wave (1), so we should wait for an ABC correction (wave (2)) to form before entering a long position. I expect Bitcoin to hit 102,909 USD in the short term because there is the 0.618 FIBO. Also, we have an unfilled FVG between 102k - 104k on the daily chart. Usually these kinds of gaps tend to be filled sooner rather than later; that's why I expect a pullback.
Write a comment with your altcoin + hit the like button, and I will make an analysis for you in response. Trading is not hard if you have a good coach! This is not a trade setup, as there is no stop-loss or profit target. I share my trades privately. Thank you, and I wish you successful trades! Trading tip at the end: Organize Personal Life - Professional traders have great management of their personal life as they keep their trading activities from personal concerns. Balancing your personal life is essential to achieve harmony as well as improve your performance in trading.

GOLD continuation setupGold reached the 100% extension for a C wave correction after a 5 wave move to the upside, additionally 50% retracement of that 5 wave move 2 very good confluences for a continuation buy
GBP/USD – Bearish Shift Confirmed | Structure Breakout + AO DiveThe market just gave us a textbook setup on GBP/USD!
🔍 Analysis Overview:
A clear bearish divergence has formed between price and the AO (Awesome Oscillator), signaling potential trend exhaustion at the top.
We saw a rising wedge break to the downside, with a structure breakout confirming a shift in momentum.
Price decisively broke below the 1.36109 support level, indicating bearish control.
📊 Technical Confluence:
AO shows bearish divergence, confirming weakening bullish momentum.
Structure breakout from the wedge pattern aligns with AO signals.
Fibonacci retracement and extension levels give a clear target zone:
🎯 TP1 area: 1.35805 – 1.35895 (Fib 1.618–1.786 extensions)
⏳ What I'm Watching:
I'm now waiting for a pullback to retest the broken structure (possibly around the 0.382–0.618 Fib levels: 1.36242–1.36323). A bearish reaction here could provide a high-probability reentry opportunity.
💡Trade Idea Summary:
Bias: Bearish
Signal: Divergence + Structure Break
TP Zone: 1.35805 – 1.35895
Watch for: Pullback to retest broken structure before continuation
📈 Stay alert and manage your risk wisely!

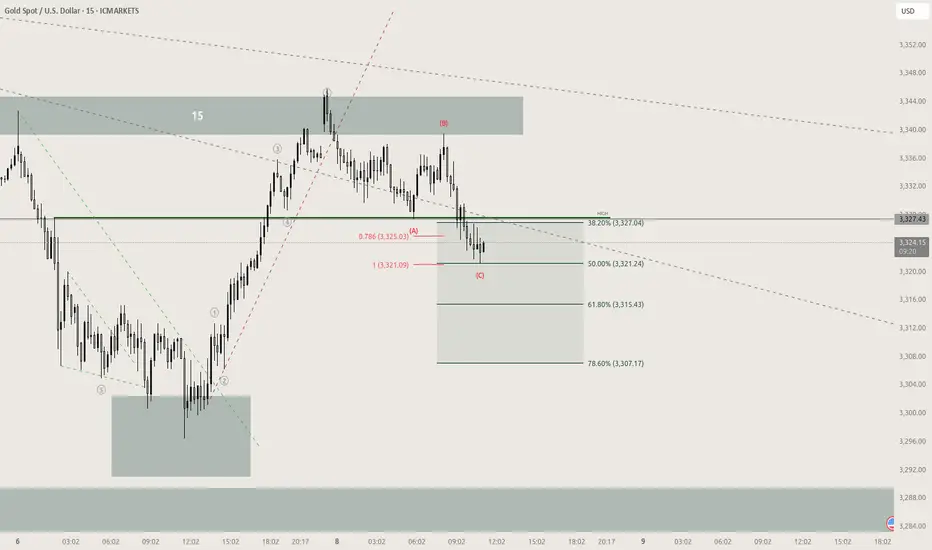
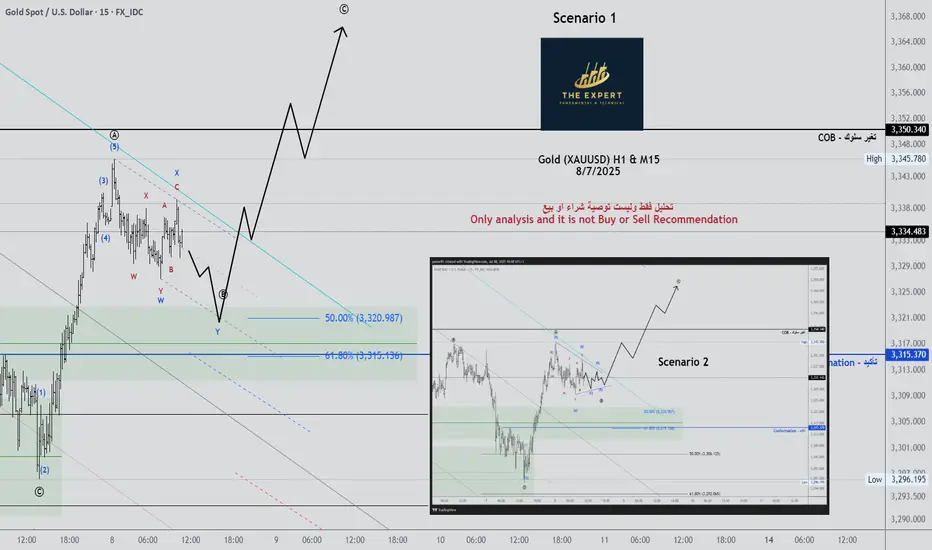
Gold (XAUUSD) H1 & M15 - Update 8/7/2025Gold (XAUUSD) H1 & M15 - Update 8/7/2025
there are 2 scenarios as shown
GOLD → Correction for confirmation before growthFX:XAUUSD is recovering due to increased demand as a safe-haven asset. After breaking through local trend resistance, an upward channel is beginning to form on the chart.
On Monday, gold tested the 3295-3300 zone (liquidity zone) and, against the backdrop of incoming economic data, is buying back the decline, forming a rather interesting pattern that could lead to continued growth, but there is a but!
Investors are reacting to President Trump's threats to impose tariffs on imports from a dozen countries starting August 1. In addition, the main question is the Fed's interest rate decision. The regulator is likely to leave the rate unchanged due to inflation risks.
Uncertainty surrounding tariffs is supporting interest in gold as a safe-haven asset. The market is awaiting further news and the publication of the Fed minutes on Wednesday.
Resistance levels: 3345, 3357, 3396
Support levels: 3320, 3311, 3295
A correction to support is forming. If the bulls hold their ground within the upward channel and above the key areas of interest, the focus will shift to 3345, a resistance level that could hold the market back from a possible rise. A breakout of this zone would trigger a rise to 3357-3396.
Best regards, R. Linda!

Dollar Index-Stops At Gap ResistanceAfter just a temporary setback in stocks and a brief move higher in the dollar earlier this week, we’re once again seeing a strong reversal across the board. This comes after Donald Trump extended the July 9th tariff deadline to August 1st, giving more time for trade negotiations with various countries. That brought some optimism back into the markets, and if stocks continue to gain, the dollar index is likely to remain in its downtrend.
In fact, the dollar index stopped right at the June 26th gap near the 97.70 resistance level. We believe that the corrective price action from July 1st could now be coming to an end, and the market may resume lower—especially if we get a breakout below the corrective channel support near 97.
GH

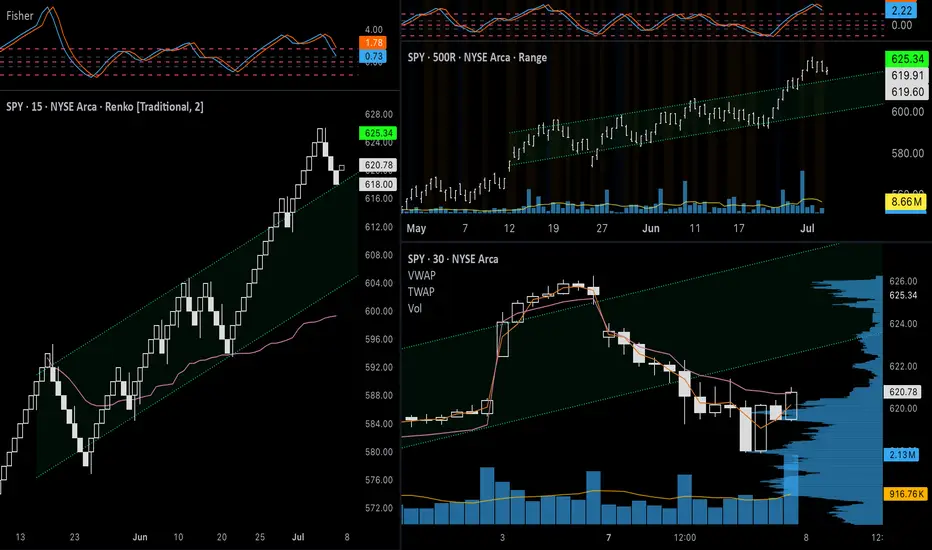
SPY July 8th 2025SPY July 8th 2025
Day 2 of journaling my trades. Ended Monday green but not without mistakes. I am heading into Tuesday with more of a neutral outlook. Previous resistance will be tested as support and could find buyers or fail to do so. As I did yesterday, I will give a breakdown of what I’m seeing on all of my charts for both strategies.
+++++++++++++++++++++++++++
Bullish Analysis
Renko: The price pulled back on Monday, as expected, and may continue lower to retest the top of the channel (around $615). Fisher Transform is still in positive territory and strong support at that level could lead to the price reaching higher highs.
500R ($5) chart: Similar structure to the Renko chart. I’m using a higher range here to compensate for volatility. Just like with the Renko chart, a bounce on the top of the channel would be a healthy pullback before higher highs. There is a high volume node on the volume profile, so interest from buyers here could be strong enough to prevent the price from falling back into the channel.
4h chart: The last three candles have the appearance of a healthy pullback. There was declining volume and
the most recent candle is somewhat of a bullish hammer. I also have an anchored VWAP going back to June 30 that the price seems to be respecting. The price bounced off of it in the first 4h candle on Monday and managed to close above it after a dip during the formation of the second candle.
+++++++++++++++++++++++++++
Bearish Analysis
Renko: Same chart with a lower box size ($1 instead of $2). As you can see, there is bearish divergence on Fisher Transform. The price also found likely temporary support before reaching the top of the channel, suggesting that it could make at least one more wave down if a larger corrective trend unfolds. The 1.382 ($614) and 1.618 ($612) Fibonacci extensions will be important reference points to watch. I would feel less confident about the strength of the bullish trend if the price goes beyond the 1.618 extension.
200R ($2) Range: The Range chart in this layout is the only one that I am including extended hours data on, so the channels have slightly different levels. On this chart I am using two trend lines on the upper level to illustrate the possible areas of support/previous resistance. If the price breaks back into the channel and below the 34VWMA, it could signal a trend failure and the price could return to $600 or lower. Volume bars on range charts also offer a different perspective than on time-based candlesticks. Here, since each bar represents a $2 move up or down, the volume inside of each bar can show the level of effort it took to move the price either direction, whereas the time-based charts are simply showing the level of interest during a particular time period. For this reason, consistently high volume during this last move up could be a sign that there is a larger presence of sellers. Lastly, there is Fisher Transform divergence here as well.
1h chart: CME_MINI:ES1! is green overnight, signaling continuation of the bounce we saw at the end of the day on Monday. With a tighter channel, the top was rejected in a classic bearish reversal candle pattern above the channel and made a clean break down below the channel. The price found support just above the anchored VWAP from the start of the channel, so there could still be institutional interest around $617 and below. If this correction were to unfold into three distinct waves, a 0.618 pullback (to the 0.382 level of the fib extension; $623) would retest the previous demand of the channel. A rejection here could have the price looking for support in a lower volume zone. A (c) wave could take the price down to $615-$611.
+++++++++++++++++++++++++++
Options Analysis
As I have explained, I think it is possible that we will see the price hit $623 during the Tuesday session, so it could be an important level for ATM options. TVC:VIX held its level on Monday after the gap up but failed to make progress - finding resistance at the 200MA on the 1h chart. The rounding bottom and bullish candles on the 30m AMEX:SPY chart looks better than other timeframes. From a Wyckoff Method perspective, however, it looks like puts are in a distribution pattern and calls are in accumulation. Volume is low for both of these contracts, but especially lower on the Put option, indicating lack of interest.
If the put contract makes a lower low on Tuesday (below $3.55 or above $620.75 for SPY), this particular contract could break into a downtrend. Calls seem to be the safer bet since the price has already made a higher high and has wider support. An ideal entry would be a false breakout at $0.95 ($621.00 for SPY) or a retest of the top of the channel after a true upside breakout at $1.50 ($622.50 for SPY) The upside breakout possibility would have stronger confirmation, so it would be worth the higher premium price. This movement would need to be accompanied by high volume, of course.
For puts, I would like to see higher volume at the bottom of the range, since it seems like the underlying price will open higher. I would probably switch to a contract with a lower strike since $623 would be ITM but for the sake of this idea, I would target entry of $623p around $3.65 ($620.75 for SPY).
+++++++++++++++++++++++++++
Targets
Calls: Enter $622.50, Target $628-$630, Stop Loss $621
Puts: Enter: $620.75, Target $615, Stop Loss $621.50
To summarize, I like the risk/reward and volume better for calls, and it fits my original thesis, however if volume increases on puts at these elevated levels, it will be important to get in at a price that minimizes risk exposure to take advantage of a deeper correction.
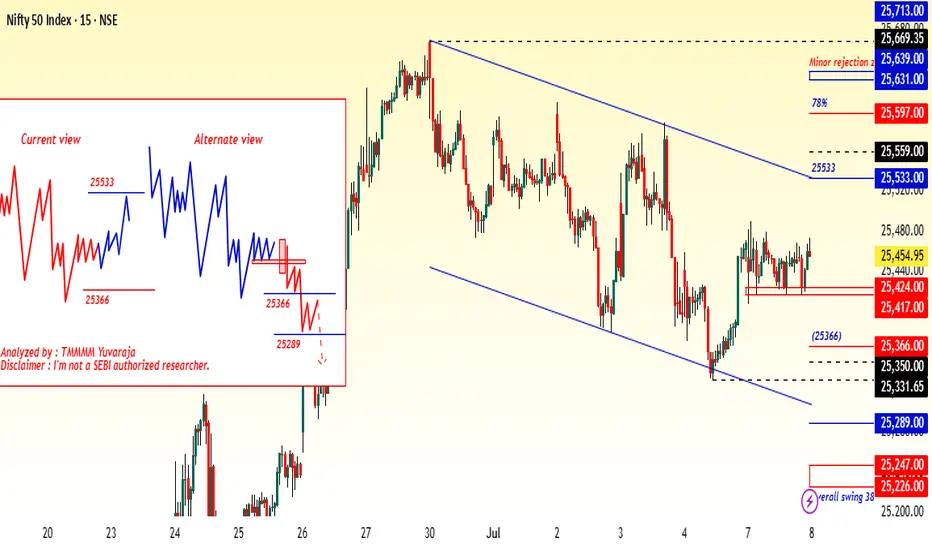
#Nifty directions and levels for July 8th:Good morning, Friends! 🌞
Here are the market directions and levels for July 8th:
Market Overview
The global markets have a moderately bullish sentiment, while our local markets are showing a moderately bearish sentiment. Gift Nifty is indicating a neutral to slightly negative start of around 10 points today.
So, what can we expect today?
Last evening, the Dow Jones fell more than 1%, but Gift Nifty didn’t reflect that. However, our markets continued to trade within a range, maintaining a moderately bearish bias. So, there’s nothing new; we can follow the same sentiment we saw in the previous session.
This means if the market pulls back initially, we may see a minor pullback followed by some consolidation. This is my first variation (current view).
On the other hand, if the decline shows a solid structure and breaks the immediate support level, we can expect the correction to continue. If that happens, it could mark the beginning of a C wave or 3rd wave of the correction. This is my alternate view.
#Banknifty directions and levels for July 8th:if the market pulls back initially, we may see a minor pullback followed by some consolidation. This is my first variation (current view).
On the other hand, if the decline shows a solid structure and breaks the immediate support level, we can expect the correction to continue. If that happens, it could mark the beginning of a C wave or 3rd wave of the correction. This is my alternate view.
