GBPJPY Elliott Wave AnalysisHello friends
We are witnessing the formation of a complete Elliott wave pattern on the GBPJPY chart. These waves from 1 to 5 are quite clear and you can even count their subwaves (especially the microwaves of the main wave 3). Now wave 5 is completing and moving inside an ascending channel.
At the moment, the microwaves of the 5th wave have not been completed, so we expect the price to grow within this channel. The minimum growth is up to 200.00, of course, it can grow even more.
But after the completion of the 5th wave, with the breakdown of the trend line drawn below and a return to it, we can expect the price to fall to the specified support. The first support is 196.00. Of course, the price decrease in the 5th wave is always accompanied by divergence and a decrease in the slope of the chart, as you can see that the slope of wave 5 is much lower than wave 3.
Good luck and be profitable.
Elliott Wave

GOLD → Buyers are hesitant due to new tariffsFX:XAUUSD continues its correction phase after updating local highs and breaking through trend resistance. The dollar is making traders nervous...
After rising 2% last week, gold started Monday with a decline to $3,300 amid a stronger dollar due to the risk of new tariffs from Trump, who sent letters to 12 countries threatening to impose duties of up to 70% if no agreements are reached by July 9. This boosted demand for the dollar as a safe-haven asset.
Gold is also under pressure from strong US employment data, which has dampened expectations of a rate cut. The market is focused on news on tariffs and the publication of the Fed minutes on Wednesday, which may clarify the outlook for monetary policy.
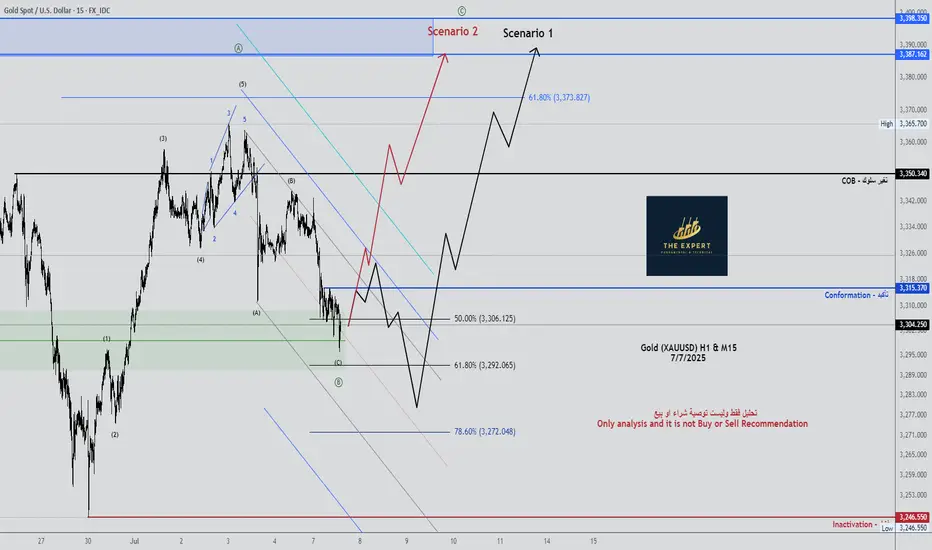
Technically, the correction may end in the 0.7 Fibonacci zone, in the range of 3295-3300. After the formation of a reversal pattern, the market may strengthen to 3350-3360.
Resistance levels: 3315, 3344, 3358
Support levels: 3300, 3295
Locally, the price is trying to consolidate below the range, which could lead to a decline to 3300-3295. If, during the correction from support, the market manages to consolidate above 3315, we can expect growth. Otherwise, a weak reaction at 3295 could lead to a retest of 3275 and consolidation in the selling zone, which could lead to a further decline to 3245 .
BUT! We are closely monitoring the position of the US and Trump on tariffs, as he is once again issuing ultimatums to countries, to which the markets are reacting...
Best regards, R. Linda!

GBPUSD → Correction before the bullish trend continuesFX:GBPUSD is forming a trading range for consolidation of potential ahead of a possible continuation of growth as part of a countertrend correction.
The dollar is trying to recover from its decline due to a local change in the fundamental background, but the global trend for the DXY is bearish. This could provide support for the GBP to continue growing, provided that the bulls hold their defense above the 0.5 Fibonacci zone of the main impulse movement.
The market is holding GBPUSD within the trading range of 1.359 - 1.3675. The trend is bullish, and within the correction, liquidity may be captured from 1.359 before further growth.
Resistance levels: 1.3675, 1.3764
Support levels: 1.359, 1.3511
If the reaction to the subsequent retest of support at 1.359 is weak, we can consider a continuation of the correction to the 0.7-0.79 Fibonacci zone, which would be the most favorable entry point for us (focus on 1.3511 — a false breakout will increase interest in buying). In the current situation, the focus is on 1.359.
Best regards, R. Linda!

XAU/USD💰Symbol: { XAU/USD }
🟩Price: { 33077.35 }
🟥Stop: { 3282.67 }
1️⃣profit: { 3323.66 }
2️⃣profit: { 3346.85 }
3️⃣profit: { 3373.94 }
4️⃣profit: { 3394.65 }
📊Check your chart before entering.
🚨Check before use to make sure there is no important news.🚨

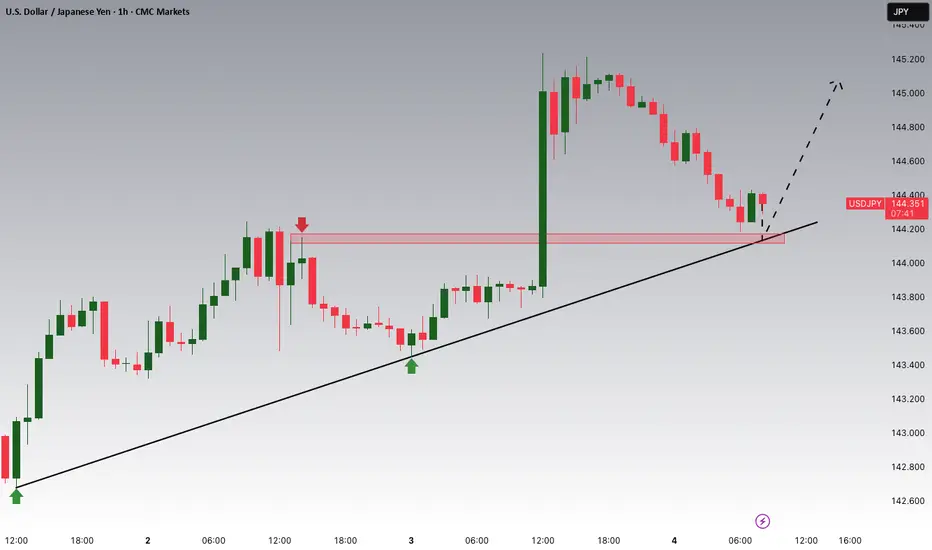
USDJPY Potential UpsidesHey Traders, in today's trading session we are monitoring USDJPY for a buying opportunity around 144.100 zone, USDJPY is trading in an uptrend and currently is in a correction phase in which it is approaching the trend at 144.100 support and resistance area.
Trade safe, Joe.
USDCAD Potential UpsidesHey Traders, in tomorrow's trading session we are monitoring USDCAD for a buying opportunity around 1.35750 zone, USDCAD is trading in an uptrend and currently is in a correction phase in which it is approaching the trend at 1.35750 support and resistance area.
Trade safe, Joe.

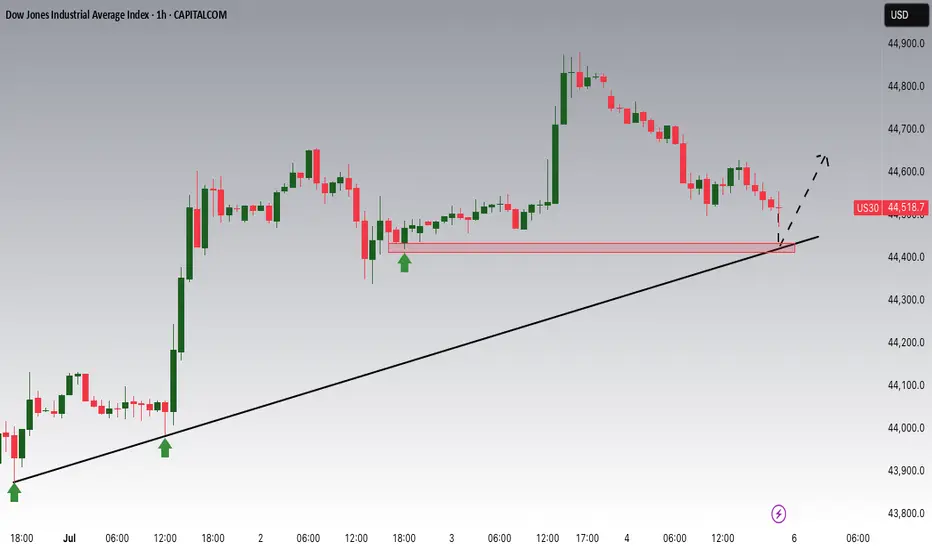
Dow Jones Potential UpsidesHey Traders, in tomorrow's trading session we are monitoring US30 for a buying opportunity around 44,400 zone, Dow Jones is trading in an uptrend and currently is in a correction phase in which it is approaching the trend 44,400 support and resistance area.
Trade safe, Joe.
AUDUSD Potential UpsidesHey Traders, in today's trading session we are monitoring AUDUSD for a buying opportunity around 0.64600 zone, AUDUSD is trading in an uptrend and currently is in a correction phase in which it is approaching the trend at 0.64600 support and resistance area.
Trade safe, Joe.

Bitcoin Bullish Continuation in Progress🔵 Bitcoin Weekly structure confirms higher highs & higher lows, reinforcing the bullish trend.
📈 As long as CRYPTO:BTCUSD holds above key support near $106K, the next leg could target $127K–$143K within the coming 2 months.

$WING - Wingstop: The Stock Still Has Wings To SoarThe rally from $204.00 looks very strong and is part of primary wave 5 (black).
The current pullback looks to be a simple zigzag that is testing the 38.2% Fibonacci retracement level at $317.80.
A deeper pullback will next test the 50% retracement level at $296.07.
$204.00 does not look under threat so the bias is strongly bullish.

$EIX - Edison: Wild Fires, Double Bottom - A Trend Reversal? The decline from $88.77 looks to have completed its five-wave sequence.
Primary wave 4 (black) unfolded as a triangle, and the decline to $47.73 could be all of primary wave 5.
Primary waves 3 and 5, if the decline is complete, have created a double bottom reversal pattern.
$47.73 is the key invalidation level for the bullish outlook.

BNB Stuck in Barrier Triangle?CRYPTOCAP:BNB appears to be in a macro wave 4 barrier triangle, and for some time.
It has held up particularly well during the alt coin massacre, not even reaching the .382 Fibonacci retracement.
Price is testing the upper boundary for the 4th time, that starts to give us the higher probability breakout which increases with each test. The daily 200EMA and pivot were tested as support successfully.
Safe trading.

$FET Ready for the next move up?NYSE:FET looks ready for the next move up with a similar analysis to many other alts I have shared.
It is breaking out of descending resistance after testing the .618 Fibonacci retracement and High Volume Node (HVN) as support. Price broke above the daily pivot and is now swinging below, a recovery above the local swing high will be a bullish signal to go long with a wave 3 target of the R3 daily pivot and major resistance HVN at $1.13.
Analysis is invalidated below $0.54
Safe trading

GOOGLE Count changed, Bullish outlook.I have adjusted NASDAQ:GOOG NASDAQ:GOOGL Elliot wave count with a wave 1 completing a leading diagonal backed up by a deep wave 2 correction into High Volume Node support (HVN). We potentially have another 1-2 with fast drop and recovery to the S1 daily pivot which would make long term outlook extra bullish by extending target.
Wave 3 is underway with a target of the all time hime high HVN for wave 5. The next resistance HVN is $191.
Price above the daily pivot and is continuing upwards after testing as support.
Analysis is invalidated below $162 swing low.
Safe trading

$HBAR Ready for a move up?CRYPTOCAP:HBAR appears to have completed its wave 2 WXYXZ complex correction
It has broken its descending resistance & daily pivot, retested both as support and is approaching the local swing high which would be a bullish long signal.
Cautious traders may want to take partial take profit at the first resistance High Volume Node and R1 pivot $.18 and a secondary target with good RR is the swing high resistance node at $0.22.
Analysis is invalidated below $.14 swing low.
Safe trading

PORTAL / PORTALUSDTBack again with this monster chart>>>
Let’s see how it plays out!
• Warning •
Any deal I share does not mean that I am forcing you to enter into it, you enter in with your full risk, because I'll not gain any profits with you in the end.
The risk management of the position must comply with the stop loss.
(I am not sharing financial or investment advice, you should do your own research for your money.)

$ETH Breakout this week?CRYPTOCAP:ETH local chart looks ready
I think were looking at a decent ETH breakout this week to the next resistance High Volume Node at $3600 minimum target.
👉 BTC is consolidating under all time high resistance after multiple tests which is usual a sign of bullish continuation. Usualy giving alts room to room.
👉 Ethereum is above the daily 200EMA, daily pivot and also consolidating under resistance once more after testing the 0.382 Fibonacci retracement and S1 daily pivot adding confluence to that being the local bottom. This appears to be Elliot wave 2, a shallow wave 2 retracement (less than 0.5) is a show of strength and investor impatience.
Analysis invalidated below the daily pivot and daily 200EMA as this will lock in 3 waves up and look corrective.
Safe trading

$NEAR Disappointing so far...CBOE:NEAR is disappointing me as it continues towards the lows
Testing the .786 alt-coin golden pocket High Volume Node so should see a decent reaction from here as it appears a an ABC correction is complete after an Elliot wave motif wave.
Safe trading

Gold new ATH soon?🟡 GOLD LONG SETUP: Buying the Fear at Key Support 📈
ICMARKETS:XAUUSD
"Be fearful when others are greedy, and greedy when others are fearful" - Warren Buffett
The oscillator we developed is showing some compelling signals on gold right now, and the market sentiment couldn't be more perfect for a contrarian play. 💎
Technical Analysis:
Our custom oscillator is painting a clear picture at the bottom - we're seeing those beautiful green zones emerging after extended red periods
Price action has found solid support around the 3,300 level, creating a strong foundation for the next leg up
The fear in the market is palpable, which historically has been an excellent buying opportunity for precious metals
Volume profile suggests accumulation is happening at these levels
Why This Setup Works: 🎯
The beauty of this oscillator lies in its ability to identify when institutional money starts flowing back into gold during periods of maximum pessimism. When retail traders are panicking and selling, smart money is quietly accumulating.
Key levels to watch:
• Support: 3,300 (current zone)
• First target: 3,350
• Extended target: 3,400+
Risk Management: ⚠️
• Stop loss below 3,275
• Position sizing: Never risk more than 2% of account
• Trail stops as momentum builds
The oscillator's fear signals have been remarkably accurate in identifying these reversal points. When fear reaches extremes, that's typically when the best opportunities present themselves.
This is not financial advice - always do your own research and manage risk appropriately.
What are your thoughts on this setup? Are you seeing similar signals on your charts? 🤔
#Gold #XAUUSD #TechnicalAnalysis #BuyTheFear #Oscillator

DXY TrendlinesUnless it brakes the downtrend with a weekly candle close it should bounce back up in long run. should be closely monitored since it will give us a lot of information about current market direction. i expect bouncing back up but we will see.

GOLD swing longPlacing bids for potential 1-2 setup to the upside, grey box is ideal target for this setup to trigger however scaling in on spot won't hurt

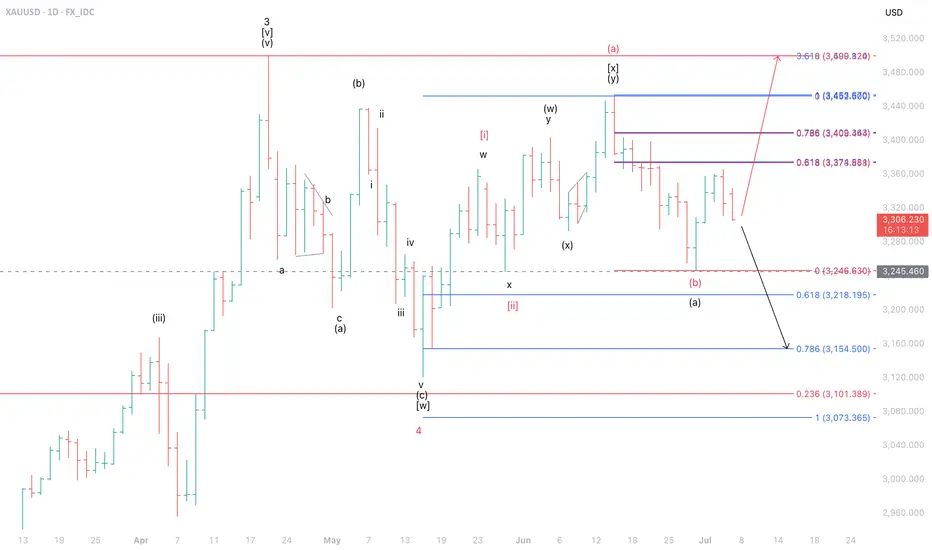
XAUUSD at a CrossroadsOn the daily timeframe, we identify two possible scenarios for XAUUSD. Under the red label, as long as XAUUSD remains above the 3,245 level—serving as a stop-loss—there is potential for further upside to test the 3,378–3,500 area.
However, in the worst-case scenario illustrated by the black label, if XAUUSD breaks below its key support, the next downside target would be in the 3,154–3,218.