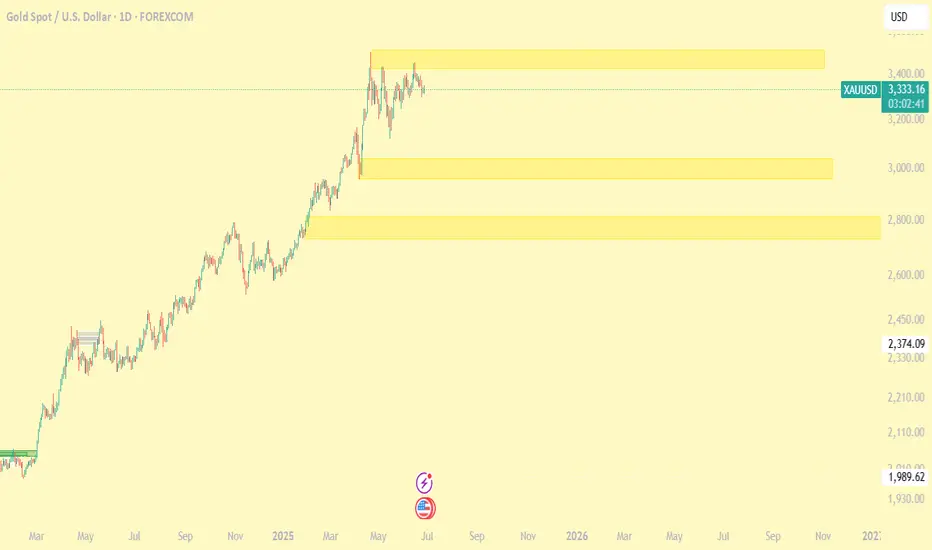
Gold's Decline Not Over (Yet)#Gold is in a declining pattern that appears incomplete. Here are 2 models we are following closely.
1. A decline in wave (iii) of ((c)) - targeting $3,120
2. A decline in wave iii of (ii) - targeting $3,220-3,240
Both models imply the current decline is not over.
FLAT PATTERN
The flat pattern subdivides as a 3-3-5 ((a))-((b))-((c)) pattern. The decline appears to be in the latter stages of this pattern, wave ((c)).
This wave needs to unfold as a motive 5-wave pattern...it appears we are in the 3rd wave decline so a couple of more trends lower. The flat targets $3,120.
LEADING DIAGONAL
The leading diagonal is a motive pattern labeled i-ii-iii-iv-v. The leading diagonal pattern is already complete and now a partial retracement lower of the diagonal is underway. This partial retracement likely carries to $3,220-$3,240.
Under both scenarios, once they are complete, a strong rally is likely to follow. However, the downtrends need more price and time to develop so the rallies are on hold for the moment.
Elliott Wave

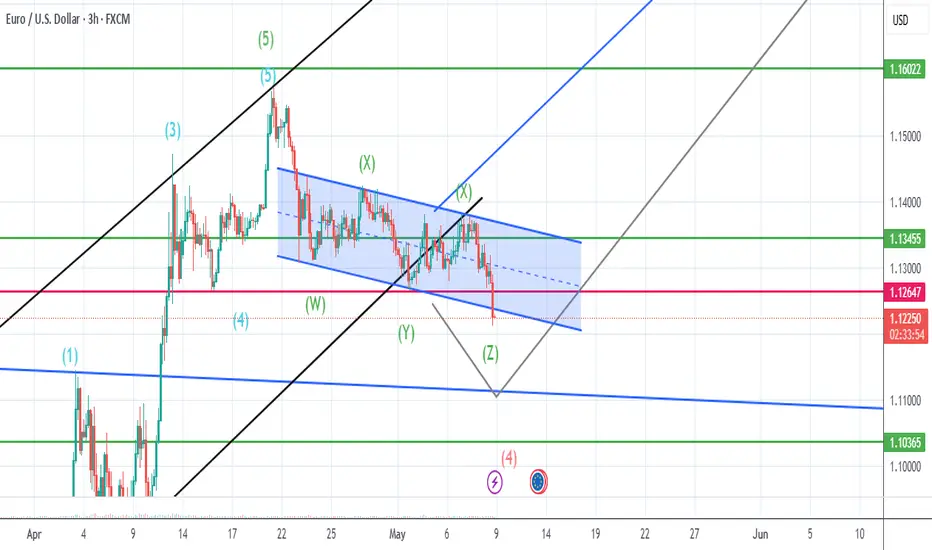
should be going up after correction ends.cant be certain when it comes down to correction waves, it might be here 1.1211 it might go little bit more down around 1.1152 or 1.10 but when it ends it will go for higher than 1.17 also correction wave lenght will give us a better idea where the tp should be so i will keep my first buy position and will add when i am certain when next impulse wave started.
XRPBTC May Face Another Rally This YearXRPBTC pair can be trading in a larger weekly (A)(B)(C) flat correction, where wave (C) can be now in progress as a five-wave bullish impulse back to 2021 highs.
XRPBTC is currently slowing down due to BTC dominance, but notice that it's now testing February 2025 lows, so wave 4 correction can be coming to an end, which can extend the rally for wave 5 of (C) towards 0.000040 area and it can bring the ALTseason.

S&P500 and Nasdaq Short: Wave 5 <= Wave 3Based on the Elliott Wave rule that wave 3 is not the shortest wave, I gave a projection on where the peak of both S&P500 and Nasdaq could be. Based on these peaks, the stop is set above and the take profit target is where wave 4 was.

Gold Breakdown Confirmed — Bearish Pennant Targets UnfoldingGold ( OANDA:XAUUSD ) started to decline as I expected in my previous idea after the lower lines of the Ending Diagonal broke .
Gold is moving near the Resistance zone ($3,349-$3,325) . And Gold seems to be crossing the 50_SMA(Daily) .
From a Classical Technical Analysis perspective , the Bearish Pennant Pattern seems to indicate a continuation of the downtrend in Gold .
From an Elliott wave theory perspective , it seems that Gold has completed the Zigzag Correction(ABC) , and we can expect the next 5 downwaves .
I expect Gold to continue to decline at least to the Support zone($3,281-$3,243) and Monthly Pivot Point .
Note: Stop Loss (SL) = $3,360
Gold Analyze (XAUUSD), 1-hour time frame.
Be sure to follow the updated ideas.
Do not forget to put a Stop loss for your positions (For every position you want to open).
Please follow your strategy; this is just my idea, and I will gladly see your ideas in this post.
Please do not forget the ✅ ' like ' ✅ button 🙏😊 & Share it with your friends; thanks, and Trade safe.

#Nifty directions and levels for June 27Good morning, Friends! 🌞
Here are the market directions and levels for June 27:
Market Overview
Both the global markets and our local markets are showing bullish sentiment. Gift Nifty is also indicating a positive start of around 30 points today.
So, what can we expect today?
In the previous session, Nifty performed well and Bank Nifty also supported the move.
Structurally, the trend still appears bullish. So, if the market opens with a strong candle formation,
we can expect a further continuation of the rally.
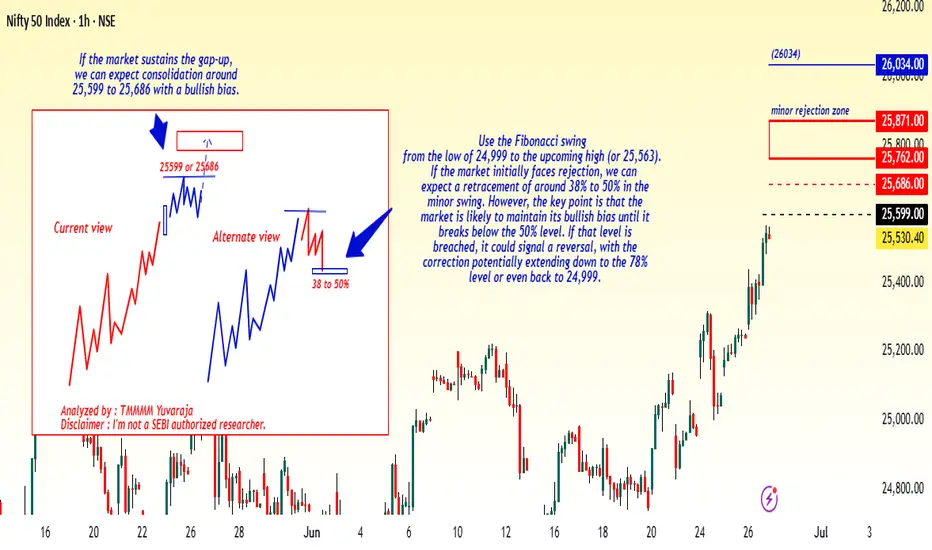
However, my personal opinion is based on sub-wave calculations, the upcoming wave could be the 4th wave—which is typically a consolidation phase.
So, after the gap-up, the market may consolidate around the immediate resistance zone.
On the other hand, if the gap-up does not sustain or if the market faces rejection near the immediate resistance,
it could lead to a correction of around 38% to 50% in the minor swing.
The key point here is: until the market breaks below the 50% level, the overall bias may remain bullish. But if the 50% mark is broken,
it could lead to a reversal, with deeper correction possible.
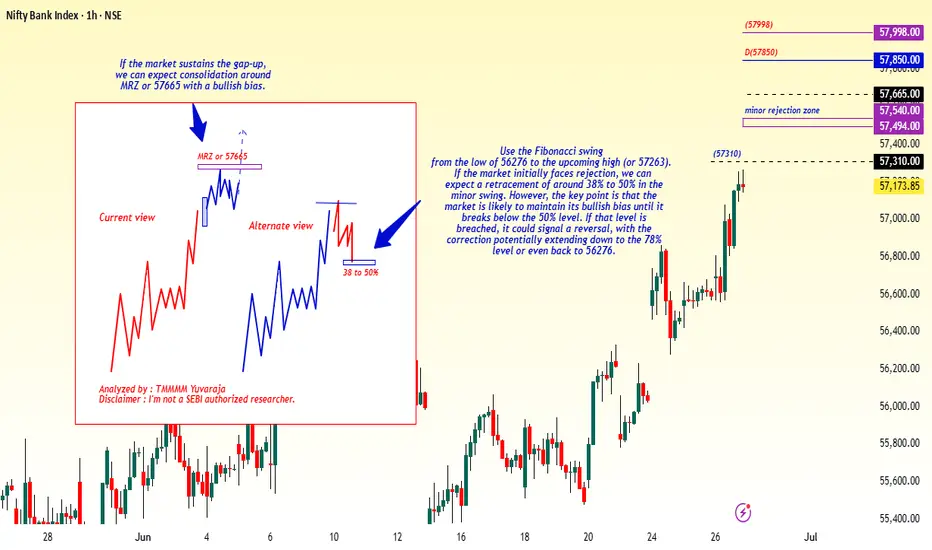
#Banknifty directions and levels for June 27Structurally, the trend still appears bullish. So, if the market opens with a strong candle formation,
we can expect a further continuation of the rally.
However, my personal opinion is based on sub-wave calculations, the upcoming wave could be the 4th wave—which is typically a consolidation phase.
So, after the gap-up, the market may consolidate around the immediate resistance zone.
On the other hand, if the gap-up does not sustain or if the market faces rejection near the immediate resistance,
it could lead to a correction of around 38% to 50% in the minor swing.
The key point here is: until the market breaks below the 50% level, the overall bias may remain bullish. But if the 50% mark is broken,
it could lead to a reversal, with deeper correction possible
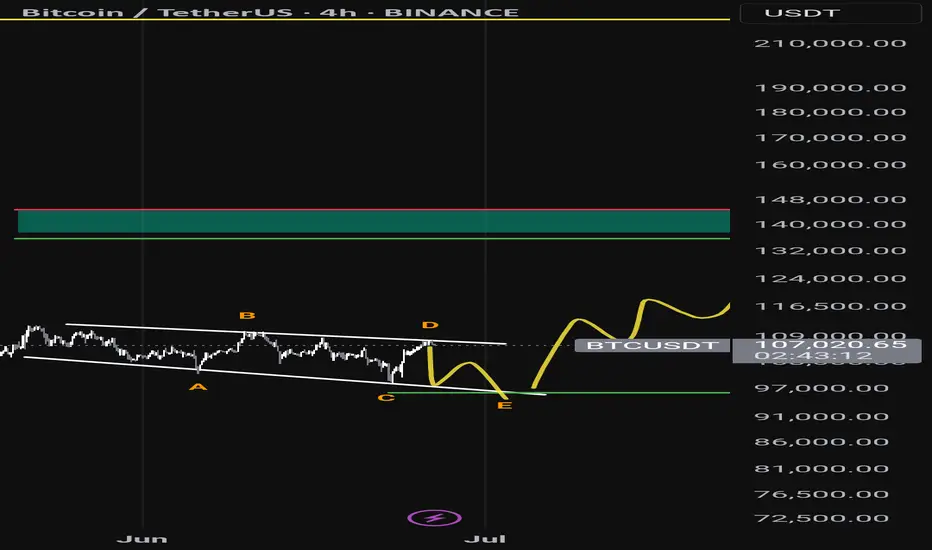
Bitcoin Top is In! Bear considerationsPrice has been carving out an unclear correction off the high. The recent structure has many squinting. Is it done or the calm before another wave of selling?
I am weighing two bearish scenarios here. One is more aggressive than the other. But both start with the same idea. No new high before another low.
Let’s start at the top.
The initial move down off the recent high could count as an impulse. Whether that is a wave 1 or a wave A is still up for judgment. Either way, that first leg sets a bearish tone at the larger degree.
Here’s where it gets interesting. The correction since then shows traits of a flat. A running one at the moment.
This opens the door to two active bearish projections:
A wave C collapse, implying a completed A B C correction and a downside resolution.
A wave 3 drop, for a possible top if this is an impulsive sequence.
That is the fork in the road. And it all hinges on the next move.
Right now, the smallest degree impulse off the low is doing some heavy lifting.
If that pivot holds and we only get an internal retracement like a micro wave 2, the door is still open for upside continuation.
But if that impulse gets invalidated, I would expect bears to press. First for a break below 100k, then toward the 95k area.
Here is how to think about it:
Hold the small impulse → Potential upside
Break the impulse base → Wave C or 3 likely underway
Context still leans bearish. Lower highs are still in play. But we are hunting a specific structure to confirm it.

Bitcoin Reaches PRZ with Bearish Signals — Is a Drop Imminent?Bitcoin ( BINANCE:BTCUSDT ) has reached the Potential Reversal Zone(PRZ) as I expected in yesterday's post .
Bitcoin is trading in the Heavy Resistance zone($110,720-$105,820) , Potential Reversal Zone(PRZ) , and near the Resistance lines .
In terms of Elliott Wave theory , it seems that Bitcoin has managed to complete the main wave 5 with the help of the Ending Diagonal . The structure of wave 5 can be different.
Also, we can see the Regular Divergence(RD-) between Consecutive Peaks.
I expect Bitcoin to drop to at least $105,400 .
Cumulative Short Liquidation Leverage: $107,334-$108,250
Cumulative Long Liquidation Leverage: $105,037-$103,392
Note: We could be in for a bit of excitement in the financial markets during Federal Reserve Chairman Powell's speech.
Note: Stop Loss(SL)= $109,020 = We can expect more pumps.
Please respect each other's ideas and express them politely if you agree or disagree.
Bitcoin Analyze (BTCUSDT), 1-hour time frame.
Be sure to follow the updated ideas.
Do not forget to put a Stop loss for your positions (For every position you want to open).
Please follow your strategy and updates; this is just my Idea, and I will gladly see your ideas in this post.
Please do not forget the ✅' like '✅ button 🙏😊 & Share it with your friends; thanks, and Trade safe.


Gold Short: Wave 5 of C In this video, I explained my change in the Gold Elliott Wave counts on the cycle level (red font numbering) and how I think the Gold price movement will go down in a double combination (because the previous 2 waves are double combinations).
I also go through how I set the short target using Fibonacci extensions.

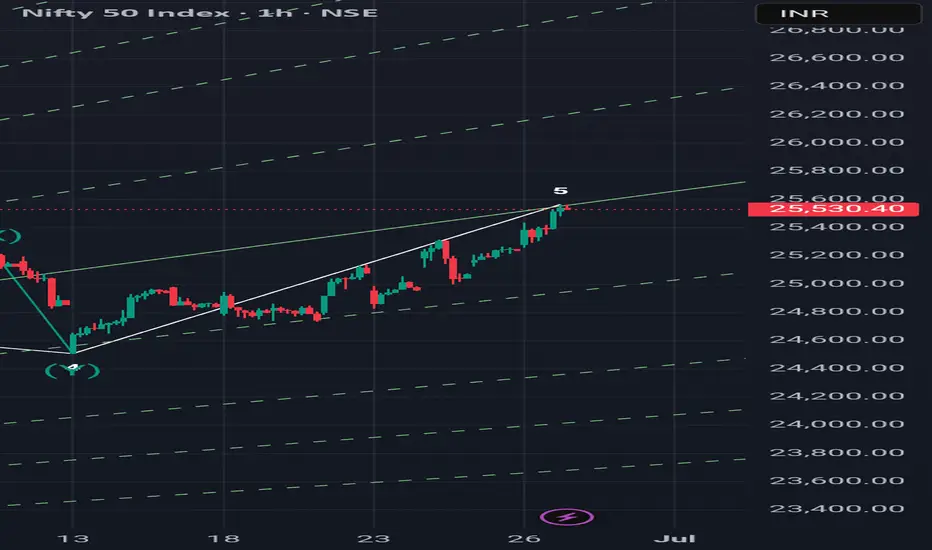
5 th wave done today? If Nifty does not able to cross 25600 by Monday and goes down after hitting today's high of 25565 then it is the indication of completion of wave 5th and now it is the end of extended flat correction ABC started from March. Many price action tools are also indicating this pivot 25565 as high. So the conclusion is this that there are 50% chances of ending of correction and we will get further confirmation after Friday's price movement.
GALA BULLISH IDEAIf the previous wave is a then this wave is near to be corrective one as it is illustrated.
so we may see c wave or three.

DJI This is 2hrly chart of DJI
looking at the chart ,
I sense this structure of EW ...
and looks this whole move has been corrective wave...
going forward...
DJI is 43185
below 42950, I would be looking for 36.5k as my target with recent high as my sl ...
Just a View!!
Vedang:)
Discliamer: Chart is for study purpose only!!

GOLD → Within range. Retest resistance at 3347FX:XAUUSD continues to correct after a false breakdown of support at 3300. Due to uncertainty, the price may remain in the range of 3300-3340 for some time.
Gold is fluctuating amid a weak dollar and uncertainty over Fed rates. Gold is struggling to hold on after rebounding from weekly lows, despite the US dollar falling to multi-year lows. Pressure on the dollar has intensified due to Trump's criticism of the Fed and rumors of a possible replacement for Powell. However, gold is limited in its growth due to a pause in geopolitical tensions and hawkish signals from the Fed chair. Investors are awaiting key macro data from the US (e 12:30 GMT Durable goods orders, GDP, Initial Jobless Claims) and especially the PCE inflation report on Friday.
Technically, the focus is on key areas of interest: 3300, 3306, 3340, 3347. Until strong news emerges, an intraday trading strategy should be considered.
Resistance levels: 3347, 3357
Support levels: 3320, 3307, 3300
Technically, a false breakout of resistance at 3347 and a retest of the local liquidity zone at 3320-3307 are possible before growth continues for the reasons mentioned above. Targets could be 3347, 3364, 3372, and 3396.
Best regards, R. Linda!

GBPUSD → Pre-breakout consolidation. One step away from a rallyFX:GBPUSD is trading in consolidation. Against the backdrop of the falling dollar index, the currency pair is testing resistance at 1.3632 but is not yet ready to bounce down.
Against the backdrop of the dollar's decline due to fundamental reasons, the GBPUSD currency pair is strengthening. Technically, this could lead to the price breaking out of consolidation upwards. A pre-breakout base is forming relative to the upper boundary of consolidation. The price is compressing towards the level, volatility is decreasing, which in general could lead to a breakout of resistance - trigger 1.3632. The exit from consolidation may be accompanied by distribution. The liquidity zone with W1 can be considered as a target.
Resistance levels: 1.3632, 1.3743
Support levels: 1.3593, 1.3508
The global and local trends are bullish. After growth, consolidation is forming. Against the backdrop of the falling dollar, GBPUSD is testing resistance. The reaction to the false breakout of resistance is weak. The chances of a breakout are quite high.
Best regards, R. Linda!

GBPJPY Keeps Recovering, But It’s Approaching ResistanceGBP/JPY is on the rise but is approaching the upper boundary of the 2024–2025 range, which could present strong resistance around the 200 level. Keep in mind that the decline from the 2024 highs to the July lows near 180 was impulsive, while the current rebound appears slow and corrective—possibly a wave B within a flat correction or even part of a triangle formation. In either case, we believe some further sideways price action is likely, followed by a potential downward turn from this prior subwave A resistance zone.


LTCUSD - Bottom in, starting wave 3In green we see the levels to be taken out as a corrective wave, but the structure is very much impulsive, so we aim fot the impulsive fib targets of 1.6 and 2.3.
Let's go!!

NiftyNifty
looking at the chart, we can see 5waves getting completed....
if this structure holds true ...
24000 would be 1st tgt...
just a view!!
Vedang :)
Disclaimer: Chart is for study purpose only!!

Is Gold Ready to Rally, Elliott Wave 5 at Key Trending SupportGold is sitting right at a critical ascending trendline support—this could be the make-or-break level between wave continuation and deeper retracement.
I have identified this as the potential end of sub-wave 2 of the final Wave 5. This makes the current support zone a high-probability long entry—as long as it holds.
📈 Bullish Scenario: Sub-wave 3 Kickoff
If support holds, we likely begin Wave 3 of 5, which is typically the strongest and fastest-moving wave.
Look for:
Breakout above the previous minor high to confirm impulse.
Increasing momentum / bullish RSI divergence.
Volume confirmation, if available.
Target: A move past recent highs, potentially up toward $2,475–$2,500, depending on wave length projections.
📉 Bearish Scenario: Breakdown to Fib Retracements
If the trendline breaks decisively:
Expect a retest of the 0.5 to 0.618 Fibonacci retracement from the previous major swing low to the recent high.
This would align with Wave 2 or a complex correction structure.
Key Support Zones:
0.5 Fib ≈ ~$2,285
0.618 Fib ≈ ~$2,250
Watch for price action behavior and wick rejections in that area—those will give you clues for a potential bullish reversal.
🌐 Fundamental + Intermarket Thoughts
You're thinking very well here with capital rotation logic:
S&P 500 (ES) is likely in a Wave 5: If true, a correction in equities could free up capital and drive risk-off inflows into gold.
Two likely macro triggers:
ES reversal after ATH retest → Hedges start shifting to gold.
Immediate correction in ES → Faster rotation into safe havens like gold.
Watch the DXY and 10Y yields—if they weaken, that could also fuel gold's breakout.
My trading plan:
Long Entry - Price holds support and starts bouncing with strength Below trendline (tight SL ~$2,300) ~$2,475–$2,500
Wait/Short Bias - Trendline breaks cleanly, closes below on 4H/Daily — Look for long setup at $2,285–$2,250 zone
