AEDIFICA - Alternative Medium Timeframe Elliot Wave analysisIn this scenario, I’m interpreting the larger Wave 1 as a potential leading contracting diagonal, where each subwave is unfolding as a zigzag (3-3-3-3-3) rather than the typical 5-3-5-3-5 structure.Currently, we appear to be in Wave 4 (Pink) of this diagonal, which seems to be in the final stages of its downward leg before starting Wave 5 the final move of the pattern. The decline in Wave 4 (Pink) may take the form of either a WXY or an ABC correction; continued price development will help validate the count.
I believe this interpretation aligns well with the recent price action, particularly because the market has been moving sideways for quite some time now without delivering a convincing impulsive move to the upside.
Disclaimer: This analysis is for informational and educational purposes only and should not be considered financial or investment advice. All trading involves risk, and you should perform your own due diligence before making any trading decisions. The author is not responsible for any losses that may arise from reliance on this content. Always trade at your own risk. #AED
Elliott Wave

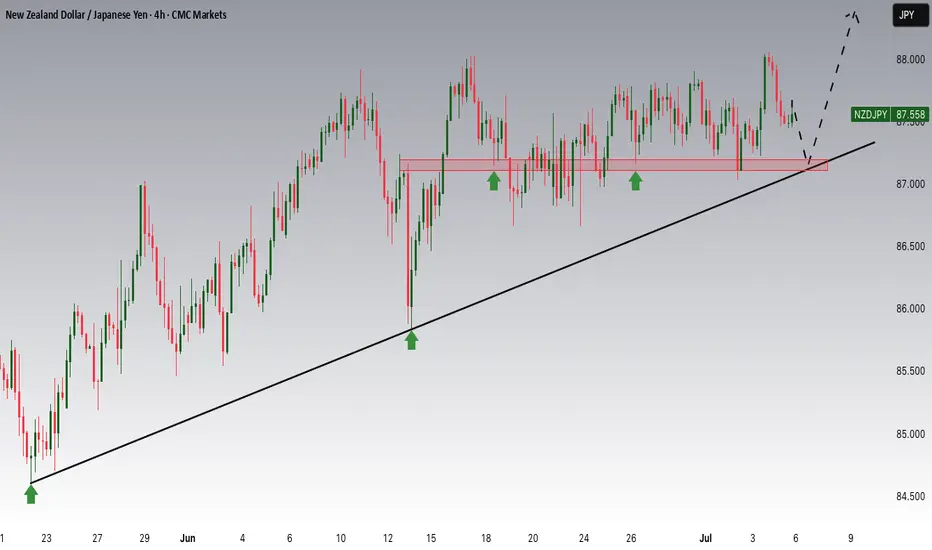
NZDJPY Potential UpsidesHey Traders, in the coming week we are monitoring NZDJPY for a buying opportunity around 87.200 zone, NZDJPY is trading in an uptrend and currently is in a correction phase in which it is approaching the trend at 87.200 support and resistance area.
Trade safe, Joe.
Riding the Wave: Breakout Trading with Elliott Wave AnalysisHello Friends,
Welcome to RK_Chaarts,
Today we're going Analyze the chart of " HASBRO. " to identify a trend change opportunity.(Educational Post).
Let's get started!
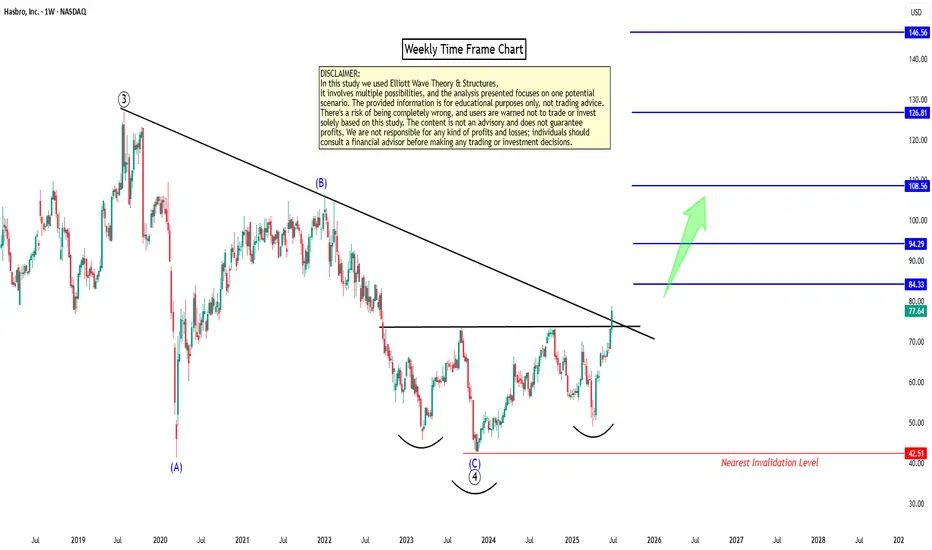
Today, we analyzed the weekly chart of "HASBRO" using Elliott Waves theory and chart patterns. We clearly observed that the July 2019 top, with a high of 126.87, completed a primary degree Wave ((3)) in Black. The recent bottom in November 2023, around 42.69, marked the end of primary degree Wave ((4)) in Black. Since then, the price has formed a higher high and low, indicating a potential reversal.
The recent weekly candle close has broken out of the Resistance trendline and also confirmed an inverted head and shoulders breakout along with good breakout in RSI on weekly-cum-monthly time frames. This suggests that we may be unfolding a primary degree Wave ((5)) in Black, which should consist of five sub-divisions of Intermidiete degree in Blue. Based on the chart, it appears that Intermidiete degree Waves (1) and (2) in Blue are complete, and Wave (3) may have started.
Resistance Trendline Breakout with Inverted Head n Shoulder Breakout
RSI Breakout on Weekly
RSI Breakout on Monthly
Major EMAs Support on Daily, Weekly & Monthly
Both Elliott Wave theory, EMAs support, Trendline Breakout and chart pattern Breakout indicates that the price is likely to move higher from here. However, please note that technical analysis is a game of probabilities, and there's always a chance of being wrong.
To mitigate this risk, we've marked an invalidation level around 42.69. If this level is breached, our analysis would be invalidated.
Projecting the target for Wave ((5)) using the 123.6% of Wave ((4)) measurement, we get a long-term target of around 146.56. This is a possible target, but please keep in mind that this is an educational study and not a trading tip or advice.
Before making any trading decisions, please conduct your own analysis or consult with a technical expert or financial consultant.
I am not Sebi registered analyst.
My studies are for educational purpose only.
Please Consult your financial advisor before trading or investing.
I am not responsible for any kinds of your profits and your losses.
Most investors treat trading as a hobby because they have a full-time job doing something else.
However, If you treat trading like a business, it will pay you like a business.
If you treat like a hobby, hobbies don't pay, they cost you...!
Hope this post is helpful to community
Thanks
RK💕
Disclaimer and Risk Warning.
The analysis and discussion provided on in.tradingview.com is intended for educational purposes only and should not be relied upon for trading decisions. RK_Chaarts is not an investment adviser and the information provided here should not be taken as professional investment advice. Before buying or selling any investments, securities, or precious metals, it is recommended that you conduct your own due diligence. RK_Chaarts does not share in your profits and will not take responsibility for any losses you may incur. So Please Consult your financial advisor before trading or investing.
BONK Bullish Reversal in PlayAfter a clean 5-wave advance from the April low, CRYPTO:BONKUSD corrected 55%, then carved out a higher low last month. Now it’s eyeing a breakout above the May peak as the next leg higher begins.

renderwithme | XAUUSD - GOLD Pre-NFP Technical AnalysisCurrent Market ContextPrice Levels: Gold (XAU/USD) is trading around $3,341.79 as of July 4, 2025, with recent price action showing consolidation between $3,300 and $3,400 after a pullback from highs near $3,500.
Recent Performance: Gold rose slightly by 0.27% to $3,335.17 per troy ounce on July 4, supported by positive momentum from trading above the 50-day EMA. However, it has faced resistance near $3,400 and experienced low liquidity due to the U.S. Independence Day holiday.
Market Sentiment: The overall sentiment remains cautiously bullish, driven by a weakening U.S. dollar amid concerns over U.S. fiscal imbalances (e.g., Trump’s tax-cut bill adding $3.4 trillion to the national debt) and expectations of a dovish Federal Reserve policy. However, short-term volatility is expected due to holiday-thinned liquidity and upcoming economic data
# Technical Outlook
Bullish Scenario: If gold holds above $3,300 and breaks $3,353, it could retest $3,400 and potentially climb toward $3,435–$3,451. A weekly close above $3,400 would negate near-term bearish risks and signal a continuation of the broader uptrend.
Bearish Scenario: A sustained break below $3,300 could trigger a deeper correction toward $3,248 (monthly low) or $3,226–$3,203. A drop below $3,203 would challenge the medium-term uptrend, potentially opening the door to $3,150 or lower.
Range-Bound Expectation: Due to low liquidity and pending NFP data, gold may consolidate between $3,320 and $3,340 early next week, with volatility increasing post-NFP
Disclaimer --
This analysis is based on recent technical data and market sentiment from web sources. It is for informational purposes only and not financial advice. Trading involves high risks, and past performance does not guarantee future results. Always conduct your own research or consult a SEBI-registered advisor before trading.
#Boost and comment will be highly appreciated

NIFTY50.....The path is clear! Or?Hello Traders,
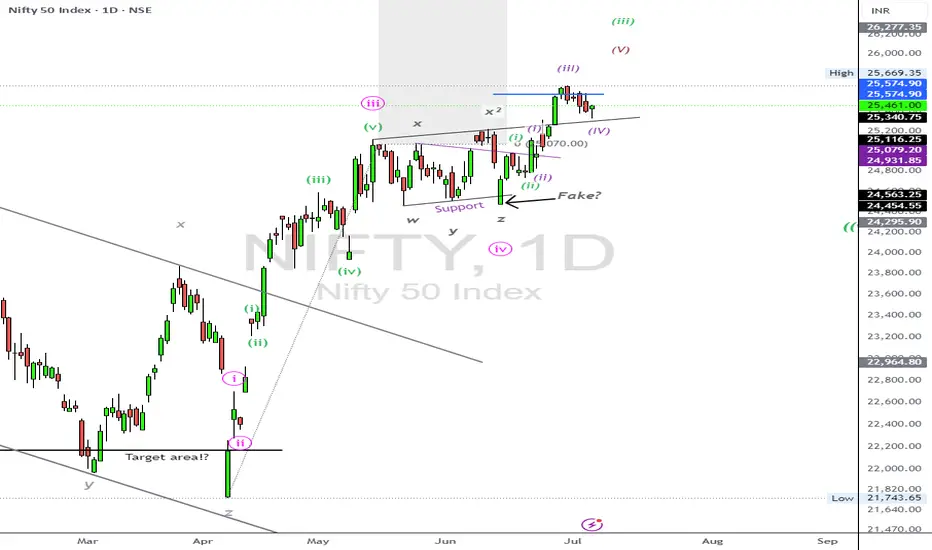
the NIFTY50 is bouncing around the resistance level @ 25669 and 25116! Of course, a wide range, but that's the truth! I have labelled the chart as to see, but the pattern is not that clear as it seems!
Chart analysis; details!
The last multi-week low @ 21743 points was labeled as a wave z of 4! Since, the count is arguing a new impulse is underway with targets well above the latest ATH @ 26227! This, of course, is my main count I'm following.
But! The correction, started on September 27th 2024 and last 'til April 7th 2025, can morph into a wave b of a long term correction. The first correction (September to April) in fact was a wave a in this case, the actually one a wave b, with a leg (Wave) c to come. There is no rule how long (in terms of percent) this correction can extend, only a guideline. This one says, the maximum to be allowed is the 1.618 Fibo-Extension of wave a!
Anyway!
The bulls like to see new high's above the latest @ 26277, which is a long way to go. For this idea, it is important not to touch the area of the wave (i) pink @ 25317! If this were the case, the count is no longer valid. Following my interpretation of a "possible" wave b, that extent, the path would be set to a new ATH in the coming 1–2 weeks, 'cause both path tell exact this scenario!
Anyway! We will see how the market will meet the decision in the coming week.
Act with patient and carefully!
Have a great weekend.....
Ruebennase
Please ask or comment as appropriate.
Trade on this analysis at your own risk.
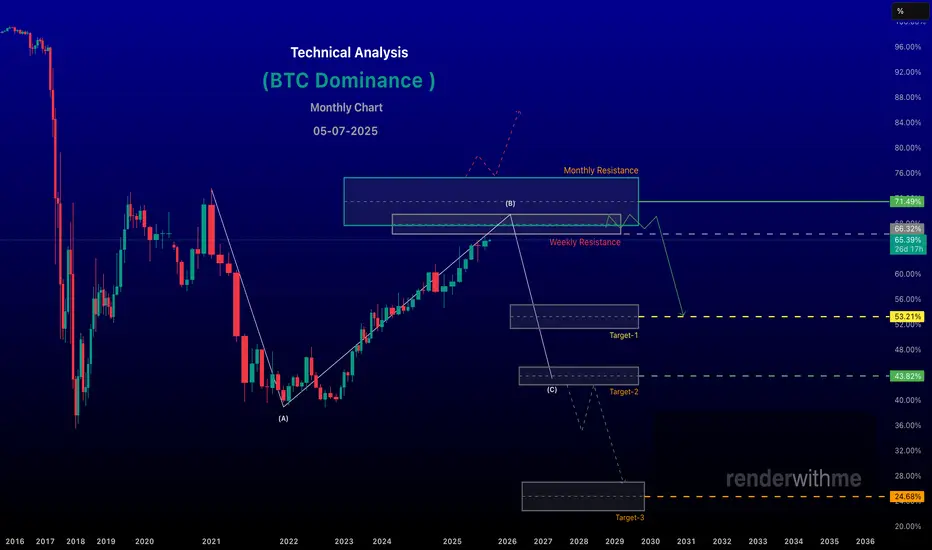
renderwithme | BTC - Dominance about to hit resistanceBitcoin dominance (BTC.D), which measures Bitcoin’s market capitalization as a percentage of the total cryptocurrency market cap, is a key indicator of market sentiment and capital flow between Bitcoin and alt coins . As of July 5, 2025, recent data and technical analysis suggest Bitcoin dominance is at a critical juncture, with potential shifts in market dynamics for the upcoming week. Below is an analysis based on current trends, historical patterns, and technical indicators.Current State of Bitcoin DominanceCurrent Level: Bitcoin dominance is approximately 64.36% to 65.68%, based on recent data .
Recent Trends: Dominance has been testing a multi-year resistance zone between 66.5% and 69.5%
Historical highs in this range (e.g., 64.34% in early 2025) have often preceded pullbacks or altcoin rallies.
Chart indicate bearish signals, such as weekly bearish divergences and potential reversal candles, suggesting a possible decline.
Technical Analysis for Next WeekResistance and Support Levels:Resistance: The 66.8%–67.2% zone is a critical resistance level, aligning with Fibonacci extensions and a long-term descending trend line. A failure to break above this could signal a reversal.
Support: Key support levels are at 61.90%–62.20%, with a potential drop to 58% if bearish momentum accelerates.
Chart for your reference
Disclaimer --
This analysis is based on recent technical data and market sentiment from web sources. It is for informational purposes only and not financial advice. Trading involves high risks, and past performance does not guarantee future results. Always conduct your own research or consult a SEBI-registered advisor before trading.
#Boost and comment will be highly appreciated
My Ideal Elliott Wave Entry ModelThe IMSETT 3/C Entry Model.
Every trader wants to catch the big moves the ones that pay quickly and decisively. In Elliott Wave, those moves often come during Wave 3. It's the strongest part of the trend, and when you're positioned early, the risk-to-reward is unmatched.
But not every opportunity hands you a clean Wave 3 on a silver platter. Sometimes you’re looking at a Wave C instead. That’s where the 3/C Entry Model comes in. It’s designed to get you aligned with high-conviction moves—whether the market is in a trend or a zig zag.
Here’s the edge: both Wave 3 and Wave C often start the same way—a strong, motive push off an AOI (area of interest), followed by a retracement. That shared structure gives us an anchor. Whether we’re labeling it a 3 or a C doesn’t change the fact that the initial impulse gives us clarity, direction, and a place to manage risk.
That’s what the IMSETT Model is built around:
Identify
Motive
Scout
Entry Plan
Track
Trade
Each step is focused, actionable, and repeatable. You're not trying to outguess the market—you’re reacting to structure, preparing for common behavior, and executing with intent.
I do have a video with a walk through.
This just the way I look for clarity in setups. As with everything in trading, nothing will work every time so do your own research this is not financial advice.
Cheers!
Trade Safe, Trade Clarity.

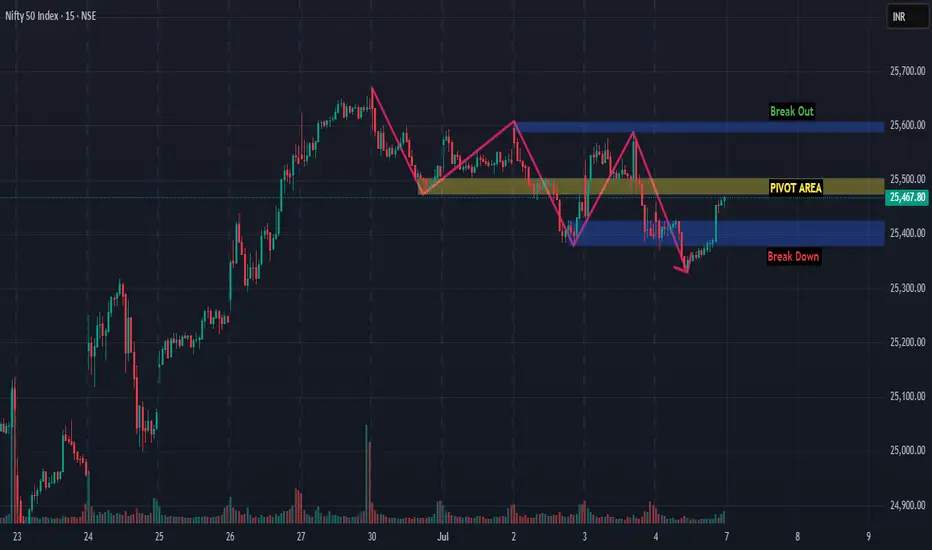
NIFTY ANALYSIS FOR 07-11/07 WEEKThis analysis based on purely zigzag drawing. As per drawing we can see nifty is still in a rangebound position but this phase is important.
from a neutral zone if we can make position with proper analysis and risk management then Break out or Break Down anything happen we can enjoy the ride.
I would like to encourage you just practice the simple drawing. Practice a lot.
On the basis of opening on Monday we can analyze further, till then learn and enjoy weekend.
Thanks for reading. 🙏
ETH Bullish Update
Ethereum is looking bullish, and is respecting clearly defined support and resistance levels.
In my primary count, we have finished black wave 1. The question is to determine if black 2 is already finished, which could lead to strong upside.
There is no way to know without further price action, and a break of green resistance is a very bullish signal.

SP500 rock & roll with Trump.. 4/July/25SPX500 breaking ATH again are we in bullish stage? Or again Donald Trump "Inviting" us come to his WWE stage for his favourite "wrestling" games.. Jumping up and down or up side down.( expanding triangle) ......

Dollar Testing The Channel Support It’s already Friday and the 4th of July, so US holidays are here, which means we could see thinner trading conditions later today. Still, the overall tone remains risk-on since yesterday, supported by better-than-expected Non-Farm Payrolls data and an ISM services reading at 50.8—still in expansion territory. So, there’s some optimism in the market, and this could continue if we get a positive outcome on the tariff front ahead of the July 9th deadline.
On the back of strong economic data, US yields are moving higher, but the Dollar Index is trying to come lower. It’s currently retesting the lower trendline of a corrective channel—likely due to the strong rally in US stock indexes, which are keeping the dollar under pressure.
On the daily chart, the Dollar Index still looks like it could head to new lows, but that move may not come today if holiday conditions slow down the market. We might have to wait until next week for a clearer breakout.
GH

Bajaj AutoThis is Bajaj auto chart
which is at 8410 ...
looking at the chart is see this structure...
in which from upside 5 waves have been completed...
and after that I see 3 waves upside correction being completed...
if price breaks downside levels ...
levels can be seen on charts till where i am expecting...
Just a View!!
Vedang!
Discliamer: Chart is for study purpose only!!

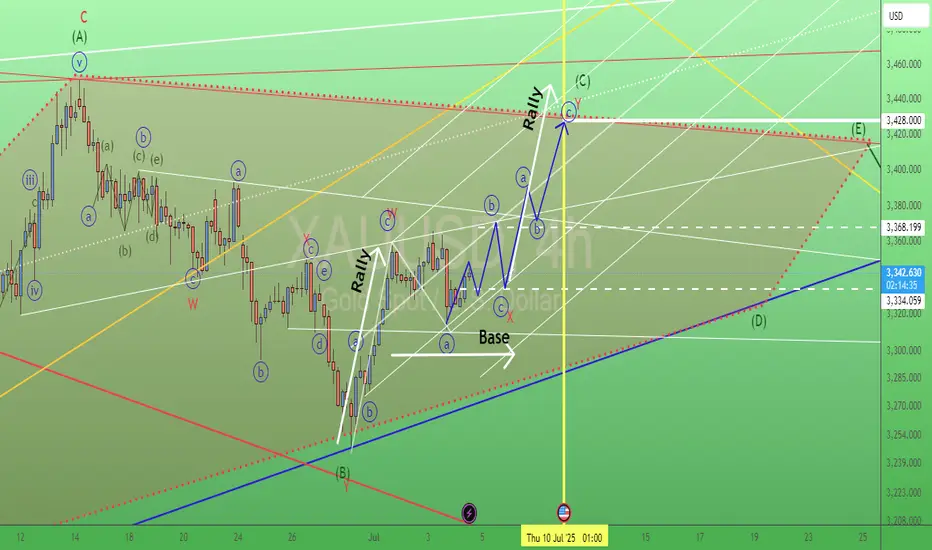
Gold. Swing trade setup. 4/July/25XAUUSD,. based on how the "speed" of chart "touching" those trendline (white). Gold probably having a ( abc (blue circled) running flat waves) "base" before "rallying" toward 3428 +/-...
GOLD → Consolidation after a trend break...FX:XAUUSD , after breaking out of a downtrend, is consolidating, which may continue for some time due to Thursday's news and low liquidity on Friday.
Gold stabilized after a correction, but volatility risks remain. After falling from a weekly high of $3,366, gold prices found demand again in Asia on Friday. Strong US employment data cooled expectations of an imminent Fed rate cut, which supported the dollar and limited gold's gains. Additional pressure is coming from the hawkish shift in Fed expectations, but US budget risks and weak liquidity due to the holidays could increase price volatility in the coming days.
Technically, the focus is on the boundaries of the current consolidation at 3311 and 3357. In addition, within the range there is an important level of 3325, which divides the market into bearish and bullish zones...
Resistance levels: 3350, 3357, 3393
Support levels: 3325, 3311
It is important to understand the situation: due to the holiday in the US, liquidity is lower, making it easier to move the price. The rest of the world, interested in gold, can easily push the price up. The trigger will be the zone 3350 - 3350. There is a chance that the market will try to break through the resistance without a pullback and continue to rise to 3393.
However, the most likely scenario is that after yesterday's volatility, gold will remain within 3325 - 3357 before rising next week
Best regards, R. Linda!

GBPCAD → Retest the area of interest before growthFX:GBPCAD is closing the imbalance area as part of a countertrend correction and consolidating below the 0.5 Fibonacci level. What's next, growth or decline?
The global trend is upward, and the situation is classic: the market needs energy and liquidity to continue growing.
Locally, we see that as part of a countertrend correction, the market is closing the imbalance area, but at the same time forming consolidation below 0.5 Fibonacci, still leaving the zone of interest and order block below 1.84600 untouched.
Technically, there is a fairly high probability of continued growth, provided that the price ends its consolidation with a breakout of the 1.85690 resistance and consolidates above 0.5 Fibonacci.
Resistance levels: 1.85690, 1.8657
Support levels: 1.84986, 1.846, 1.8417
However, as an additional and, in my opinion, the most important scenario, I still consider a complete closure of the fvg and a retest of the 0.7-0.79 zone, within which the order block is located. A false breakdown of the zone of interest and the capture of liquidity could attract additional interest, which would trigger growth.
Best regards, R. Linda!

Ethereum: Eyeing New Highs?Ethereum has surged recently and continues rising in turquoise wave B. The next target is a break above the June high, with potential upside to resistance at $4,107. A direct breakout above this level (27% probability) would suggest green wave alt. ended in April. However, our main scenario expects a reversal below $4,107, with turquoise wave C likely dragging ETH into the Long Target Zone between $935.82 and $494.15 to complete wave .
📈 Over 190 precise analyses, clear entry points, and defined Target Zones - that's what we do.

AAVE Potential 1-2/1-2I´m keeping an eye on a quick pullback on AAVE for a potential 1-2/1-2.
The thesis is that black 2 finished in the 50% pullback and we´re currently finishing blue 1.
Blue 2´s pullback would be a great opportunity for long trades with a very tight stop loss.
The gray zone, with gave us a fake breakout for black 1, may be the temporary resistance for blue 1.

USDCAD offers good R:R opportunityAs the price corrected, its forming a falling wedges pattern. And the best thing is all the new lower low was appear alongside the higher low on MACD, it's such a strong BULLISH DIVERGENCE signal.
I believe in the next 2-3 trading days, 100-150 pips upward movement is very likely to happen.

NuScale Power strong setup formingI believe SMR is set for long rise as strong impulse will continue. This idea, of course, will take some time before we see double and triple price from now ($36). I expect swings up and down within a few weeks before trend up resumes.
Now to EW analysis. Price completed purple wave (3) of green (1) which is a part of black wave (iii). So now I expect it to go down around 38% to 68% of purple (3) and will accumulate.
Then is shall take some time for green (1) and then (2) to complete. Here we might have significant price drop with the count invalidation level at around $11.2. I don't expect this however EW rules allow to have it. Once green wave (2) is completed, the stock will fly.
SMR is an innovative manufacturer of small nuclear modular reactors. It is the only one which got the license from US nuclear authorities in this field. They do much work to install first reactors by 2030 for the first customers.
In general, data centres and progressing AI boom will be in need for energy and together with policies being shifted away from solar/wind as the only green clean energy, reliable energy sources might be long-term winners.
Currently, the company holds strong balance sheet and makes little money however work towards strengthen legal position and get contracts.
I plan to accumulate sizeable amount during upcoming volatility to build long position.

Gold is Nearing an Important Support AreaHey Traders, in today's trading session we are monitoring XAUUSD for a buying opportunity around 3,340 zone, Gold is trading in an uptrend and currently is in a correction phase in which it is approaching the trend at 3,340 support and resistance area.
Trade safe, Joe.

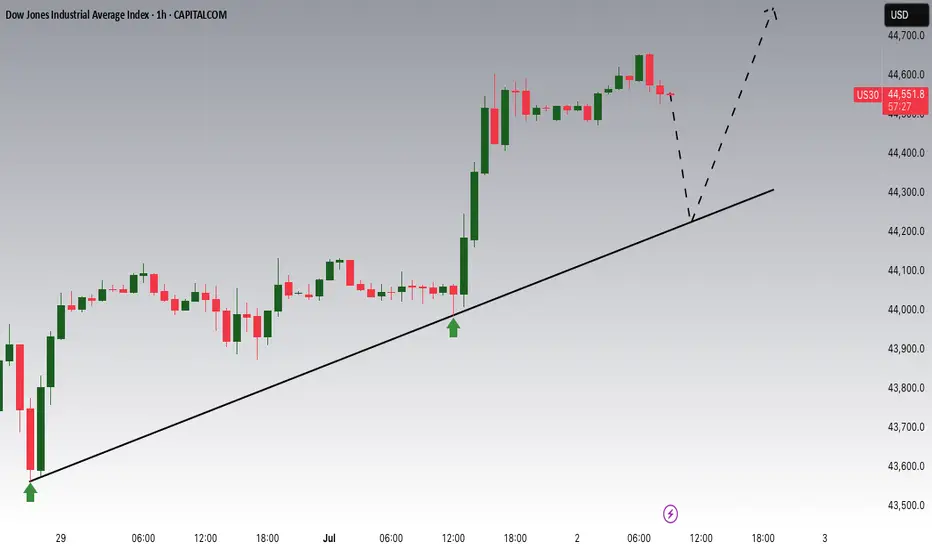
US30 Potential UpsidesHey Traders, in today's trading session we are monitoring US30 for a buying opportunity around 44,230 zone, Dow Jones is trading in an uptrend and currently is in a correction phase in which it is approaching the trend at 44,230 support and resistance area.
Trade safe, Joe.
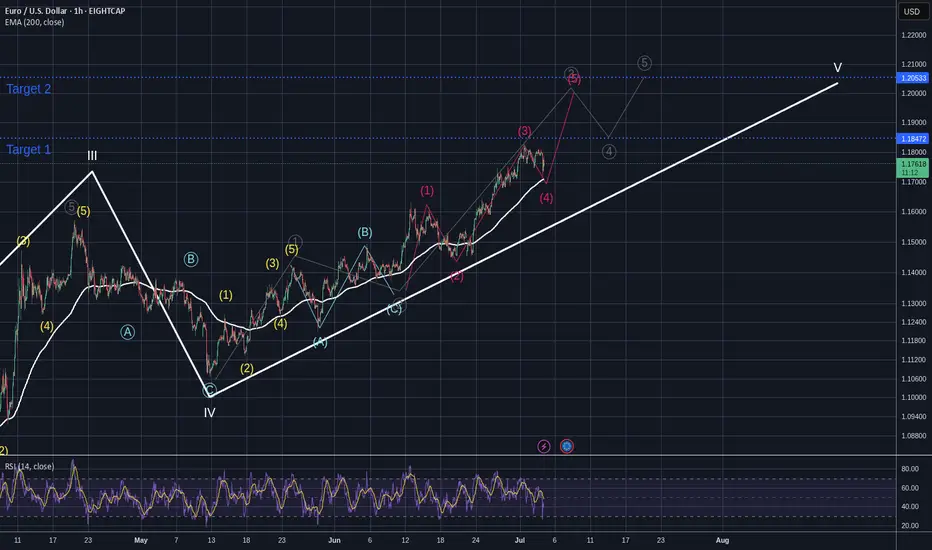
Elliott Wave Analysis: Potential Correction AheadThe overarching 5-wave structure from January 9, 2025, to today is nearing completion. We are currently in Wave 5, with the subordinate Wave 3 in progress. Within this, the sub-subordinate Wave 5 is just starting. Once the overarching Wave 5 concludes, expect a multi-week correction. The correction is projected to target levels between 1.1173 and 1.075.