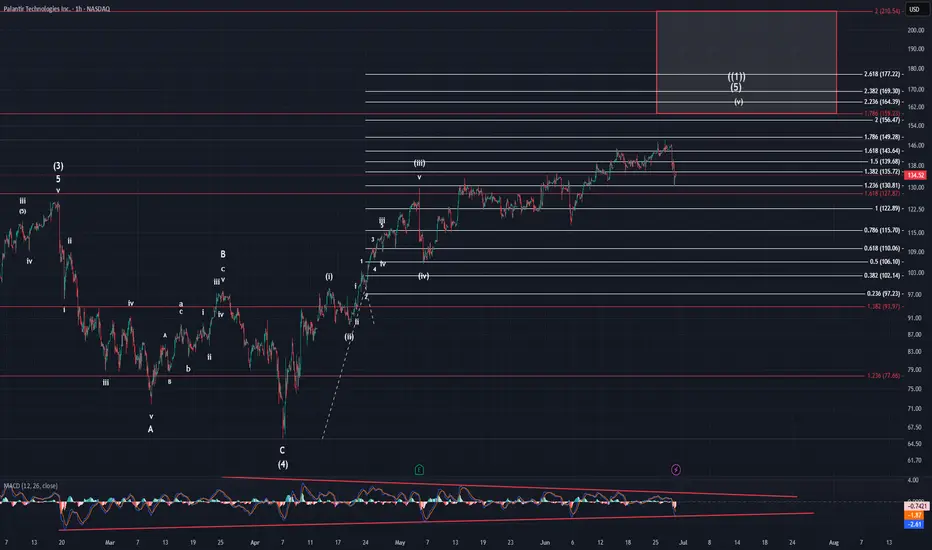
PalantirOn Friday Palantir dropped pretty hard causing MACD to drop all the way to our bottom trend line. It created overlap with the pattern which brings a further rise to the target box into question. On thing I can say about this pattern with certainty, is it is very sloppy. It in no way appears as an impulsive pattern due to the choppy overlapping nature of it. This is what leads me to believe it is an ED.
If it is an ED that leaves us with two possibilities. It is either within its wave 4, which would explain the overlap, or it just finished (v) of (5) of ((1)). We need more price action to determine which count prevails. A drop below $117.22 and that is a huge warning that the upside is done. Below $105.32 and that confirms it for me.
To raise higher again breaching our ATH shows that the ED is not yet done and we're most likely rising to the $160 area. Don't forget, when an ED finished, it moves towards the place of origin in a strong move.
Elliott Wave
#btc #btcusd #elliottwave long buy setup wave 5/3 30Jun25This count is based on my assumptions so anything can happen not a trading or financial advice just for educational purposes only kindly do your own ta thanks trade with care good luck.

GBPAUD Elliot waves Short IdeaPrice made a leading diagonal to the downside which completed potentially wave 1. At it is currently pulling back up for wave 2 which unfolds as a zigzag ABC. If this count is correct we should expect price to find resistance on the golden zone which is in line with the upper trendline of the channel. So we should be looking to short GBPAUD at either upper trendline of the channel or somewhere between 50% and 61.8% fib retracement.

NIFTY50.....Next move to ATH!Hello Traders,
The NIFTY50 has shown breake out of the trendchannel vs triangle structure! It has risen to my cited target area @ 25260 to 25300 points and overcome the targets as well!
Another goal!
Chart analysis:
The ATH @ 26277 points will be the next target, and as I wrote many times, this will be not the end of the structure. I will refrain from mentioning any further goals for the time being.
So, the next move should lead N50 to new ATH`s well above the 26277 range. The potential is given for another long-term wave!
On the downside there is, not so much, potential for a corrective move. While the structure doesn't look complete, I think for at maximum downside potential to 23935 area! It should come, but not yet!
More often than not, the diverging trend lines, possibly created by the triangle structure, will be touched again in the next 1-2 weeks! Well, we will see if so to come, and if...we will judge again!
Caused by a busy weekend, this should be all for today!
Have a great week.....
Ruebennase
Please ask or comment as appropriate.
Trade on this analysis at your own risk.

NZDUSD Elliotwave Update: Is wave 2 complete?We have seen from our previous count price made a leading diagonal and have pulled back down with 3 waves. The question is whether the correction is complete and we have already resumed the bullish momentum. Us long us we are not taking the previous high then we should expect price to pullback down to complete wave 2 at 38.2 fib. If we are correct then we should expect price to drop in the coming days.

XAUUSD Elliot wave update: Is wave 4 still in play?From our previous count we were anticipating a drop for 4th wave completion. We can see now we have been dropping as anticipated. Given the current wave structure I am expecting a double 3 (wxy) to complete this 4th wave. If we are correct then we should expect price to continue down from current position before pulling back up and fall one more time. To take advantage of the move if not caught at the top, one should find areas where price will find resistance to short the market.

AERO, break down or the sound barrier!?If you find this information inspiring/helpful, please consider a boost and follow! Any questions or comments, please leave a comment!
AERO started by showing the kind of impulsive structure that could lead to a much larger advance. The internal retracement off the low was deep enough to flush weak hands but shallow enough to retain the broader bullish context.
The structure looks like a completed wave 2 correction: a double zigzag down into that .51-.61 pocket, finishing with an impulsive pop off the lows. That initial thrust is exactly the type of reaction you want to see if this is the early stages of a wave 3 or C advance.
What’s next? Ideally, price continues to respect the 0.615 level and we see price return back to the channel and then breaks above it with momentum, signaling the start of the next leg up. A clean swift move above .965 would help confirm that bulls are in control and we’re not dealing with an extended corrective mess.
Upside targets are layered: 1.31 is the first zone to watch—an area of prior structural reaction. Beyond that, the move has potential to extend above 1.80+ in a classic wave 5 push, provided we continue to see impulsive follow through.
Bias is bullish while price holds above .61 and continues to print higher lows. Any significant break back into that .51-.61 zone without reclaim would invalidate this setup and shift focus back to low prices.
Trade safe, trade clarity!

Bitcoin Approaches PRZ – Will the Falling Wedge Break ?Bitcoin ( BINANCE:BTCUSDT ) failed to break through the Support zone($106,800-$105,820) after attacking it five times , and started to rise again.
Bitcoin is currently moving near the Resistance zone($109,220-$108,280) , Cumulative Short Liquidation Leverage($108,800-$108,085) , Potential Reversal Zone(PRZ) , and Resistance lines .
From a Classical Technical Analysis perspective , Bitcoin's movements over the past two days seem to have formed a Falling Wedge Pattern .
From an Elliott Wave theory perspective , Bitcoin appears to have completed the main wave 4 within the Falling Wedge Pattern. The structure of the main wave 4 was a Double Three Correction(WXY) .
I expect Bitcoin to attack the Resistance lines after breaking the upper line of the Falling Wedge Pattern . If Bitcoin fails to break the Resistance lines before the global markets close , we can expect Bitcoin to fall again. Because entering Saturday and Sunday , the trading volume is generally low , and I think Bitcoin needs a lot of volume to break the resistances .
Do you agree with me?
CME Gap: $106,645-$106,295
Cumulative Long Liquidation Leverage: $106,055-$105,430
Note: If Bitcoin manages to break the Support zone($106,800-$105,820), we should expect further declines.
Please respect each other's ideas and express them politely if you agree or disagree.
Bitcoin Analyze (BTCUSDT), 1-hour time frame.
Be sure to follow the updated ideas.
Do not forget to put a Stop loss for your positions (For every position you want to open).
Please follow your strategy and updates; this is just my Idea, and I will gladly see your ideas in this post.
Please do not forget the ✅' like '✅ button 🙏😊 & Share it with your friends; thanks, and Trade safe.

HYPE — How to Combine Fibonacci, VWAP and Market StructureAfter an explosive +392% rally in just 70 days — from $9.298 to a peak of $45.8 — HYPE has entered a consolidation range as expected. Structurally, this appears to be a 5-wave impulse now transitioning into a corrective ABC pattern. Based on current structure, we may now be forming wave B.
What’s Unfolding Now?
A potential Head & Shoulders pattern is developing, with price currently working on the right shoulder. The $40 mark stands out as a key resistance — both technically and psychologically:
0.618 Fibonacci retracement of the down move sits at $40.108
Structural resistance from prior highs
Ideal area for a short rejection
🎯 Short Setup:
Entry: Laddered short between 0.618 ($40.108) and 0.786 ($42.611)
Stop-Loss: Above $44 (after rejection adjust to entry)
Target: $28–$27 zone
R:R potential: 1:3 up to 1:9 depending on entry quality
📍 Why $28–$27 Is Key Support:
0.5 Fibonacci retracement of entire +392% rally sits at $27.549
Anchored VWAP from the rally origin ($9.298) aligns around this zone
Weekly & Monthly S/R convergence
VAH (Value Area High)
0.618 Fibonacci Speed Fan also aligns as dynamic support
Fair Value Gap (FVG) lies in this region
Weekly 21 EMA at $28.05/Weekly 21 SMA at $24.10 — both key moving averages providing layered support and trend structure
📐 Bonus Confluence Insight:
If this is indeed wave B, then projecting a 0.786/1.0 Trend-Based Fib Extension from wave A aligns well with the 0.5 fib retracement at $27.5.
📚 Educational Insight:
Stacking confluences such as Fibonacci retracements, anchored VWAPs, volume zones, EMA/SMA levels, and harmonic structures helps identify high-probability zones where smart money is likely to act. These levels become even more powerful when they align across multiple tools and timeframes. Always confirm with price action.
_________________________________
💬 If you found this helpful, drop a like and comment!
Want breakdowns of other charts? Leave your requests below.

USDJPY Potential UpsidesHey Traders, in tomorrow's trading we are monitoring USDJPY for a buying opportunity around 144.400 zone, USDJPY is trading in an uptrend and currently is in a correction phase in which it is approaching the trend at 144.400 support and resistance area.
Trade safe, Joe.

BITCOIN → Pause for consolidation before growth. 115K?BINANCE:BTCUSDT focus on the structure on D1. The market is forming local resistance and consolidation after growth. The fundamental background is positive. BTC is following the SP500
The market is recovering in line with the stock market (SP500, NQ) after the de-escalation of the situation in the Middle East. The fall in the DXY is also providing support.
Technically, the focus is on the consolidation phase after the distribution triggered by a false breakout of 100K. The price stopped before the resistance at 108100 and rolled back to 106500, confirming the boundaries of the local trading range, the essence of which is a pause for a breather before a possible continuation of growth. The structure on D1 is compression towards resistance. The trigger is 108100, and a breakout of this level could trigger distribution towards 110500 and ATH.
Despite the fact that the market is under a cascade of resistance (resistance: 108100, 110400, 11900 (ATH)), an important nuance is that after strong growth, the price moved into accumulation in the 100K-110K range on D1-W1, and there are no reasons for a decline yet.
Resistance levels: 108100, 108900, 110400
Support levels: 106500, 104650
If the market structure within 106500 - 108100 remains unchanged and BTC continues to storm the consolidation resistance in the “compression to level” format and stick to the level, the chances of a breakout will increase. I do not rule out the possibility of a pullback to 106500, 105650 before a possible rise to ATH.
Best regards, R. Linda!

Penguins Can’t Fly, But This Chart Might If you find this information inspiring/helpful, please consider a boost and follow! Any questions or comments, please leave a comment!
The move off the low looks like a clean, completed impulse wave sharp, decisive, and showing solid structure. After that, we had a double ZZ retracement. While it was a bit deeper than the textbook ideal, it still fits perfectly within the normal range you’d expect for a healthy correction. Now, we’re seeing another smaller-degree impulse forming from the .007 pivot, suggesting that the market is gaining momentum again.
Here’s what we’re watching closely:
The secondary impulse off .007 continues to build structure.
We want to see a pullback after impulse completion that ideally holds above the .011 region, showing the market respects previous support and AOIs.
The structure of this potential pullback needs to be corrective rather than impulsive to confirm bullish continuation.
A clean move above prior swing highs would confirm that the larger wave 3 or C is underway.
Overall, this chart is ticking the boxes for a potential larger upside push if the market respects key levels and continues to print impulsive structure higher.
Trade Safe!
Trade Clarity!

GBPUSD Ending Diagonal.On the Daily, the pairs grind to the upside is still going on, but we have signs of exhaustion:
- Bearish RSI divergence
- Price is inside a channel with a shallow slope (ending diagonal)
This leads me to consider we are close to finishing blue 5 of black 5, and can expect a correction soon.
Ideally, I'd wait for a lower low / lower high and break of the bottom of the channel.
Initial targets are the 2 purple levels shown in the chart.

S&P500 Potential UpsidesHey Traders, in today's trading session we are monitoring US500 for a buying opportunity around 6,075 zone, S&P500 is trading in an uptrend and currently is in a correction phase in which it is approaching the trend at 6,075 support and resistance area.
Trade safe, Joe.

Up for BitcoinHi traders,
Last week Bitcoin made a small correction up and after that another drop just as I've said.
After it retested the Weekly FVG and broke the previous swing low it went impulsive up again.
This could be the next impulse wave to new ATH's. So wait for the correction down to finish and trade longs.
Let's see what the market does and react.
Trade idea: Wait for the correction down to finish to trade longs.
If you want to learn more about trading FVG's with wave analysis, please make sure to follow me.
This shared post is only my point of view on what could be the next move in this pair based on my analysis.
Don't be emotional, just trade your plan!
Eduwave

Down for goldHi traders,
Last week gold went lower then expected (wavecount updated).
The last wave down could be wave 2 or it's part of a big Triangle/ Flat.
Next week we could see this pair to go lower to sweep the liquidity below the lows and fill the 4H bullish FVG.
After that it could go up again.
Let's see what price does and react.
Trade idea: Wait for a small correction up on a lower timeframe to finish and trade (short term) shorts.
If you want to learn more about trading FVG's & liquidity sweeps with wave analysis, please make sure to follow me.
This shared post is only my point of view on what could be the next move in this pair based on my technical analysis.
Don't be emotional, just trade your plan!
Eduwave

Watch out for SPX500USDHi traders,
Last week SPX500USD made a gap lower but after the fill it went further up and broke the previous swing high (ATH). This could be the last wave 5 (orange) of wave 3 (red).
So next week we could see this pair go lower for a (big) correction down.
Let's see what the market does and react if it reaches the Daily bullish FVG's.
Trade idea: Wait for price come into the Daily bullish FVG's to trade longs again. At the moment price is too high to trade.
If you want to learn more about trading FVG's & liquidity sweeps with Wave analysis, then please make sure to follow me.
This shared post is only my point of view on what could be the next move in this pair based on my technical analysis.
Don't be emotional, just trade your plan!
Eduwave

More upside for EUHi traders,
Last week EU started with a gap down. After the fill it swept the lows and after that it made the next impulsive wave up.
So next week after the finish of the correction down we could see more upside.
Let's see what the market does and react.
Trade idea: Wait for the finish of the correction down and a change in orderflow to bullish on a lower time frame. After a small correction down you could trade longs again.
If you want to learn more about trading with FVG's, liquidity sweeps and Wave analysis, then make sure to follow me.
This shared post is only my point of view on what could be the next move in this pair based on my technical analysis.
Don't be emotional, just trade your plan!
Eduwave

GBPJPY Potential UpsidesHey Traders, in the coming week we are monitoring GBPJPY for a buying opportunity around 198.100 zone, GBPJPY is trading in an uptrend and currently is in a correction phase in which it is approaching the trend at 198.100 support and resistance area.
Trade safe, Joe.

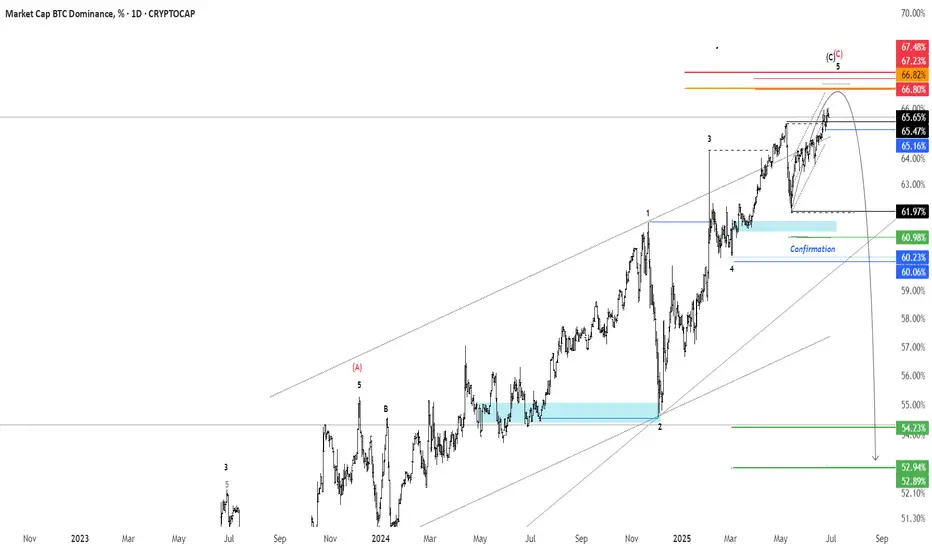
BTC.D - 1D Timeframereversal zone 66.8 : 67.2%
Confirmation : 60.23%
Targets : 52.94% / 31.03
invalid : 67.48%
IRENs Incredible Surge Continue next wWeek?NASDAQ:IREN has been on a rampage since the April surging 175% and nearing all time high! A great couple of trades for us so far!
Price is likely to hit all time high next week with such a strong trend, where resistance and a pullback is a high probability.
The weekly pivot is $9.77, the most likely area for price to find support just above the 0.382 Fibonacci retracement (which will be dragged up to the weekly pivot once a new high is made).
Price discovery terminal target are the R3 & R5 weekly pivot points at $28 and $40.
Safe trading

$HUT Macro Chart Preparing for Breakout?NASDAQ:HUT looks poised for a strong breakout with a wave 3 long term target of $58 and a short term resistances of $21 and $33
HUT is moving strong almost up 100% from the recent swing low, overcoming its weekly 200EMA with ease. A test of the 200EMA as support is likely before continuation.
Price is consolidating under major resistance High Volume Node (HVN) and the weekly pivot point. Consolidation under resistance often leads to a breakout.
A series of 1-2s appears to be taking place on the Elliot Wave count finding support at the 'BTC-Miners golden pocket' of 78.6 Fibonacci retracement.
Analysis is invalidated below $10.10
Safe trading

GBPUSD Potential DownsidesHey Traders, in the coming week we are monitoring GBPUSD for a selling opportunity around 1.37400 zone, GBPUSD is trading in a downtrend and currently is in a correction phase in which it is approaching the trend at 1.37400 support and resistance area.
Trade safe, Joe.
