Bitcoin - Time to sell, huge drop will follow (must see!)Bitcoin is currently approaching a very strong resistance of this major bullish flag! We definitely want to sell resistances and buy supports, not the other way around, until we have confirmations. Bitcoin's price action is statistically very boring during summer seasons! Usually high volatility kicks in in September. I think we cannot really expect a new all-time high in the next few weeks. Instead, we should see a big range. In the short term, Bitcoin should go back at least to around 102,600 USDT to fill up the FVG. Also, markets always move in waves, and this move from 98,200 seems to be exhausted already.
On the chart we can clearly see a blue trendline, and price went below this trendline at the end of May. This indicates that the uptrend is over and a consolidation/distribution phase is in progress. This phase is usually represented as a bull flag, triangle, rectangle, or wedge. When we look at the current price action, it looks like a bullish flag consolidation pattern. Bitcoin is currently in the sell around 109k
There are 2 types of traders. The first one they love to trade ranges, and the second they love to trade breakouts and higher volatility environments. Currently I think Bitcoin is creating a range, so do not expect any crazy movements until this bullish flag is valid.
Bullish flags are usually bullish patterns, but often they break down and act like bearish patterns. So what would happen if this bullish flag breaks down? That would send the price of Bitcoin to the 0.618 FIB, which is at 88,882 USDT. What if this bullish flag breaks out? That would send the price of Bitcoin to 116,000 to 125,000, but to establish this price, we first need to see the low of the bull flag, which is not confirmed yet. I will definitely inform you in one of my next analyses, so write a comment with your altcoin + hit the like button, and I will make an analysis for you in response.
Trading tip at the end: "A trader needs to accept the losses to maintain their emotional stability. Losses are a crucial internal part of trading that helps traders to learn how to grow from their losses. Traders learn from losses and implement required changes in their strategies for better results in future trades." Trading is not hard if you have a good coach! This is not a trade setup, as there is no stop-loss or profit target. I share my trades privately. Thank you, and I wish you successful trades!
Elliott Wave

BTC - A New Oregon Trail or Fool's Gold?The ranch hand (chart) reckons Bitcoin hit a big wave‑3 peak, then swung into a corrective wave‑4 saddle.
Now it's circling the watering hole, teetering around a key resistance near $110k—the cowboy‑critical line in the sand.
If that line holds strong, expect another surge—an “inverse wave‑4, strong 5” push higher toward $115–120k.
But if it buckles, a darker scenario’s afoot: a red‑inked, five‑wave drop galloping down toward $85k.
Bottom line: keep your hat on—$110k is the frontier. Break above that, and the herd’s heading north; if not, saddle up for a ride downhill.
BYBIT:BTCUSDT.P
BITSTAMP:BTCUSD

Final $LINK in the corrective chain?If you find this information inspiring/helpful, please consider a boost and follow! Any questions or comments, please leave a comment!
LINK could be finishing a double zigzag correction. Recent reaction at the channel’s most likely target area shows promise. Watching for an internal retrace that holds above key support.
Key Levels:
11.81: Ideal retrace floor
11.00: Break kills impulse idea
13.25: First upside flip needed
15.00: Big level to break for bulls
Bulls have been tricked before with possible impulse starts. This one has the right look and confluence, but caution is warranted. Ideally, we get consolidation and push above 13.25 to build confidence in further upside.
As long as price holds above 11.81 and builds higher lows, potential remains for an impulsive move up. Break below 11 and bias flips back to bearish continuation.
Trade Safe!
Trade Clarity!

EURJPY 1H Chart
I expect at least one more liquidity-grabbing leg up for blue wave 5, before a correction begins.
First target for the correction is 168 (blue area), which is the beginning of this latest upside wave.
Note that you should trade wave expectations... wait for a reversal pattern and clear bearish price action before taking any shorts.

BIST30 (XU030) - 1 DThe corrective move in the BIST30 index, which began in July 2024, has completed the first two legs of a three-wave structure and is currently unfolding the final downward leg. While the overall pattern appears to be a classic flat (regular) correction, the possibility of it evolving into a WXY complex correction—albeit less likely—still remains valid. I anticipate that this correction will conclude with one final leg to the downside. Both time-based and price-based target levels have been marked. In my assessment, the likelihood of the correction ending within the initially identified support zone is higher than the probability of a deeper retracement.

ADA ELLIOT WAVE COUNTADA ELLIOT WAVE COUNT. Correct me if I’m wrong. I think a $1.50-$2 ADA this cycle is possible. Not unreasonable.

XRP WAVE COUNTXrp Elliot wave count. Completed ABCDE corrections, now onward and upward. No we’re not gonna hit $30 this cycle. but $6-10 is possible. $4-6 likely. NFA DYOR

Preparing for price correctionThe previous scenario is still valid, except that the price correction is taking time and is turning into a diametric.
We are currently in wave-(f) of the diametric
Good luck
NEoWave Chart

BAC Targeting ATHBank of America is targeting new all-time highs (currently at 50.11, purple line).
The gray zone at 48.00 could offer some resistance for a short term pullback. This could be an opportunity for long trades (right now, RSI is overextended at 76).

Gold is near the 0.618 levelGold is near that 0.618 level, going to watch it closely from here. We might not get an entry until Sunday at 6pm NY time when market open.
Key Level to watch 3249, 3194
We need SPY / ES to come down for gold to gain momentum.

The S&P did it!The S&P 500 has reached a new ATH. The monthly RSI looks strong as well. This could trigger an explosion into the target area.

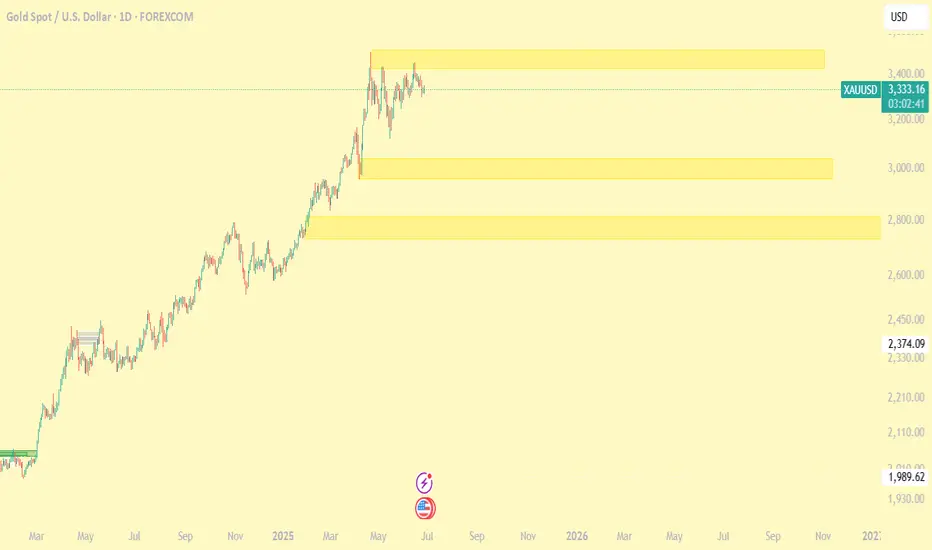
GOLD → Local bearish trend. Retest of support.FX:XAUUSD is technically looking a little weak. Support is being retested amid de-escalation of geopolitical conflicts in the Middle East. Interest in the metal is waning.
On Friday, gold remains under pressure ahead of data on the core PCE index, a key inflation indicator for the Fed. If inflation turns out to be higher than expected, this could strengthen expectations of a rate cut as early as July, supporting gold. The probability of a July cut is currently estimated at 21%, and 75% for September. Amid dollar volatility caused by rumors of a possible Fed chair replacement and trade negotiations with the EU and China, traders remain cautious, awaiting clarity on inflation and monetary policy
Technically, before falling, gold may form a correction to 3320 (liquidity capture).
Resistance levels: 3320, 3336, 3347
Support levels: 3293, 3271
If the fundamental background remains unchanged and gold continues to decline towards support at 3293 and break through this level, the breakout could lead to a fall to 3271. However, I do not rule out the possibility that after a sharp decline, a correction to 3320 could form before the fall.
Best regards, R. Linda!

USDCHF → Hunting for liquidity before the fallFX:USDCHF , against the backdrop of the falling dollar and the exit from consolidation, is forming another ‘bos’, which only confirms the market sentiment.
The fall of the dollar only increases pressure on the currency pair. The price has broken out of consolidation and is trading below the key level. USDCHF has broken through a fairly strong support level, which only confirms the bearish market structure. A correction is forming ahead of a possible decline (liquidity capture).
Resistance levels: 0.803, 0.8042
Support levels: 0.798, 0.79
Fundamentally and technically, the currency pair looks weak. The decline may continue after the liquidity capture phase and a retest of resistance. A false breakout of resistance will be a strong signal.
Best regards, R. Linda!

Gold's Decline Not Over (Yet)#Gold is in a declining pattern that appears incomplete. Here are 2 models we are following closely.
1. A decline in wave (iii) of ((c)) - targeting $3,120
2. A decline in wave iii of (ii) - targeting $3,220-3,240
Both models imply the current decline is not over.
FLAT PATTERN
The flat pattern subdivides as a 3-3-5 ((a))-((b))-((c)) pattern. The decline appears to be in the latter stages of this pattern, wave ((c)).
This wave needs to unfold as a motive 5-wave pattern...it appears we are in the 3rd wave decline so a couple of more trends lower. The flat targets $3,120.
LEADING DIAGONAL
The leading diagonal is a motive pattern labeled i-ii-iii-iv-v. The leading diagonal pattern is already complete and now a partial retracement lower of the diagonal is underway. This partial retracement likely carries to $3,220-$3,240.
Under both scenarios, once they are complete, a strong rally is likely to follow. However, the downtrends need more price and time to develop so the rallies are on hold for the moment.

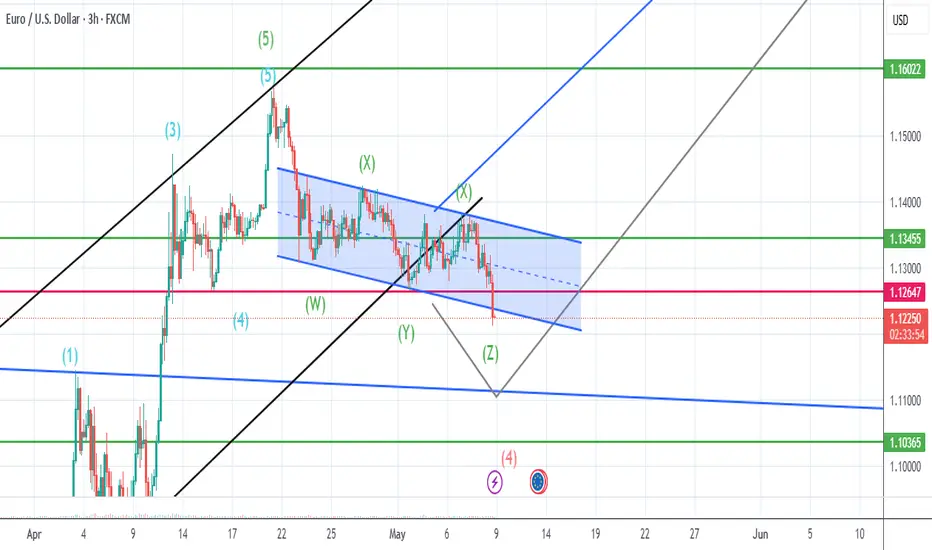
should be going up after correction ends.cant be certain when it comes down to correction waves, it might be here 1.1211 it might go little bit more down around 1.1152 or 1.10 but when it ends it will go for higher than 1.17 also correction wave lenght will give us a better idea where the tp should be so i will keep my first buy position and will add when i am certain when next impulse wave started.
XRPBTC May Face Another Rally This YearXRPBTC pair can be trading in a larger weekly (A)(B)(C) flat correction, where wave (C) can be now in progress as a five-wave bullish impulse back to 2021 highs.
XRPBTC is currently slowing down due to BTC dominance, but notice that it's now testing February 2025 lows, so wave 4 correction can be coming to an end, which can extend the rally for wave 5 of (C) towards 0.000040 area and it can bring the ALTseason.

S&P500 and Nasdaq Short: Wave 5 <= Wave 3Based on the Elliott Wave rule that wave 3 is not the shortest wave, I gave a projection on where the peak of both S&P500 and Nasdaq could be. Based on these peaks, the stop is set above and the take profit target is where wave 4 was.

Gold Breakdown Confirmed — Bearish Pennant Targets UnfoldingGold ( OANDA:XAUUSD ) started to decline as I expected in my previous idea after the lower lines of the Ending Diagonal broke .
Gold is moving near the Resistance zone ($3,349-$3,325) . And Gold seems to be crossing the 50_SMA(Daily) .
From a Classical Technical Analysis perspective , the Bearish Pennant Pattern seems to indicate a continuation of the downtrend in Gold .
From an Elliott wave theory perspective , it seems that Gold has completed the Zigzag Correction(ABC) , and we can expect the next 5 downwaves .
I expect Gold to continue to decline at least to the Support zone($3,281-$3,243) and Monthly Pivot Point .
Note: Stop Loss (SL) = $3,360
Gold Analyze (XAUUSD), 1-hour time frame.
Be sure to follow the updated ideas.
Do not forget to put a Stop loss for your positions (For every position you want to open).
Please follow your strategy; this is just my idea, and I will gladly see your ideas in this post.
Please do not forget the ✅ ' like ' ✅ button 🙏😊 & Share it with your friends; thanks, and Trade safe.

#Nifty directions and levels for June 27Good morning, Friends! 🌞
Here are the market directions and levels for June 27:
Market Overview
Both the global markets and our local markets are showing bullish sentiment. Gift Nifty is also indicating a positive start of around 30 points today.
So, what can we expect today?
In the previous session, Nifty performed well and Bank Nifty also supported the move.
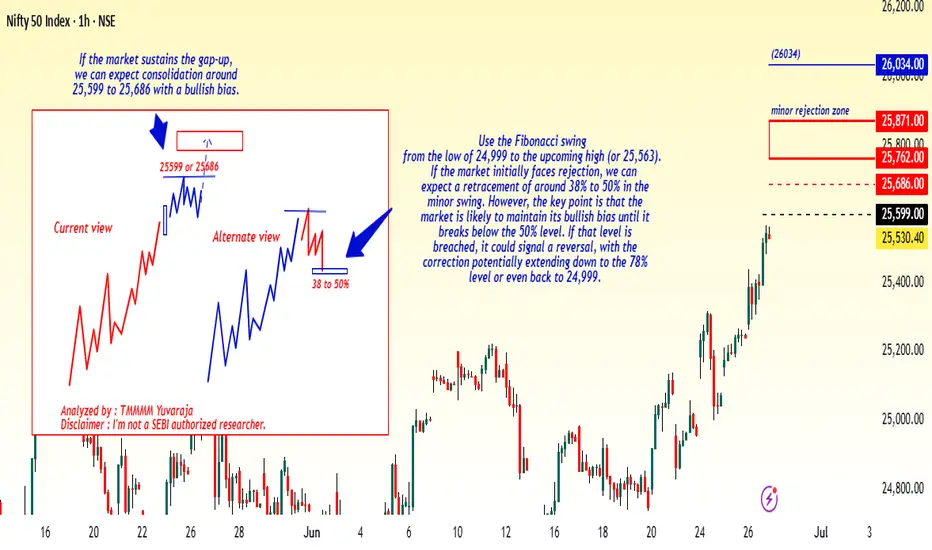
Structurally, the trend still appears bullish. So, if the market opens with a strong candle formation,
we can expect a further continuation of the rally.
However, my personal opinion is based on sub-wave calculations, the upcoming wave could be the 4th wave—which is typically a consolidation phase.
So, after the gap-up, the market may consolidate around the immediate resistance zone.
On the other hand, if the gap-up does not sustain or if the market faces rejection near the immediate resistance,
it could lead to a correction of around 38% to 50% in the minor swing.
The key point here is: until the market breaks below the 50% level, the overall bias may remain bullish. But if the 50% mark is broken,
it could lead to a reversal, with deeper correction possible.
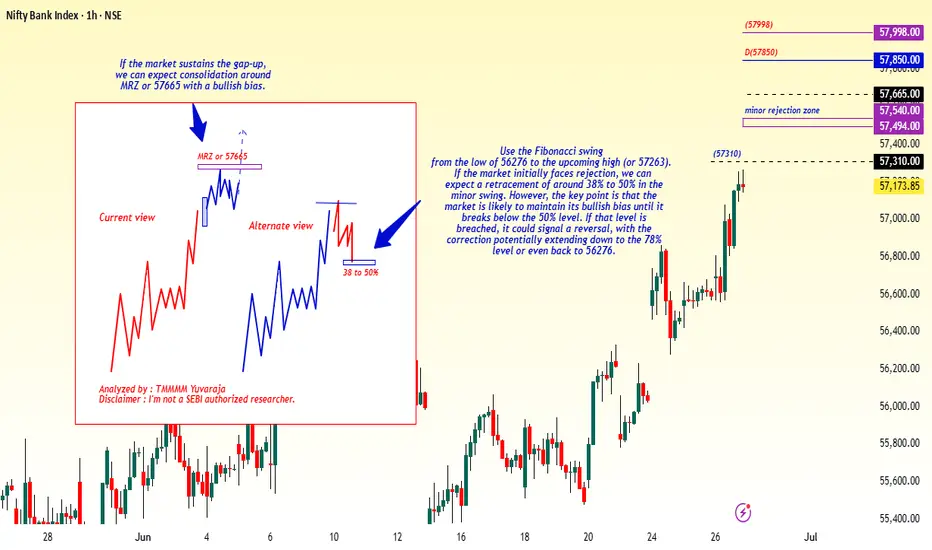
#Banknifty directions and levels for June 27Structurally, the trend still appears bullish. So, if the market opens with a strong candle formation,
we can expect a further continuation of the rally.
However, my personal opinion is based on sub-wave calculations, the upcoming wave could be the 4th wave—which is typically a consolidation phase.
So, after the gap-up, the market may consolidate around the immediate resistance zone.
On the other hand, if the gap-up does not sustain or if the market faces rejection near the immediate resistance,
it could lead to a correction of around 38% to 50% in the minor swing.
The key point here is: until the market breaks below the 50% level, the overall bias may remain bullish. But if the 50% mark is broken,
it could lead to a reversal, with deeper correction possible
Bitcoin Top is In! Bear considerationsPrice has been carving out an unclear correction off the high. The recent structure has many squinting. Is it done or the calm before another wave of selling?
I am weighing two bearish scenarios here. One is more aggressive than the other. But both start with the same idea. No new high before another low.
Let’s start at the top.
The initial move down off the recent high could count as an impulse. Whether that is a wave 1 or a wave A is still up for judgment. Either way, that first leg sets a bearish tone at the larger degree.
Here’s where it gets interesting. The correction since then shows traits of a flat. A running one at the moment.
This opens the door to two active bearish projections:
A wave C collapse, implying a completed A B C correction and a downside resolution.
A wave 3 drop, for a possible top if this is an impulsive sequence.
That is the fork in the road. And it all hinges on the next move.
Right now, the smallest degree impulse off the low is doing some heavy lifting.
If that pivot holds and we only get an internal retracement like a micro wave 2, the door is still open for upside continuation.
But if that impulse gets invalidated, I would expect bears to press. First for a break below 100k, then toward the 95k area.
Here is how to think about it:
Hold the small impulse → Potential upside
Break the impulse base → Wave C or 3 likely underway
Context still leans bearish. Lower highs are still in play. But we are hunting a specific structure to confirm it.

Bitcoin Reaches PRZ with Bearish Signals — Is a Drop Imminent?Bitcoin ( BINANCE:BTCUSDT ) has reached the Potential Reversal Zone(PRZ) as I expected in yesterday's post .
Bitcoin is trading in the Heavy Resistance zone($110,720-$105,820) , Potential Reversal Zone(PRZ) , and near the Resistance lines .
In terms of Elliott Wave theory , it seems that Bitcoin has managed to complete the main wave 5 with the help of the Ending Diagonal . The structure of wave 5 can be different.
Also, we can see the Regular Divergence(RD-) between Consecutive Peaks.
I expect Bitcoin to drop to at least $105,400 .
Cumulative Short Liquidation Leverage: $107,334-$108,250
Cumulative Long Liquidation Leverage: $105,037-$103,392
Note: We could be in for a bit of excitement in the financial markets during Federal Reserve Chairman Powell's speech.
Note: Stop Loss(SL)= $109,020 = We can expect more pumps.
Please respect each other's ideas and express them politely if you agree or disagree.
Bitcoin Analyze (BTCUSDT), 1-hour time frame.
Be sure to follow the updated ideas.
Do not forget to put a Stop loss for your positions (For every position you want to open).
Please follow your strategy and updates; this is just my Idea, and I will gladly see your ideas in this post.
Please do not forget the ✅' like '✅ button 🙏😊 & Share it with your friends; thanks, and Trade safe.