XRP Potential Wave 5Ripple could already be in the subwaves of gray 5. The gray descending trendline was broken and is serving as support for the correction.
In smaller timeframes, price is still making lower lows and lower highs. I´d wait for a clearer reversal in the 4H before taking long trades.
Invalidation is at 1.6134 (potential gray 4 low).
Elliott Wave

ELLIOTT WAVE XAUUUSD H4 update
EW Trade Set Up H4
minuette wave (iv) running?
possible leading diagonl subminuette i upside move from 3120a of 150525 to 3439a of 130625 till now, subminuette wave ii running
alternative: minuette wave (iv) still running
key levels (area)
3390
3355 POC
3310

Diametric Pattern - Riding the current G-wave- Riding the G-wave - hoping it to tend to be nearly equal to A-wave
- 90* Gann acting as resistance
- 270* Gann as supports

Impact on the Dollar and Forex — Artavion AnalyticsThe development of central bank digital currencies (CBDCs) — especially the digital yuan (e-CNY) — is becoming a key factor in transforming global currency flows. While the US dollar still dominates, the architecture of global liquidity is beginning to shift.
At Artavion, we see the e-CNY not just as a technological experiment but as a tool of China’s currency policy. Its goal is to strengthen the yuan’s role in international settlements and reduce dependence on the dollar, particularly in developing regions.
Why the Digital Yuan Matters
The e-CNY is already being used in China for retail payments and is being tested in cross-border transactions (e.g., in the mBridge project with the UAE and Thailand). This enables the creation of alternative payment systems not tied to SWIFT.
If the digital yuan gains broader acceptance, especially for commodity and energy settlements, its role in forex will grow, potentially weakening the dollar’s monopoly in certain regions.
CBDCs and Forex Structure
CBDCs won’t displace the dollar in the near term, but they are already influencing the structure of currency trading:
New currency pairs are emerging, especially in Asia;
Transactions are becoming faster and cheaper, particularly in the B2B segment;
Market participants are adjusting strategies to real-time settlements and the potential programmability of currencies.
Risks and Limitations
Privacy: CBDCs are under full state control;
Fragmentation: There is no unified technical standard across different countries’ CBDCs;
Geopolitics: The rise of the e-CNY could intensify currency competition with the dollar.
Artavion’s Conclusion
The digital yuan will not replace the dollar, but it is creating an alternative — especially in regions seeking autonomy from Western financial infrastructure. For traders and investors, this means reassessing currency risks and exploring new opportunities in decentralized settlement channels.

ETHEREUM → Rally and liquidity capture. Up or down?BINANCE:ETHUSDT.P is strengthening following Bitcoin. This is a reaction to developments in the Middle East, namely Trump's comments on peace. But there are doubts...
The crypto market is reacting to the situation in the Middle East, namely Trump's statements about peace. But apart from him, no one else is talking about peace. No agreements have been reached, so the level of risk is quite high.
Another nuance hinting at the general mood in the market: 66% of the largest traders on Hyperliquid are currently shorting crypto — Cointelegraph
ETH, technically, has stopped in the trend resistance zone as part of a local rally in the Pacific session.
If there is not enough potential to break through the trend resistance and the price forms a false breakout of 2390, the local trend may continue
Resistance levels: 2433, 2475
Support levels: 2390, 2313
The inability to continue growth will confirm the fact of bearish pressure (market distrust of the bullish momentum). The past momentum, in hindsight, can be considered manipulation (liquidity capture). Consolidation below 2390 may trigger a decline.
Best regards, R. Linda!

#Banknifty directions and levels for June 24:Current View
As already discussed:
If the market breaks out or consolidates around the rejection zone, we can expect a further rally continuation towards a minimum of the 78% Fibonacci level —
On the other hand, if the market faces rejection and breaks the 38% Fibonacci level of the minor swing:
Then we can expect a minimum correction of 50% to 78% in that minor swing.( to use fib
(Bank Nifty: Low to High – 55,779 to the upcoming high
Alternate View
If the gap-up doesn’t sustain and the market breaks the 38% Fibonacci level of the minor swing:
Then again, we can expect a correction of at least 50% to 78% in the same swing..( to use fib
(Bank Nifty: Low to High – 55,779 to the upcoming high

# Niftydirections and levels for June 24:Good morning, Friends! 🌞
Here are the market directions and levels for June 24:
Market Overview
Due to ongoing global issues, the markets are showing high volatility. Structurally, both the global and our local markets are still moving within a range.
However, Gift Nifty is indicating a strong gap-up of around 250 points.
So, what can we expect today?
In the previous session, both Nifty and Bank Nifty witnessed sharp ups and downs. Even with those swings, they still ended within a range.
However, today’s gap-up might break that previous range—if it holds.
We should wait for clear confirmation before expecting any continuation.
That means, if the market breaks the resistance with a solid candle or consolidates around the resistance zone, we can expect the rally to continue.
On the other hand, if the market faces rejection at the resistance, it may re-enter the range and move back within the channel.
Let’s look at the chart for more clarity.
Both Nifty and Bank Nifty appear to be showing a similar structure.
Current View
As already discussed:
If the market breaks out or consolidates around the rejection zone, we can expect a further rally continuation towards a minimum of the 78% Fibonacci level — for Bank Nifty and for Nifty, around the 25,286 to 25,383 zone.
On the other hand, if the market faces rejection and breaks the 38% Fibonacci level of the minor swing:
Then we can expect a minimum correction of 50% to 78% in that minor swing.( to use fib
Nifty: Low to High – 24,864 to the upcoming high)
Alternate View
If the gap-up doesn’t sustain and the market breaks the 38% Fibonacci level of the minor swing:
Then again, we can expect a correction of at least 50% to 78% in the same swing..( to use fib
Nifty: Low to High – 24,864 to the upcoming high)

Bearish Elliot Triangle Wave $250 targetObserving Tesla Chart, I noticed a bearish 4hr Elliot Wave A-E. The flow is also bearish and lines up with the bear sentiment. Looking for a bearish Apex Breakout..

USOIL Potential UpsidesHey Traders, in tomorrow's trading session we are monitoring USOIL for a buying opportunity around 72.00 zone, USOIL is trading in an uptrend and currently is in a correction phase in which it is approaching the trend at 72 support and resistance area.
Trade safe, Joe.

Gold: Breakout and Potential Retrace!!Hey Traders, in today's trading session we are monitoring XAUUSD for a selling opportunity around 3,390 zone, Gold was trading in an uptrend and successfully managed to break it out. Currently is in a correction phase in which it is approaching the retrace area at 3,390 support and resistance zone.
Trade safe, Joe.

Gold to make a new ath. gold is on a bullish run from all indications ,after making days of correction the bulls still got the market for a continuation
Thus once gold is able to breakthrough 3,392 Resistance I expect an impulsive move

Altseason 2025 – Wave 3 in playIn this Elliott Wave setup, Wave 2 appears to be bottoming out now. As Bitcoin dominance shows signs of declining, capital rotation into altcoins could ignite the powerful Wave 3. Historically, Wave 3 is the most explosive phase, often driving sharp, sustained gains across the altcoin market.

GOLD → Risk zone 3340. Sell-off after rallyFX:XAUUSD , after breaking out of its accumulation phase, rallied towards the 3400 zone of interest, but failed to reach liquidity and reversed, selling off its gains due to economic uncertainty.
In my opinion, the market is unexpectedly subdued and has reacted very weakly to geopolitical problems in the Middle East. The market has digested the news of US airstrikes on Iranian nuclear facilities and is awaiting PMI data from the US and the eurozone, Fed statements, US GDP and other macroeconomic data. The uncertainty factor has done its job... Participants fear further escalation of the conflict, but so far Iran has refrained from taking drastic steps, which has reduced demand for gold as a safe haven asset. Geopolitics and macro statistics remain in focus.
Technically, gold is trading above 3340 (in the buy zone). A retest of the liquidity zone is possible, and if buyers keep the market above 3340-3350, the price may continue to rise.
Support levels: 3347, 3342, 3320
Resistance levels: 3366, 3396
On D1, the key level is the 3340-3347 area. At the moment, we are seeing a sell-off and a move to retest support. Accordingly, a false breakdown and price holding above 3340, followed by a change in character and a breakdown of the bullish structure, will hint at growth. But if the reaction at 3340 is weak and the market continues to storm this support, then in this case, the metal could drop to 3300
Best regards, R. Linda!

ADAUSDT → Bear market. Support breakdownBINANCE:ADAUSDT.P is in the distribution phase after exiting consolidation. The coin continues to update local lows within a downtrend.
Technically, the cryptocurrency market is in stagnation/correction, as there is no bullish driver yet. Bitcoin is currently consolidating but continues to shoot local downward impulses, which generally has a negative impact on coins.
ADA is entering a distribution phase of accumulation formed in the range of 0.62 - 0.71. If the bears keep the price below 0.62-0.6, ADA may well test the intermediate bottom of 0.5364-0.51
Resistance levels: 0.61, 0.62
Support levels: 0.5993, 0.5364
Focus on 0.61 and the local level of 0.5993. Price consolidation below this zone could confirm the bearish nature of the market, which could lead to another decline.
Best regards, R. Linda!

USDCAD-Expecting a PB to 1.42 and then HUGE FALL !!!DISCLAIMER : All labelling and wave counts done by me by manually and i will keep change according to the LIVE MARKET PRICE ACTION. So don't bias, hope on my trade plans...try to learn and make your own strategy...Following is not that much easy...I AM NOT RESPONSIBLE FOR ANY LOSSES IF U TOOK THE TRADE ACCORDING TO MY TRADE PLANS....THANKS LOT..CHEERS

₿itcoin: PullbackBitcoin has experienced significant selling since Friday, briefly slipping below the $100,000 mark. We previously mentioned that a sharper pullback wouldn't surprise us. Whether prices will drop a bit further remains to be seen for the moment. Ultimately, we still expect Bitcoin to climb into the upper blue Target Zone (coordinates: $117,553 – $130,891) before a broader C-wave sell-off occurs, pushing the price down to the lower blue Target Zone (coordinates: $62,395 – $51,323). There, we anticipate the low of the larger orange wave a, which should mark the start of another corrective upward move. Afterward, we're preparing for the last downward leg of blue wave (ii). However, if Bitcoin directly surpasses the resistance at $130,891 – and thus our upper blue Target Zone – we'll locate it still in blue wave alt.(i) (30% probability).
📈 Over 190 precise analyses, clear entry points, and defined Target Zones - that's what we do.

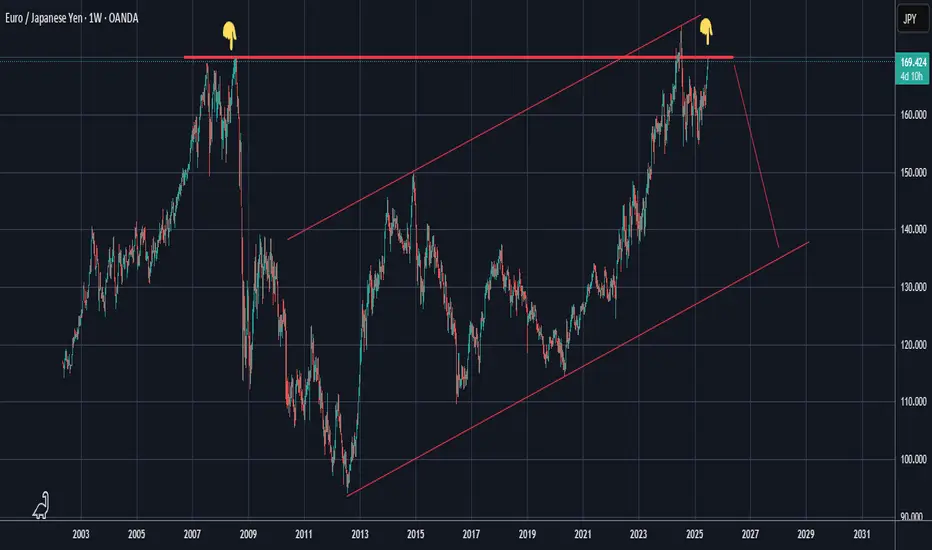
USDJPYLooking at this chart after I just did the EURJPY analysis, now this one looks more bullish than bearish BUT that's only if there is a breakout from the supply zone which Im assuming will give us a consolidation first before it shoots straight up to complete Wave 5. At the completion of Wave 5, we can expect the drop again as a correction and retest, which should usher in more buyers to form a Cup and Holder pattern. I really see the JPY being stronger than USD futuristically and practically.

BNB Double Correction Hits Extreme ZoneBINANCE:BNBUSD has now entered the Blue Box buying area, signaling the final phase of the correction. A weekly reversal confirmation is the next key step — once that’s in place, the bounce phase is expected to begin.

Injective Enters the Daily Bouncing AreaCRYPTO:INJUSD has tapped into the equal legs zone at $9.99–$8.97, a key Fibonacci-based support area where buyers may begin to step in. This zone often acts as a magnet for a reaction higher, especially if the broader structure supports a bullish reversal.
In the coming weeks, watch for confirmation signals — a strong bounce from this zone could kick off the next leg up.

EURJPYI saw an analysis on this pair and tried to get something like an early entry on it, but I noticed there's a lot going on on the smaller timeframes so I went to bigger and found some interesting facts like how the current price is at the area of previously strong supply zone/resistance zone. Which therefore imposes that we should see sellers coming in strong at any time now as we are in the sellers club, but this needs further confirmations from your side, what do you think?
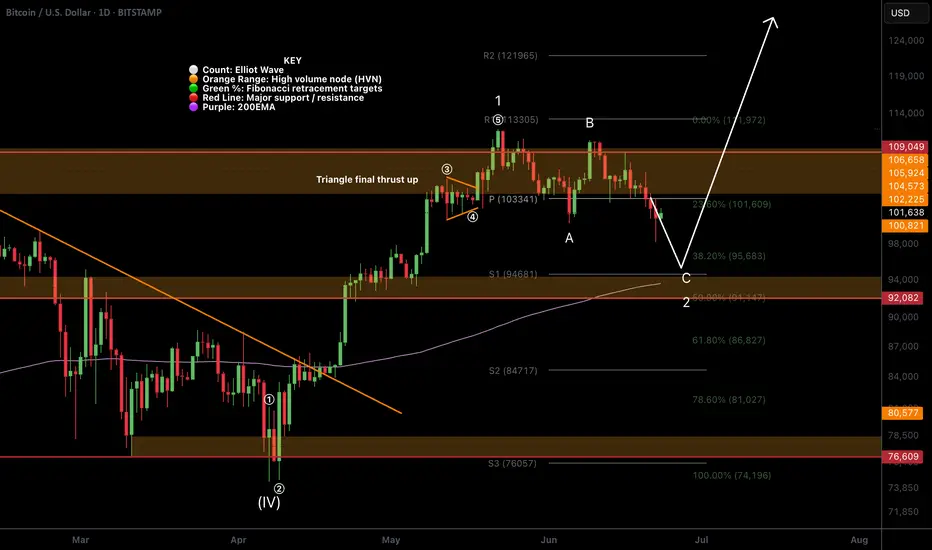
BTC Textbook Elliot Waves!CRYPTOCAP:BTC local analysis hasn't changed in a few weeks.
Price printed another text book Elliot motif wave, with the wave 4 triangle terminal pattern ending in the usual thrust up with a poke above all time high.
Price is also printing a textbook ABC for wave 2 with 5 waves down for A, 3 waves up for B and a strong wave C down to finish. Wave C's are always the strongest.
Pattern suggests price has one more push lower to complete this corrective wave tapping the quadruple support: S1 daily pivot, ascending daily 200EMA, major support High Volume Node (HVN) and 0.5 Fibonacci retracement at 92-94k range.
Most investors are publicly calling for buys in this area so price may be front run by the whales! The consensus often do not get what they want.
Safe trading
AAVE Standing out among the alt coins!CRYPTOCAP:AAVE is looking stronger than most for now. Local analysis has broken the bullish market structure on what appears to be a textbook Elliot Wave 1.
Price is testing quadruple support: Daily 200EMA, daily pivot, major support High Volume Node (HVN) and the 0.382-0.5 Fib retracements. This should be a tough nut to crack (as long as CRYPTOCAP:BTC doesn't dump hard).
Wave 2 retracement's are usually deep and come with a strong fear. It is where most retail investors capitulate only to find price turns around and continues bullishly without them in a aggressive wave 3.
Analysis is invalidated below $111, so quite a ways off yet.
If war escalation continue, irrational investor behaviour will likely break this technical analysis.
Safe trading.

Nifty directions and levels for June 23Good morning, Friends! 🌞
Here are the market directions and levels for June 23:
Market Overview
The global market is showing signs of consolidation with some cautious sentiment, and our local market is also reflecting the same.
However, Gift Nifty is indicating a 130-point negative start.
So, what can we expect today?
The structures in the higher degree timeframes are slightly different from one another, so we can't take any firm decision in advance.
However, my expectation is that the market may close with a negative bias today.
Let’s look at the chart for more clarity.
On the 15-minute chart, both Nifty and Bank Nifty appear to be showing a similar structure.
Current View
The current view suggests that if the market sustains the initial gap-down and consolidates, we can expect the correction to continue.
In this case, even if there is a solid pullback, the market may not move much higher.
This would mean it could consolidate between the previous day’s high and the upcoming low.
Alternate View
The alternate view suggests that if the market takes a pullback initially, it may consolidate within the previous day's range.
If it breaks the previous high after that, we can expect further rally continuation, possibly in a diagonal pattern.
