AppleNo change in regard to my Apple analysis. I am still waiting for price to either break down to the target box or head straight to the upper target box from here. I think given the current price action we have a higher probability of moving lower first, but the fact remains it is not required. This week will hopefully bring some needed clarity. Regardless of what happens, I believe we're within minor B. It is only a matter of what pathway price takes to get to its end destination.
Elliott Wave

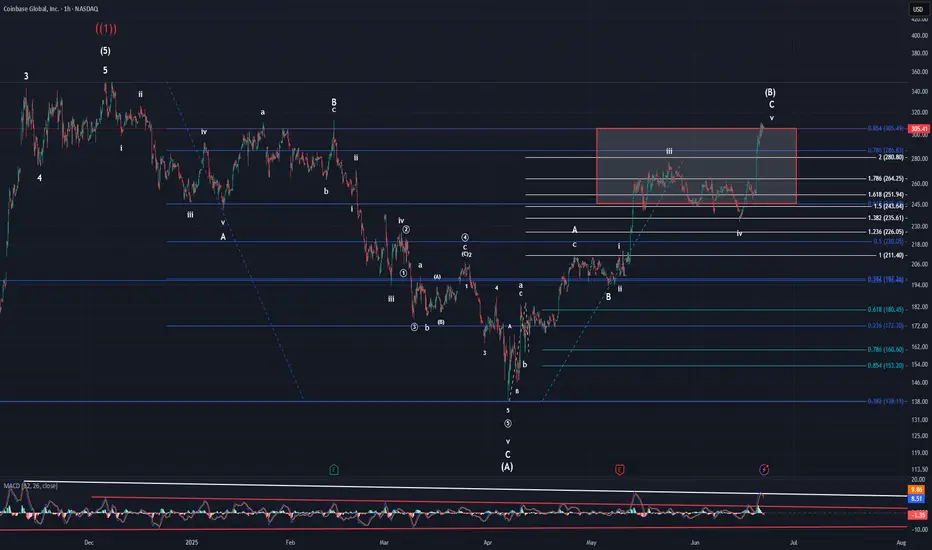
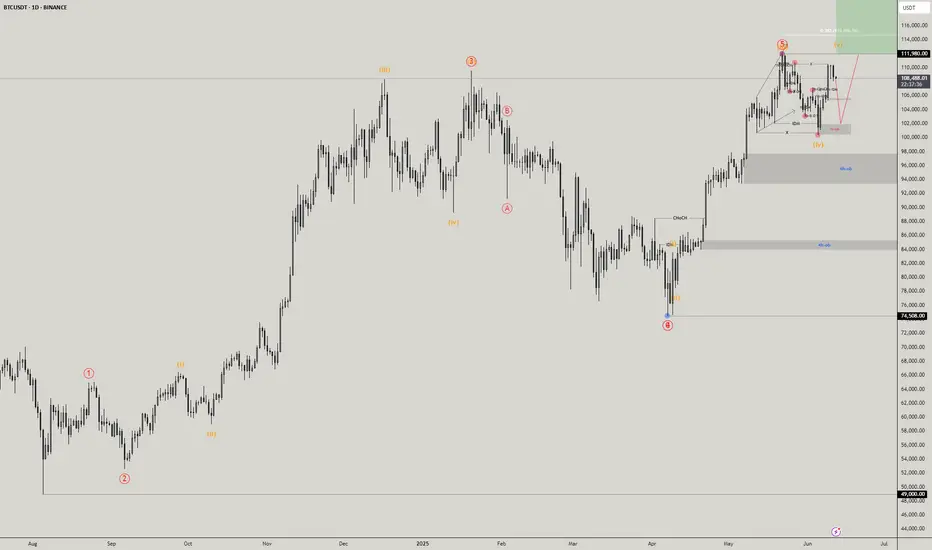
CoinbasePrice technically speaking has a full 5 waves with this latest move higher off the $240 low. I don't believe the micro-waves 4 & 5 are done yet though. MACD has reversed and looks to be heading down now, so I think that wave 4 will be kicking off starting Monday. Technically speaking, thus pattern could be complete, but my gut tells me that it is not. It is already overextended as it has breached the 0.854, but I still believe this is intermediate (B) due to the preceding price action.
In short, my primary is we get a slight move lower for 4 and then another slight high for 5 of v of C of (B). The ALT is that we head lower from here kicking off (C).
GOLD 4H target and 1H target 1TP / 3.340 Dollars
2TP / 3.120 Dollars
Gold for sell now with 2 targets

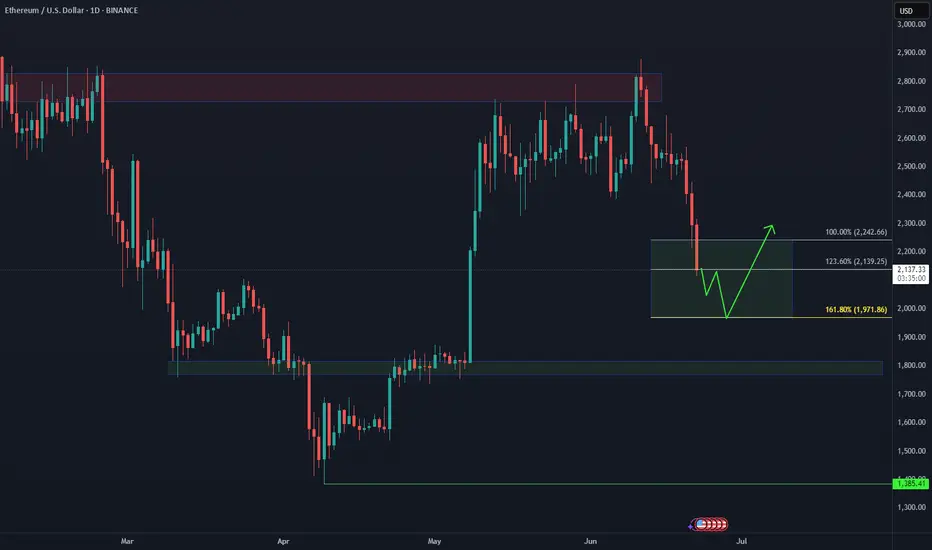
Ethereum: How Deep Into the Buying Area?📉 CRYPTO:ETHUSD is currently testing the extreme buying zone $2140–$1970 — a key area where a bullish reaction is anticipated. But if the bounce fails to materialize next week, eyes shift to the next potential demand zone near $1800.
This level aligns with prior structure and could offer a stronger base for the next leg higher — as long as the broader structure remains intact.
USDT Dominance Update (2H)The USDT Dominance (USDT.D) chart — often referred to as the “reverse chart of crypto” — is currently showing signs of strength. On the micro time frame, a new impulsive wave structure has emerged, and we are likely progressing through wave 3 of this formation.
Wave 3 appears to be targeting the 4.88% level.
A minor correction (wave 4) may follow.
Ultimately, wave 5 is projected to reach the 5.00% zone.
Market Implications:
If this scenario unfolds as expected:
Bitcoin could down toward the $100,000–$101,000 range.
However, altcoins may face a sharp correction, with potential losses of 15–20%, exacerbated by the rising BTC dominance and capital flow concentration.
⚠️ While macro bullish momentum remains intact for the market, this short-term USDT.D surge could present a temporary but significant shakeout, especially across the altcoin sector.
— Thanks for reading.

Gold Technical ✅ Entry Level (Long Position):
Ideal entry zone: Between $3,360 – $3,370
This is near the Wave (4) low and just above the ascending channel support line.
Also aligns with the 23.6% Fibonacci retracement level, where price has shown signs of support.
---
🎯 Take Profit (Exit Levels):
These targets are based on Fibonacci extensions and the upper boundary of the channel:
1. TP1: $3,400 (50.0% Fib level) – conservative target, aligns with minor resistance.
2. TP2: $3,415 (61.8% Fib level) – key Fibonacci golden ratio and likely Wave (5) area.
3. TP3: $3,435–$3,440 (upper channel line) – aggressive target, aligns with 100% extension and projected Wave (5) peak.

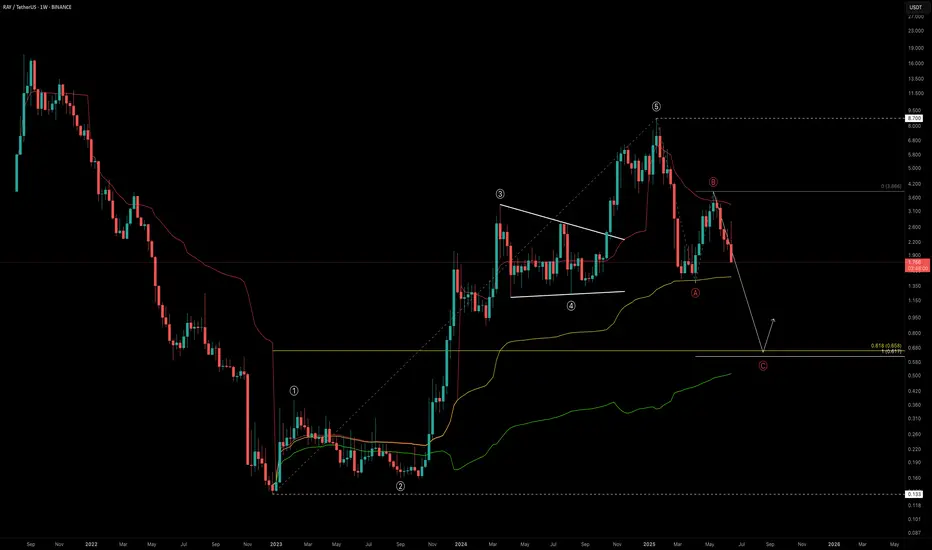
RAY Outlook: Is a -60% Drop the Reset We Need?RAY marked its bottom in December 2022 at just $0.133, entering a prolonged accumulation phase that lasted nearly a year. Then, in late 2023, it broke out into an explosive bull run, skyrocketing +6421% over 756 days and peaking at an impressive $8.70.
This run completed a full five-wave Elliott Wave structure. After topping out, RAY dropped -84% down to $1.388 — likely marking the Wave A correction. A strong relief rally followed into the $4 region before facing rejection at the yearly VWAP, possibly completing Wave B. Now, all signs point toward us being in the final Wave C of the larger corrective structure.
So, where could Wave C bottom out?
🔍 Fibonacci Confluence Zones (Log Scale)
Let’s assess the key levels with log-scaled Fibonacci tools:
🔹 Fib Retracement (from $0.133 low to $8.7 high):
The 0.618 fib retracement lies at $0.658
🔹 Trend-Based Fib Extension (Wave A → B projection for Wave C):
1.0 TBFE sits at $0.617
✅ These two levels align nearly perfectly, giving us a strong confluence zone between $0.62 and $0.66
Additional Confluences
Anchored VWAP Bands:
The 0.618 VWAP band multiplier also aligns with this $0.6 zone
Liquidity Perspective:
This level would wipe out long positions built over the past 550 days — clearing and potentially resetting the market
🚨 Fair Value Trend Model (FV Trend Model):
According to my Fair Value Trend Model indicator, the fair value for RAY currently sits around $0.78 — right in line with the broader confluence zone. This model uses log-log regression to estimate Bitcoin’s and other assets’ fair-value over time.
👉 Feel free to use the indicator
Just head over to my profile, click on the “Scripts” tab, and you can add the Fair Value Trend Model to your charts to experiment with it yourself.
Together, these technical elements form a compelling high-probability zone for long setups around $0.6–$0.8.
💡 Educational Insight — Why 0.618 is a Critical Fib Level
In Elliott Wave theory and harmonic trading, the 0.618 retracement is known as the "Golden Ratio" — often serving as a magnet for price during corrections. When paired with a 1.0 trend-based fib extension, it can mark exhaustion zones where Wave C concludes.
🔭 Summary: What’s Next for RAY?
Potential bottom zone: $0.61–$0.78
Watch for reversal signals like bullish candlestick patterns, volume spikes, or divergences
A drop to this zone would represent a -60% drawdown from current levels
Remember: High-probability setups don’t come every day — patience is your edge
Set alerts. Stay prepared.
_________________________________
💬 If you found this helpful, drop a like and comment!
Want breakdowns of other charts? Leave your requests below.
Bitcoin Short: Wave CAfter a 6-days move up after we have hit our target in the previous analysis, I think Bitcoin has completed what I think to be the Wave B and is already on the Wave C run down.
Over in this video, I expressed my personal viewpoint that Bitcoin is not a hedge against the dollar and that it is actually a risk-on/off product more similar to the equities markets like the S&P500. I recommend that anyone who is interested to perform a study on the correlation and beta Bitcoin.
I suggested that the reason why it more closely related to the equity markets is due to it's deep integration within the financial sector (e.g. ETFs, structured products from banks).
Given that I think that the equity markets are primed to crash soon, I think that Bitcoin will follow suit.
Good luck!

S&P500 Update: Break of Lower TrendlineIn this video, I updated the wave count for S&P500 and discussed 2 different ways of counting it but ended with a bias on a stronger wave 3 down as opposed to a wave 5 of 1 down.
The stop loss is above 6016, with 2 take profit targets:
1) 5940
2) 5923
Good luck!

Do you wanna see the bigger picture? (USDT.D Analysis 12H)After counting many waves for many days, I have a senario for USDT dominance which will lead the entire market on its way.
For those whose not fimiliar with this parameter, there is a very simple explanation.
It's the reversed way to see the market. If this parameter drops, your alts will skyrocket and if it rises, you're gonna be crying on somebody's X post's comments.
First of all, the short term wiev is bearish. We are currently in an impulsive wave 3 which is expected to be hardest for altcoins at the moment. There will be crash unless the value of this parameter drops below %4.50 and invalidates the analysis (you'll like this senario better, trust me).
All right, we got rid of the scalpers who bothered to read this far and now I'm here to explain what I see for the golden future.
Currently, USDT.D is forming a BEARISH impulsive wave for higher time frames. As long as you stick with 4H candles, you won't be able to see it.
USDT.D is trying to forming its bearish flag, by doing so it will be its second wave and will prepare its very own collapse.
Last summer, BTC has done the same thing (Check for daily time BTC).
There is more.
If we calculate the depth of this incoming flag pattern, breaking this flag would lead USDT to %3.75 which is the yearly support (Check in weekly, you'll see it).
If we calculate the time needed to past for this flag to work, it's the same amount of time needed for previous flag to break from last summer.
We also need to add fundementals in it. Currently people started to talk about a senario which will lead world to WW3. I don't think that will happen. But the problem in here is it will market throguh downside.
Furthermore, there is FED.
FED is insisting to leave interest rates on its own without a change. I believe that we won't be seeing any rate cuts till the end of this summer.
I believe that the FED will cute rates between Agust and September. This will be the fuel for our rocket to fly and ignite the wave 3.
I know it's a long script but you know it's necessary.
Thanks for reading.

USDJPY: Ready for Wave 5?USDJPY is showing a strong bullish wave structure, with a clear path toward higher levels based on Elliott Wave Theory. After a successful breakout from a multi-year consolidation, price action appears to be completing a Wave (4) correction thereby setting the stage for a Wave (5) rally.
Based on the bullish structure and projected continuation:
1st Target = 157.78
2nd Target = 177.41
Final Target = 209.16 Full wave extension, top of macro channel
With support holding above ¥140.00 and a bullish bounce forming, this could mark the Wave C bottom of (4), setting the stage for the next major leg up.
Disclaimer:
This analysis is for informational and educational purposes only and does not constitute financial advice. Markets are dynamic and unpredictable.

KAITO Waiting For ExtremesBINANCE:KAITOUSDT The bounce from $1.50 didn’t deliver the upside follow-through — now price is heading toward the equal legs zone at $0.97–$0.77.
As long as the April low holds, this area could attract buyers for another attempt higher. But if it breaks, we may be looking at a deeper correction.

COOKIE Failed to Hold $0.20 ! What's Next ?BYBIT:COOKIEUSDT bounce attempt fizzled, and price broke lower below $0.2 — now heading toward the $0.14 support zone, with Fibonacci extension at $0.10 in sight.
Will bulls defend the April low and spark a fresh rally from here? Eyes on the reaction.

Bittensor Step-by-Step Process🧠 BINANCE:TAOUSD has entered the #BlueBox buying area at $302–$214, where the bottoming process is expected to begin. This zone aligns with the typical equal legs fib cluster setup is a high-probability region for bulls to step in.
Now it’s all about strategy:
🔹 Aggressive bulls might start scaling in here
🔹 Conservative traders may wait for reversal confirmation — like a break of internal trendlines or bullish divergence on lower timeframes
Either way, the groundwork for the next rally could be forming.

Solana Next Buying Zone on WatchCRYPTO:SOLUSD is correcting the 5 waves advance from April low within a 3 waves ZigZag structure and as price slipped to a new marginal low beneath last week’s support, signaling potential weakness toward equal legs area$122 - $111 before buyers look to step in again.
Keeping an eye on reactions in this zone—could set up for a bullish reversal once demand kicks in!

FARTCOIN Loading The BeansCRYPTO:FARTCOINUSD after the initial bounce failed, the correction against the March low is still unfolding within a 3-swing Zigzag, targeting the equal legs zone at $0.75–$0.57 — where bulls are expected to step in for the next blast higher.
Load the beans!! Time to fart!! 💨

VADER Enters Buying AreaDon’t Sleep on MEXC:VADERUSDT
It's currently in the process of doing a 3 waves pullback to correct the previous cycle and it reached the $0.044–$0.032 equal legs zone.
A bullish reaction could kick in next week — eyes open, structure’s still in play.

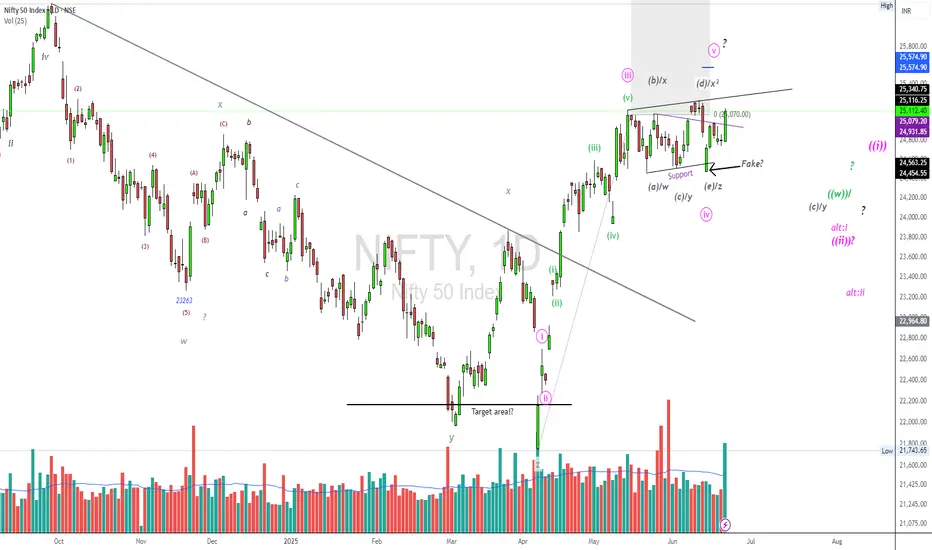
NIFTY50.....Ready to explode?Hello Traders,
the NIFTY50 has misleading! It jumps up and down and has probably overcome the descending trend line, as seen in the chart! My argument for a 'fake' move is still valid, as long as the low @ 24473 remains in place.
Chart analysis:
The next upside target for the bulls is around the 25260 to 25300 points, depending on whether if is achieved.
The targets are still valid, and India is lily on the way, to become one of the leading Industrial nations in the future. Of course, the Nation has a long way to go, but keep this in mind! If the government improves in infrastructure, such as electric power supply and building bridges and motorways etc., the potential will be phenomenal!
In any case, we should all invest in this "huge and strong" nation.
I would normally not recommend an ETF for India, but I am making it this, caused by the enormous potential!
But, back to chart. I don`t think the upward move has ended yet. So, we are still focused on further upside potential!
My long-time targets are still valid. We'll see?
Have a great weekend....
Ruebennase
Please ask or comment as appropriate.
Trade on this analysis at your own risk.
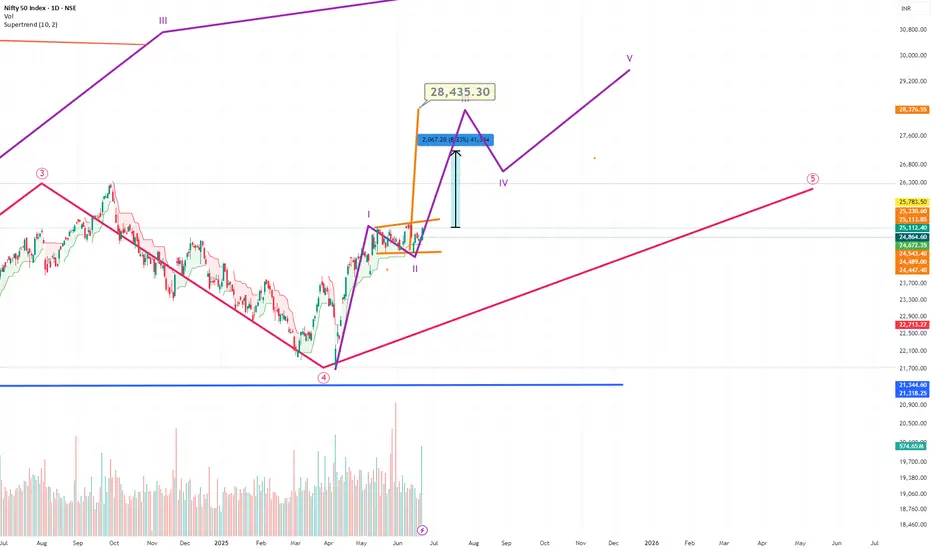
NIFTY Future path..Up to 28000Please note that Nifty is in a medium 5th wave..in which it is completed or completing its 2nd wave...that means we will have a 3rd wave up to 28000 Minimum...as per Neo waves..calculated by adding 1.l618 of the 1st wave...tgt is 28400 minimum....Remember mkts have climbed walls of worry....which is a sign of bullish markets...
BITCOIN → Possibility of retesting 100K. Buyer weakeningBINANCE:BTCUSDT.P is in consolidation after the rally stalled due to the exhaustion of the bullish driver. The price updates local lows and starts looking at 100K
Bitcoin is under pressure after the escalation of conflict in the middle east and after the FOMC speech. There is also another observation: large companies, politicians, funds and investors have long and aggressively motivate the crowd to buy, verbally confirming that they bought dozens and hundreds of bitcoins at a time for the balance, but bitcoin is standing still and updating lows. At the same time, various services such as "cryptorank" fix bullish sentiment at the lows. The market either lacks liquidity or something more unpredictable is happening (chart drawing????)
Technically, bitcoin is following the behavior of the SP500 quite strongly, which closes Friday's session quite weak and close to key support, which could trigger a continuation of the decline. Bitcoin won't stay on the sidelines and could also follow the index....
Resistance levels: 104K, 105K, 106K
Support levels: 102K, 100.6K, 97.5K
The price is coming out of the “symmetrical triangle” consolidation breaking the support, thus confirming the bearish mood. After a small correction after a false breakdown of 102500 the price may again return to storm (retest) the level under market pressure, which will only strengthen expectations of further decline. The target is liquidity 100600 - 100K. From 100K rebound and growth is possible.
Regards R. Linda!

BTCUSDT Possible Sell BTCUSDT completed wave 4 of 5 and currently in wave 5 of 5 . wave 5 targets are on green and a possible sell is in place to finish wave 2 of 5 .
Good LUck
Bitcoin Hits PRZ — Is This the Perfect Short Entry?Bitcoin ( BINANCE:BTCUSDT ) has entered the Potential Reversal Zone (PRZ) after a strong bullish impulse , testing the confluence of Daily Resistance(3) .
In terms of Elliott Wave analysis , the market seems to have completed a complex WXY corrective structure , with the recent rally likely representing the final wave Y . This makes the current zone highly reactive for potential reversal .
I expect Bitcoin to retrace toward the CME Gap($105,075-$105,055) and possibly continue downward toward the Support zone($104,380-$103,060) and Cumulative Long Liquidation levels if the sellers regain momentum .
Cumulative Short Liquidation Leverage: $107,568-$106,601
Cumulative Long Liquidation Leverage: $105,360-$104,784
Cumulative Long Liquidation Leverage: $103,937-$103,217
Note: It is better to look for short positions at the Potential Reversal Zone (PRZ) or if Bitcoin touches $104,780 before reaching PRZ. That is why I chose to label this analysis as ''Short".
Note: If Bitcoin can touch $107,620 , there is a possibility of breaking the resistance lines and increasing further.
Please respect each other's ideas and express them politely if you agree or disagree.
Bitcoin Analyze (BTCUSDT), 1-hour time frame.
Be sure to follow the updated ideas.
Do not forget to put a Stop loss for your positions (For every position you want to open).
Please follow your strategy and updates; this is just my Idea, and I will gladly see your ideas in this post.
Please do not forget the ✅' like '✅ button 🙏😊 & Share it with your friends; thanks, and Trade safe.

Another drop for BitcoinHi traders,
Last week Bitcoin went exactly as predicted.
Price went up a little higher into the Daily FVG and after that it started the next wave down and smaller correction up.
Now we could see a small correction up and after that another drop.
Let's see what the market does and react.
Trade idea: Wait for the correction up to finish to trade shorts.
If you want to learn more about trading FVG's with wave analysis, please make sure to follow me.
This shared post is only my point of view on what could be the next move in this pair based on my analysis.
Don't be emotional, just trade your plan!
Eduwave
