SUI Macro AnalysisCRYPTOCAP:SUI macro analysis update...
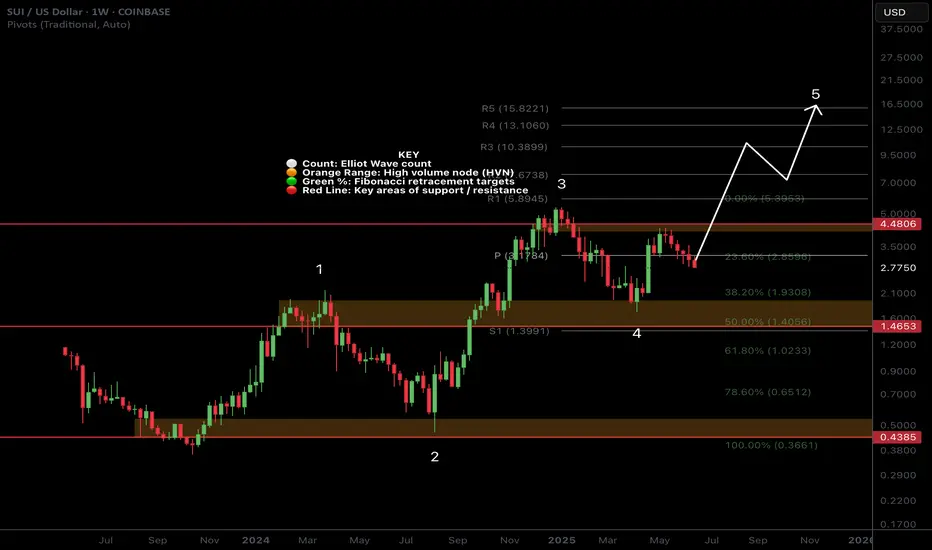
📈 𝙇𝙤𝙣𝙜 𝙩𝙚𝙧𝙢 outlook shows price action still outperforming most alts with a great rally recently. Target remains the R5 weekly pivot at $15
📉 𝙎𝙝𝙤𝙧𝙩 𝙩𝙚𝙧𝙢 outlook has price pulling back, looking to find a bottom between $2.3-2.65
War escalation's and retail selling are keeping price suppressed as price changes hands to private companies and large wallets.
The time for patience continues. Money is made in the sitting, weathering volatility, not flipping in and out of trades on every bit of news and price movement
𝙏𝙚𝙘𝙝𝙣𝙞𝙘𝙖𝙡 𝘼𝙣𝙖𝙡𝙮𝙨𝙞𝙨
Price is testing the weekly pivot and daily S1 pivot as support
Elliot Wave (EW) analysis was a strong, textbook motif wave with a wave 2 retracement underway. Wave 2 often extends to the 61.8 Fibonacci retracement of $2.4 but the alt-coin golden pocket is the 78.6 at $2.03. No surprises if we see that area revisited and could be a great buying opportunity.
Price has lost the daily 200EMA and DEMA which is bearish short term.
Safe trading
Elliott Wave
Mixed Signals On GoldIt’s been a while since I’ve posted an idea and for anyone who follows my posts, unfortunately I timed my trades poorly with the bearish pivot so I have taken a step back, and am now seeing some interesting developments happening in the market.
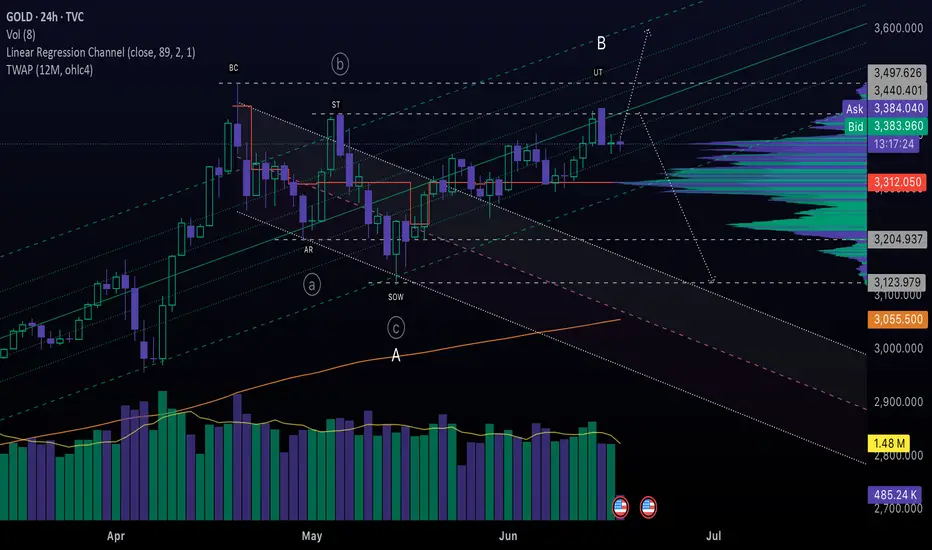
For now, I’ll keep it brief. I wanted to post a quick analysis on TVC:GOLD ahead of the rate decision using elements of the Wyckoff method and Elliott Wave. If you asked me a month ago where I thought Gold was heading, I would have said ATH - and while that can still happen, I’m seeing weakness on today’s chart that is worthy of attention.
For starters, The A wave established the pullback in a typical 3-wave pattern that mostly stayed within the channel. The bullish breakout was tested twice, so I would interpret it as bullish - however the subsequent flat movement and rejection at resistance suggests that the rise from May 14th could be losing steam.
The current price ($3,382) is at a neutral level. From here, we could see several scenarios play out; a false bullish breakout, a true bullish breakout, or a break below the channel to retest demand. Breaking out of the channel could signal a Change of Character (CHoCH), and could indicate that smart money is distributing in a flat pattern. If the price breaks down key level of support would be at the Sign of Weakness (SOW), which has confluence with the extended lines of the Wave A channel.
If Gold is set to rise to ATH, I still think it will need to pull back to find large buying volume in the middle of the Wyckoff channel (white rays) first. We will see what happens today, but it’s starting to look like the bears may have the upper hand here.
GBPUSD may form a false break of supportGBPUSD has wasted the entire daily move (ATR) and is forming a false break of the mirror level support and trading range support. The price fell on the background of the dollar growth (which is trading on the background of the global downtrend)
Now, while the price is consolidating below the mirror level, sellers (physical persons) open deals. But, based on the situation and spent ATR when the price returns inside the range there will be a liquidation stage, which can provoke the price growth
The price fixing above 1.34437 may be the beginning of a pullback (trend growth).
Scenario: if the decline does not continue, and the price is able to consolidate above 1.3448, in this case we can expect a correction to 1.35, 1.353.

EURUSD: Price Action + Elliott Wave + SMC Analysis
"Hello traders!
Today, we're diving deep into EURUSD with a comprehensive analysis combining Price Action, Elliott Wave principles, and Smart Money Concepts (SMC).
On the chart, we observe key price action elements including:
* A 'Psychological FVG' (Fair Value Gap) around the 1.15100 - 1.15261 area, which could act as a potential resistance or reversal poin
* A target or support level identified around 1.14494 and further down at 1.14502.
Looking ahead, the diagram on the right illustrates a potential Elliott Wave structure integrated with SMC concepts:
* We see proposed waves leading to a 'BOS' (Break of Structure) indicating a shift in market control.
* An 'Imbalance' zone is highlighted, suggesting an area where price might seek to rebalance before continuing its move.
* The overall structure points towards a continued bearish momentum after potential retracements.
Key Takeaways:
* Watch the identified FVG for potential reactions.
* Monitor for further BOS confirmations to validate the bearish outlook.
* The 'Imbalance' zone could offer shorting opportunities if price retests it.
This analysis provides a multi-faceted approach to understanding potential future price movements in EURUSD. Always remember to manage your risk effectively.
What are your thoughts on this analysis? Share your insights in the comments below!
#EURUSD #Forex #PriceAction #ElliottWave #SMC #TradingAnalysis #TechnicalAnalysis #MarketOutlook #ForexTrading"

GOLD → Bear pressure. Area of interest: 3340–3306FX:XAUUSD continues to decline under pressure from sell-offs. However, the situation is interesting overall, as there is conflicting data and unexpected price behavior is surprising the market...
On Tuesday, gold is trying to regain the $3,400 level after pulling back from highs, but it is still facing selling pressure and returning to $3,377. The market reaction to the $3,377 level is quite weak, and if the price starts to stick to support, this will lead to a further decline. The dollar is strengthening as a safe-haven currency, holding back gold's growth. The markets are focused on the outcome of the Fed and Bank of Japan meetings, as well as US retail sales data. Any dovish signals from the Fed could support gold and weaken the dollar.
Technically, on D1, gold is returning below the 3382 level (selling zone) and testing 3377. The reaction to the false breakout of support is weak, and the price is forming a pre-breakdown consolidation relative to 3377. There are clear areas of interest that could lure the price before the news. For example, 3343, 3306, 3245.
Resistance levels: 3382, 3403.
Support levels: 3377, 3339, 3320
The bearish structure will be broken if the price strengthens to 3403 and consolidates above that level. This will reinforce buyers' expectations, which could lead to growth. At the moment, I would expect two scenarios: price consolidation within 3377-3403. But technically, the chart shows that there is bearish pressure in the market. The price continues to storm the support level of 3377, which may not hold up against another retest. A break 3377 could lead to a fall to the areas of interest at 3339-3306.
Best regards, R. Linda!

DXY Long term targetI think the IV wave is finished. now in 1-2 year dxy next target will be around 120. probably in 1 year.

TOTALCAP — The Next Trillion Crypto Move: Are You Ready?When people analyse the crypto market, they often default to Bitcoin and for good reason. It’s the one and only, the king. But sometimes, to see the forest instead of just the tree, you need to zoom out and study the broader picture.
That’s where the Crypto Total Market Cap (TOTALCAP) chart comes in. It’s essentially the mirror of Bitcoin, but it offers powerful macro insight — not just price, but scale. Looking at trillions instead of dollars changes how you frame support, resistance, and overall sentiment. Let’s dive in.
🧠 Why TOTALCAP Matters
TOTALCAP aggregates the value of every coin and token — the complete valuation of the entire crypto industry.
And while it often moves in sync with Bitcoin, it carries a different weight.
Shows the “big picture” of institutional and retail money flow
Offers clearly defined round-number zones (Trillions) as psychological S/R
Removes coin-specific anomalies and focuses on collective momentum
In bull and bear markets, these trillion-dollar thresholds act like major checkpoints. Watching how TOTALCAP interacts with these levels can give early signals that BTC or alts alone can’t.
Historical Key Levels & Structure
Let’s break it down by macro phases:
✅ November 2021 — Peak of Last Bull Market:
TOTALCAP peaked exactly at $3 Trillion.
This level acted as a ceiling — once hit, the market reversed sharply.
This marked the top of the 5-wave impulsive move (Elliott Wave theory).
📉 November 2022 — Bear Market Bottom:
TOTALCAP dropped below $1 Trillion, bottoming at $727 Billion.
This was almost a 0.786 fib retracement from peak — similar to BTC’s historical retracements.
The $1T mark was retested as resistance before being reclaimed as support.
📈 2023–2025 — The Bull Awakens:
$1 Trillion flipped into solid support throughout 2023.
A clear sign the macro market structure had shifted bullish.
Once $2T was breached, things moved fast.
🚀 Current State:
The market surged above the previous $3T ceiling.
TOTALCAP has hit a new ATH: $3.73 Trillion
Now, the question is: Is this the start of a new leg higher, or a bull trap before a correction?
🔍 Fibonacci Confluences — Why $3.7T Was Key
The sharp rejection at $3.7T wasn’t random. It aligns with:
1.0 Trend-Based Fib Extension: From 91.24B → 3T high → 727B low = 1.0 = 3.65T ✅ precise hit
1.272 Fib Extension of the macro move
Upper Pitchfork Resistance
Channel Top Rejection
→ All signals converged to mark that level as major resistance
🌀 Elliott Wave Macro Count
Looking at the weekly timeframe, we can see a clear impulsive 5-wave movement from the 2022 lows:
Wave 1: $727B → $1.26T
Wave 2: Correction to $975B ($1T) (support confirmed)
Wave 3: Massive rally toward $2.72T
Wave 4: Pullback toward $1.69T (VWAP retest)
Wave 5: $3.73T ATH
What does this imply?
According to classical Elliott Wave theory, after a full 5-wave move, the market tends to enter an corrective phase.
🔍 Some key levels to watch:
$3T: Historical S/R (was the 2021 top, now acting as a key level)
$2.31T: Recent swing low
$2T: Psychological and structural support
📌 Zone of Interest for Longs: $2.31T–$2T
This zone holds:
Previous consolidation zone from mid-2024
Fib retracement confluence
Likely forming Wave C bottom if this is a full ABC
🎯 Upside Targets — What If We Continue Higher?
Looking ahead:
🔸 1.618–1.666 Fib Extension = $4.42T–$4.53T
🔸 1.618 TBFE from previous cycle = ~$5.45T
📌 Rounded Targets: $4.5T, $5T and $5.5T
These are the next likely macro cycle targets — but only after a healthy correction and consolidation.
☀️ Macro Context & Summer Seasonality
Historically, summer tends to be a weaker period:
Lower volume
Institutional rebalancing
Geopolitical and macroeconomic uncertainty
📚 Educational Insight: TOTALCAP as a Tool
Treat TOTALCAP like the S&P500 of crypto.
Use round trillions as psychological levels: 1T, 2T, 3T, etc.
Always check if BTC’s price is aligned with where TOTALCAP is on the macro structure
Helps judge market strength even when BTC dominance is shifting
It’s especially useful when altcoins pump or dump out of sync with BTC — you can use TOTALCAP to track the real flow of money.
💡 Final Thoughts
We are likely in a corrective phase after a complete 5-wave cycle.
The area between $2.31T and $2T offers high-probability long entries
Watching how TOTALCAP reacts to these levels will help us anticipate the broader market’s next move
Summer slowdown could mean chop — but this also creates opportunities
💬 Let me know your thoughts: Are we entering a deeper correction? Or will TOTALCAP surprise us with a new leg higher?
Don’t forget to zoom out. The charts always tell the story.
_________________________________
💬 If you found this helpful, drop a like and comment!
Want breakdowns of other charts? Leave your requests below.

Time for a Rise in Oil Prices $$$When analyzing the recent movements in oil prices through the lens of Elliott Wave Theory, it appears that the current structure is completing an ABC corrective formation.
Initially, the A wave has developed as a strong upward 1-5 impulse structure.
The B wave evolved through a classic ABC correction, pushing prices down to the support area marked as (B).
Following this correction, early signals indicate the initiation of the C wave.
In this context, the technical structure suggests a potential new upward momentum in oil prices with the activation of the C wave. The target zone for the C wave should be monitored in consideration of the existing trendlines and historical resistance levels.
Nevertheless, under the current market conditions characterized by high volatility, it is critical to monitor volume and momentum indicators to confirm the C wave and ensure key support levels are maintained.

Elliot Wave Count Bitcoin - BTCElliot Wave count BTC. Last wave up could be 1st of 5th wave, but think it's a B wave, in expanded flat wave B can take on an impulsive structure and consist of five waves, allowing it to rise above the starting point of wave A. Supported by Elliot Wave count in Equity where probably wave 5 is also placed. And by latest lower high what could be start of market structure change. Invalidation above more or less 113-116k. Fib.time 0.66 gives turning point on July 6th in confluence with end of wedge. World is mega bullish with lot of fresh Longs (big-time in ETF's) waiting for overnight millions. Lets see how this count works out.

Cardano and Diametric Pattern
We are currently in wave-g of the Diamond Diametric and it could continue to 0.43.
After the completion of the Diametric, if the Double Combination pattern does not form, we expect an uptrend to form. (The post-pattern movement will show us whether the Diametric has completed or not).
Good luck
NEoWave Chart

Geopolitical Tensions & Technical Pattern Point to BTC Decline!Bitcoin ( BINANCE:BTCUSDT ) fell about -5% after tensions between Israel and Iran escalated. Unfortunately , these tensions are still escalating, but Bitcoin has managed to recover about +3% so far.
Bitcoin is moving near the Resistance zone($107,120-$105,330) and Cumulative Short Liquidation Leverage .
In terms of Elliott Wave theory , it seems that Bitcoin is completing a corrective wave . The corrective wave structure could be Contracting Triangle . In case of a sharp decline in Bitcoin again, we can consider these waves as five descending waves (if Bitcoin does NOT touch $106,600 ).
I expect Bitcoin to start declining again and at least drop to the Support zone($107,120-$105,330 ). The second Target could be the Support line and Cumulative Long Liquidation Leverage .
Note: If Bitcoin can break the Resistance zone($107,120-$105,330), we can expect further increases in Bitcoin.
Please respect each other's ideas and express them politely if you agree or disagree.
Bitcoin Analyze (BTCUSDT), 1-hour time frame.
Be sure to follow the updated ideas.
Do not forget to put a Stop loss for your positions (For every position you want to open).
Please follow your strategy and updates; this is just my Idea, and I will gladly see your ideas in this post.
Please do not forget the ✅' like '✅ button 🙏😊 & Share it with your friends; thanks, and Trade safe.

Long on OIL amid Israel-Iran confilctFundamental trends:
Israel-Iran conflict does not seem to end soon, Israel might target iranian facilities more
Recent insights suggest US involvement which whould lead to oil price rising.
Technical trends:
Plot seems to develope an Elliot impulse wave with clear 1-3rd waves already built. This suggests the impulse wave must end with rising on 5th wave.
Conclution
Overall trends tell in favor of future oil prices rising.
What do you think about the situation? Please, leave your comments

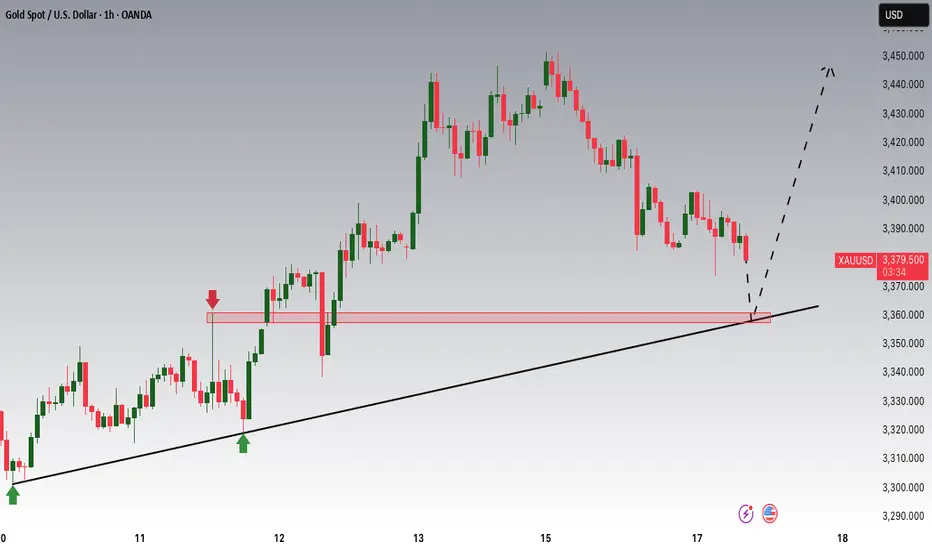
Gold is Nearing an Important Support!!Hey Traders, in today's trading session we are monitoring XAUUSD for a buying opportunity around 3,360 zone, Gold is trading in an uptrend and currently is in a correction phase in which it is approaching the trend at 3,360 support and resistance area.
Trade safe, Joe.
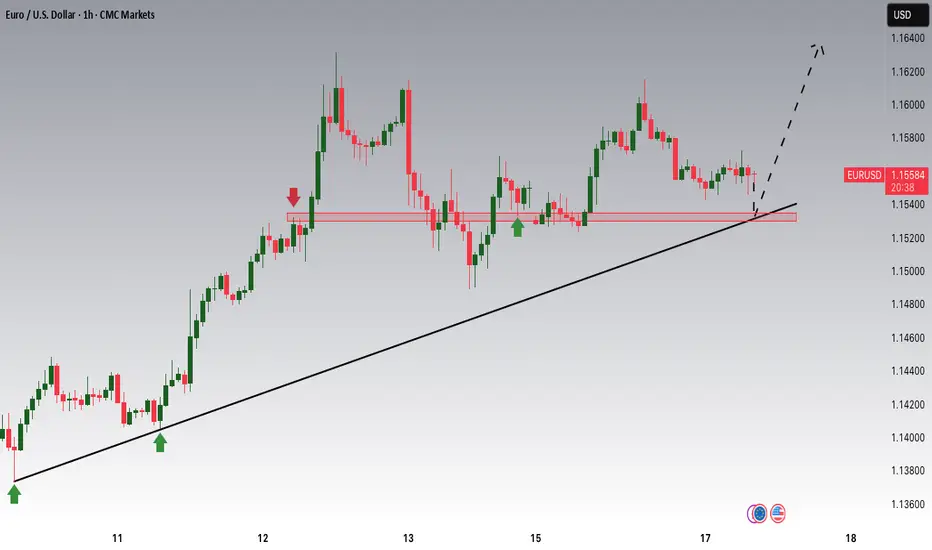
EURUSD Potential UpsidesHey Traders, in today's trading session we are monitoring EURUSD for a buying opportunity around 1.15300 zone, EURUSD is trading in an uptrend and currently is in a correction phase in which it is approaching the trend at 1.15300 support and resistance area.
Trade safe, Joe.
Bitcoin Pushed Crypto Market Into A Higher Degree CorrectionGood morning Crypto traders! Cryptos are coming lower and we can now see a five-wave drop on Bitcoin, which indicates for a deeper, higher degree correction, so Crypto TOTAL market cap chart may stay in consolidation within an ABC correction, which can retest 3.0T – 2.8T support zone before bulls return.
Bitcoin has impulsive characteristics on 4h time frame, and we can clearly see five waves up that can send the price even higher after a pullback. Now that it’s back to all-time highs, we can see it making a higher degree ABC correction, which can take some time, and it can retrace the price back to 97k-93k support zone before a bullish continuation.
However, we may now see a temporary corrective recovery in wave B, where some ALTcoins could still be doing well, if we consider that ALTcoin dominance may start kicking in. Yesterday we shared a chart of the ratio of TOTAL3(ALTcoins) market cap against Bitcoin with ticker TOTAL3ESBTC, which shows that ALTcoins may start outperforming BTC soon. It can be finishing final subwave C of (Y) of a correction in blue wave B which may cause a new strong rally into wave C that can bring the ALTseason similar as in the beginning of 2021.

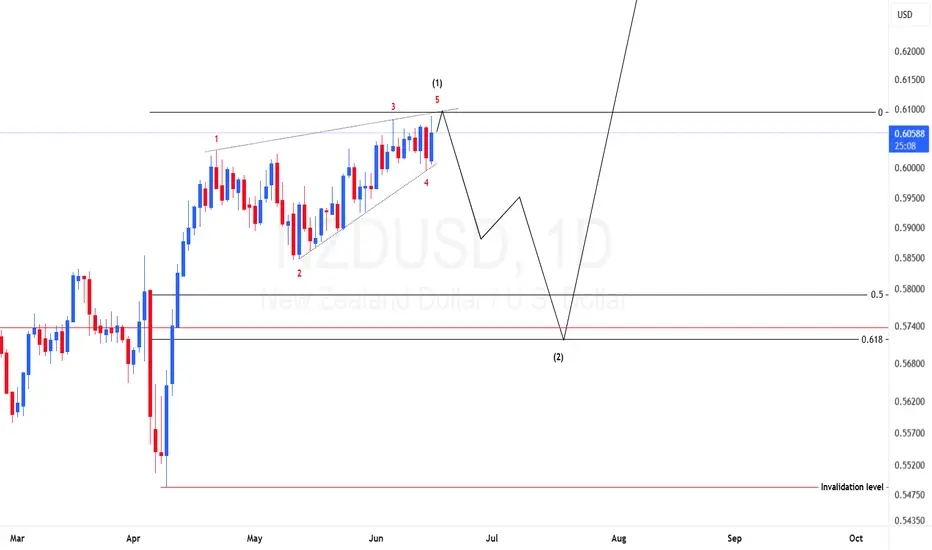
NZDUSD Elliotwaves CountPrice have unfolded the leading diagonal structure and we have seen signs of bullish weakness. If we are correct we should expect price to drop to at least the golden zone before resuming the bullish momentum.
XAUUSD Elliotwaves update: Is wave 4 complete?On our previous view we were expecting a wave c to the upside that will complete wave B of higher degree. It looks like wave B is completed with an ending diagonal. Now what I am anticipating is price to drop to complete wave 4 in higher degree. However, if wave 4 is complete then the move up might be a leading diagonal for wave 1 of 5. But all in all the the current bias is to the downside and therefore to take advantage of the move to the downside one should find areas where price will find resistance for a possible sell opportunity.

GOLD → Hunting for liquidity before continued growthFX:XAUUSD has been correcting since the start of the session. The fundamental background is complicated due to the escalation of the conflict in the Middle East.
The price of gold briefly retreated from a two-month high above $3,450 amid a recovery in the dollar and investor caution. Escalating tensions between Israel and Iran are dampening risk appetite, while markets await decisions from the Fed and the Bank of Japan. Expectations of a dovish Fed continue to support interest in gold, but fresh impetus is needed for further gains.
Technically, the market is bullish. Gold is forming a correction to the key support and liquidity zone amid an uptrend. The price is within the range, and a retest of 3400 could trigger growth.
Support levels: 3408, 3400
Resistance levels: 3446, 3500
A retest of support and liquidity capture amid the current challenging situation (high interest in the metal) and a bullish trend could support the price, allowing gold to continue its growth.
Best regards, R. Linda!

BITCOIN → Buyback bar. Chance of growth to 108,000BINANCE:BTCUSDT is trading in a fairly wide range of 100,600 - 110,400. The market is stagnating due to fundamental uncertainty, but the risks of a decline are quite high...
After the escalation of the conflict in the Middle East, Bitcoin broke the bullish structure on the market and managed to test the local level of 102500, from where a fairly aggressive phase of buying out the fall began within one trading session. The market is defending the structure quite aggressively. The chart shows a local range forming with strong levels at 102500 and 106200. Accordingly, the price may remain in this range for a long time (in which case an intraday trading strategy can be considered). However, if Bitcoin starts to stick to one of the boundaries, then we can consider the price leaving the range, but based on the structure of the uptrend, correction, and the formation of a buyback bar, it would be logical to see an attempt to break through resistance with the aim of continuing growth.
Resistance levels: 106200, 108200, 110400
Support levels: 102500, 100600
On D1, there are no prerequisites for a strong decline. The market is buying up knives and trying to stay afloat (in consolidation). In the medium term, there may be an attempt to retest 102500 - 100600 due to the liquidity pool. But locally, the market may form an attempt to grow to 108200
Best regards, R. Linda!

NZDUSD → Correction and liquidity capture ahead of growthFX:NZDUSD , following a sharp decline during the Pacific-Asian session, is testing the support of the upward trend and the liquidity zone...
The dollar is correcting amid escalating tensions in the Middle East. This is a temporary move, and the market may return to its main trend. The currency pair is forming a false breakdown of support
Against the backdrop of an uptrend and a weak dollar, the currency pair is testing support at 0.6000. The reaction is weak at the moment, but there is a chance for growth if the price consolidates above 0.6020. I do not rule out a retest of the liquidity zone at 0.5989 before growth
Support levels: 0.6000, 0.5989
Resistance levels: 0.6068
The inability to continue falling and the formation of a local reversal structure relative to 0.6000 (price consolidation above 0.6020) may support the market. I do not rule out that the market may decline to the liquidity zone of 0.5989 before rising.
Best regards, R. Linda!

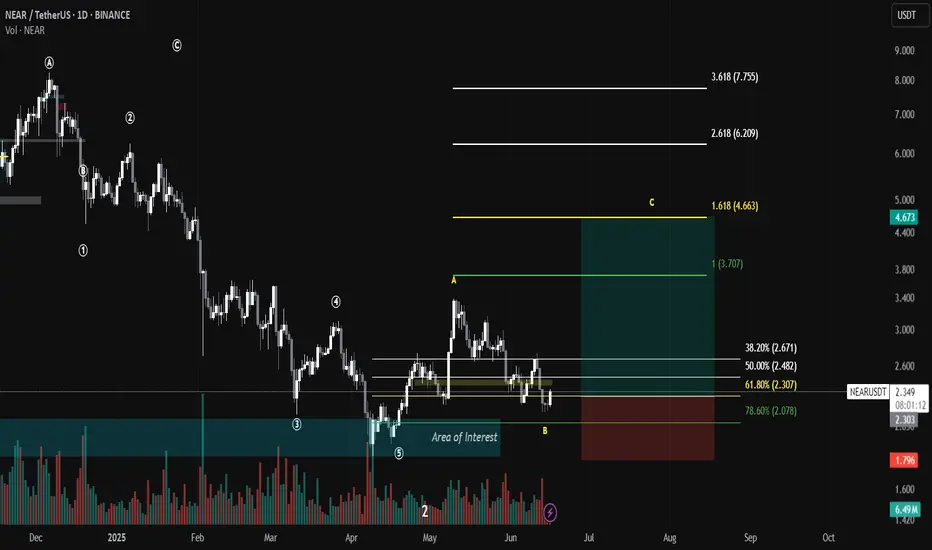
NEAR/USDT trade plan🧠 NEAR/USDT – Potential Wave C Setup (Elliott Wave + Fib Confluence)
📆 Timeframe: 1D | Exchange: BINANCE
🚀 Setup Overview:
We are likely entering a bullish Wave C based on the completion of an ABC corrective structure within a larger Elliott Wave pattern. The current price action has pulled back into a key "Area of Interest", aligning with multiple Fibonacci retracement levels, offering an attractive entry opportunity.
🎯 Entry Zone (Buy):
Between $2.30 – $2.35
This aligns with the 61.8% Fib retracement, a historically strong reversal level.
Also within the highlighted Area of Interest, marked by high volume and previous consolidation.
📉 Stop Loss (SL):
Set below the 78.6% retracement level: $2.07
A break below this level invalidates the ABC bullish setup.
📈 Target Zones for Wave C:
TP1: $3.70 (1.0 Fib Extension – Wave A equal to C)
TP2: $4.66 (1.618 Fib Extension – typical Wave C projection)
TP3 (Moonshot): $6.20 – $7.75 (2.618–3.618 extension for aggressive continuation)
GBPUSD BuyBuild up channel and also it is bearish. Price induced channel and should upward to take out liquidity.

At some point,......this thing has to go down, and technically, it still looks like this could be it. It's the monthly, so it could still go sideways for a while, but it looks like a completed channel before the breakdown.
