SOL (Weekly timeframe): Trend structure Price is approaching a key macro support zone. However, as long as it remains below the $148 level, I cannot rule out the possibility of one more corrective leg toward the $76–$55 range before a medium-term bottom is established and a potential resumption of the broader uptrend begins.
A breakout and sustained close above the $148 level would serve as the first technical signal that either:
- a corrective wave B (preceding a deeper correction toward the macro support zone) is unfolding, or
- a new long-term bullish trend aiming for all-time highs is beginning.
Monthly outlook:
My previous idea from November 2024 has fully realized its structure:
Thanks for reading and wishing you successful trading and investing decision!
Elliott Wave

$SSP Low volume on Wave 2, momentum risingFirstly, on the line chart is possible to watch the possible targets - blue lines - which one of it is almost as the same level as 2,618.
Fibonacci measured from the breakout to monthly resistance.
res M = monthly resistance
During the Wave 2, the two candles from last two days showed low volume as usual to happen during formation of W2, and it is possible to see that price at the breakout and after it was above average which can be read as high interest from buyers.
Confirming the volume, the EFI even though is decreasing still show strength,OBV follow the price trend but looks like buyers are entering again.
When it comes to momentum is possible to see that RSI did not crossed the equilibrium even after two bearish days, as ROC being a leading indicator which already changed direction . ADX is showing some strength for the trend direction confirmed by as DMI+ is still above DMI-
DTC = 1,36

GBPUSD Elliott Wave AnalysisHello friends
We are witnessing the formation of a complete Elliott wave pattern on the GBP USD chart. These waves from 1 to 5 are quite clear (of course, you can count them so that they become an ABC zigzag, isn't it interesting!) and you can even count their subwaves. Now wave 5 is completing and we are witnessing multiple divergences in wave 5. With the breakdown of the trend line drawn below and a pullback to it, we can expect the price to fall to the specified support. The first support is 1.305 and then 1.2800.
Good luck and be profitable.

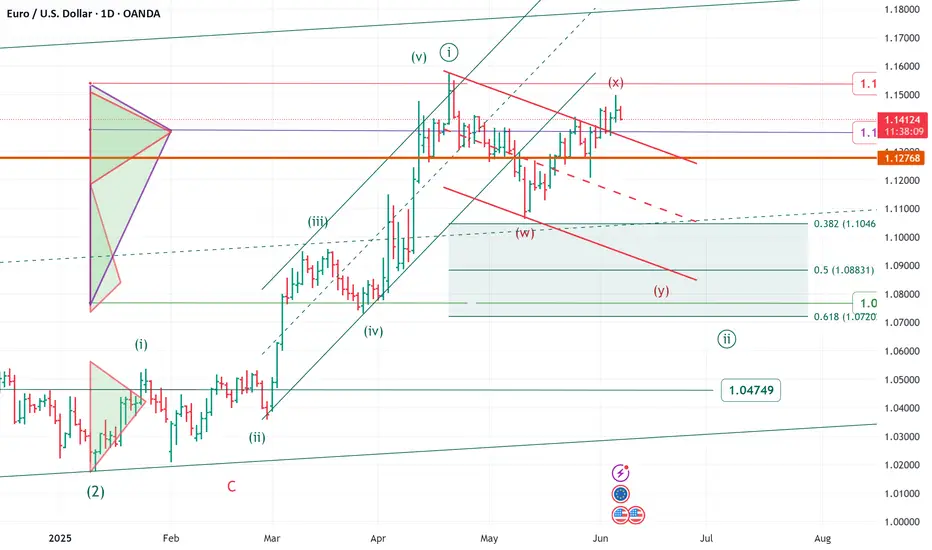
EURUSD topped? This Elliott wave count says YES!In our previous analysis, we were EURUSD bearish, and although we are trading about 2 cents higher now than when that analysis was published, we are still convinced that these high hills are shortable.
The pair, in our opinion, has finished a complete 5-wave Elliott formation earlier this week, and we prefer the short, with 2 targets that seem particularly interesting:
1. The flat correction target around 1.1065
2. The bottom of wave 4 of a lesser degree, at 1.0733, which is equal to, exactly & down to the pip, to the 61.8% retracement for the whole 5-wave sequence!
We will continue to be bearish for as long as 1.1704 is not clearly penetrated.
Whether the price penetrates 1.1704 & we give up, or, the market moves into our profit zone, we will post updates every week or so. Stay tuned!


GOLD → Geopolitical risks are driving gold prices up. To ATH?FX:XAUUSD is updating its interim highs as it retests resistance at 3435 amid escalating tensions in the Middle East. Economic risks are on the rise...
Gold rose 1.5% on Friday in Asian trading as investors sought refuge from escalating tensions between Israel and Iran. The price approached 7-week highs and could reach $3,500 if the conflict intensifies. The US and Israel have warned of serious consequences, while Iran has promised to respond. Geopolitics has overshadowed economic news, and markets are pricing in the possibility of a Fed rate cut in September.
Technically, the price is emerging from a local consolidation and testing a fairly important resistance level, forming a false breakout and correction. But this does not mean that the price will fall...
Resistance levels: 3425, 3435, 3461
Support levels: 3408, 3400, 3377
If gold consolidates above 3425 and continues to storm the resistance, growth may continue, and at the moment, there is a fairly high probability of a retest of the ATH. However, the ideal scenario would be a retest of the zone of interest 3408 - 3400 and the capture of liquidity before continuing growth.
Best regards, R. Linda!

NZDUSD Elliott Wave A nalysisHello friends
In the NZDUSD chart, we are witnessing the formation of a complete Elliott wave pattern. These waves from 1 to 5 are quite clear and you can even count its sub-waves. Now wave 5 is completing and we are seeing multiple divergences in wave 5.
With the break of the trend line drawn at the bottom and a pullback to it, we can expect the price to fall to the specified support.
The first support is 0.58500 and then 0.56800.
Good luck and be profitable.

TELEKOM MALAYSIA going to rm8based on research report by
2025-06-13 TM
TELEKOM MALAYSIA BHD
6.60 8.15 +1.55 (23.48%) BUY RHB-OSK
now retracing to 0.618
predicting that it will go for the third wave untul 1.618 at RM8

Safe-Haven Demand Boosts Gold as Middle East Tensions EscalateHey Traders,
In today’s trading session, we are monitoring XAUUSD for a buying opportunity around the 3,380 zone. Gold is currently trading in an uptrend and is experiencing a correction phase as it pulls back toward this key support and resistance area.
On the fundamental side, reports indicate that Israel struck Iran overnight — fueling a classic geopolitical risk-off sentiment. This escalation is driving strength in safe-haven assets while putting pressure on riskier markets. Gold typically benefits from this kind of uncertainty, adding further weight to the technical setup we’re seeing today.
Trade safe,
Joe

did EWT just TOP out??EWT made a fantastic move up, but on low volume
measured with old pumps we are nearing the Top
all goals are in the chart - my assumption is to go back to 1.18 USD, or lower
good luck trading, keep it safe

Tesla’s Flat Deception: Bearish Wave Y in the Making?Tesla’s price structure has taken traders on quite a journey, and after peeling back the layers, it's clear that both bullish and bearish possibilities demanded attention — but only one holds more weight for now.
The first sign of life came at the March low, where price made a lower low (218.13 to 214.25), but RSI formed a higher low. This classic bullish divergence paved the way for a strong rally, confirming that Wave W had likely ended with a sharp zigzag, and Wave X was beginning to unfold. The bounce from 214.25 extended into a flat structure, which completed near 367.71 — a textbook ABC flat with the internal wave b forming a higher low at 223.17.
Initially, this structure looked like the beginning of a bullish impulse. The drop to 273.22 perfectly tagged the 0.618 Fibonacci retracement, and it was tempting to label it as Wave 2 of a new impulse. However, that bullish view began to crack when the bounce from 273.22 appeared to be a three-wave move, not a clean five-wave impulse. More importantly, Wave 4 of this move overlapped the price of Wave 1 — a key violation that rules out a typical impulse and instead suggests the move was a leading diagonal.
This view is supported by the RSI, which revealed bearish divergence as price climbed from 350.00 to 367.71 — price made a higher high, but RSI made a lower high, indicating fading momentum. That divergence, combined with the overlapping structure, tilts the probability toward a bearish scenario now unfolding as Wave Y.
If this view plays out, the decline from 367.71 may be the start of Wave a of Y in a final zigzag correction. The projected path would take Tesla lower in a 5-3-5 structure, with potential support near or below the March lows. The bearish view remains valid as long as price stays below 367.71 — the clear invalidation point. A move above that level would force a reevaluation and potentially revive the bullish case.
At this point, the market has spoken — and it's whispering bearish. The structure favors caution unless bulls reclaim momentum with strength.
Disclaimer: This analysis is for educational purposes only and does not constitute investment advice. Please do your own research (DYOR) before making any trading decisions.

BTC: Elliot Cycle AnalysisA simple Elliot wave analysis of BTC's cycle. I predict we top out between 140-190k, before entering a bear market that will last ~12 months, likely ending early 2027. I can imagine that we form a massive H&S before we decline.
I believe the widespread adoption of crypto, BTC reserves, ETFs, etc. will serve as a bulwark against too harsh a winter. We perhaps drop to the 56k support, which would be an excellent buy-back opportunity.
Prepare to exit the market and remain tethered up for about a year or so. Don't get greedy. Things are gonna heat up real soon for the broader market.
Happy trading,
Melonfarmer

ai16z#AI16Z has dropped as expected into the buy zone, completing a clean 1-2 setup.
It now presents a golden chance for a strong rally, likely targeting a new ATH as the AI-Agents narrative gears up.
Key confirmation and invalidation levels are on the chart.
#ai16z

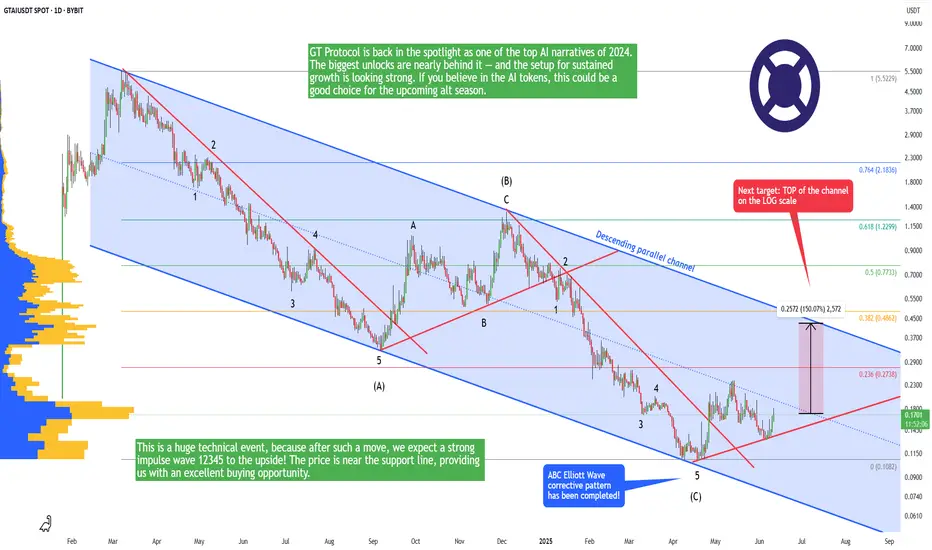
GTAI - Time to buy this altcoin! (bottom is in)GTAI (GT Protocol) is a relatively new altcoin that is listed on major exchanges. On CoinMarketCap, this altcoin has a rank of #1121, which means it has a lot of room to go to the upside. You probably don't want to buy some famous altcoins in the TOP section because there is no 100x potential anymore. But if you want a reliable but small profit, then you can go with BTC or other major altcoins.
GT Protocol is back in the spotlight as one of the top AI narratives of 2024. The biggest unlocks are nearly behind it — and the setup for sustained growth is looking strong. If you believe in the AI tokens, this could be a good choice for the upcoming alt season.
From a technical point of view, this altcoin just completed a major ABC corrective wave on the weekly timeframe. This is a huge technical event, because after such a move, we expect a strong impulse wave 12345 to the upside! Currently, the price has been trending in this blue descending parallel channel. The price is near the support line, providing us with an excellent buying opportunity.
I expect GTAI to go up in the immediate short term and mid-term because the price should retest the downward-sloping trendline of the channel. Now it's up to you if you take a 150% profit or hold for the long term! Let me know in the comment section what you think about this altcoin? Trading is not hard if you have a good coach! This is not a trade setup, as there is no stop-loss or profit target. I share my trades privately. Thank you, and I wish you successful trades!
S&P 500 Breaks Out — Trump, Tariffs & Bullish Island PatternDonald Trump has mentioned the US stock market in every meeting he has held in the past few days, which has caused the US stock market indices , including the S&P500 Index ( SP:SPX ), to rise:
"Better go out and buy stocks now".
President Donald Trump told a crowd in Saudi Arabia on Tuesday that the markets are just getting started. “It’s going to get a lot higher,” he said, right as the S&P 500 posted its first gain since late February.
But one of the main reasons for the increase in the S&P 500 Index and US stocks is The United States has dropped its tariffs on Chinese goods to 30% , down from a brutal 145% , while China is slashing its own duties on US imports to just 10% , temporarily, for the next 90 days .
-------------------------------------------------
Now let's take a look at the S&P 500 Index chart on the daily time frame .
S&P500 Index managed to break the Resistance zone($5,737_$5,506) and 21_SMA(Weekly) by Breakaway Gap .
In terms of Classic Technical Analysis , the S&P500 Index has managed to form a Bullish Long Island Pattern , and this pattern is one of the continuing patterns and will be a sign of the continuation of the S&P500 Index's upward trend .
In terms of Elliott Wave theory , it seems that the S&P500 index has completed the corrective wave and is in new impulsive waves , which could cause a new All-Time High(ATH) to form.
I expect the S&P500 index to increase by at least +5% as it approaches the Uptrend line , and we will see the possibility of a new ATH .
Please respect each other's ideas and express them politely if you agree or disagree.
S&P 500 Index Analyze (SPX500USD), Daily time frame.
Be sure to follow the updated ideas.
Do not forget to put a Stop loss for your positions (For every position you want to open).
Please follow your strategy and updates; this is just my Idea, and I will gladly see your ideas in this post.
Please do not forget the ✅' like '✅ button 🙏😊 & Share it with your friends; thanks, and Trade safe.

Gold Correction = Bearish Divergence + Wedge + Zigzag CompleteGold ( OANDA:XAUUSD ) attacked the Resistance zone($3,387-$3,357) today after the release of the US CPI indices . Although the figures seemed to be in gold's favor, traders still seem to be determined to continue the price correction.
In terms of Elliott Wave theory , it seems that Gold has managed to complete the Zigzag Correction. We should wait for the next 5 down waves .
Also, we can see the Regular Divergence(RD-) between Consecutive Peaks .
In terms of Classic Technical Analysis , Gold appears to have successfully formed a Rising Wedge Pattern .
I expect Gold to drop to at least $3,296 AFTER breaking the lower line of the Rising Wedge Pattern .
Note: Stop Loss(SL)= $3,380
Gold Analyze ( XAUUSD ), 1-hour time frame.
Be sure to follow the updated ideas.
Do not forget to put a Stop loss for your positions (For every position you want to open).
Please follow your strategy; this is just my idea, and I will gladly see your ideas in this post.
Please do not forget the ✅' like '✅ button 🙏😊 & Share it with your friends; thanks, and Trade safe.

USDCAD Hits Support as Fed-Hawkish & BoC Cuts! Big Bounce ComingUSDCAD ( OANDA:USDCAD ) is trading at the Potential Reversal Zone(PRZ) and near the important Support line and Support lines .
In terms of Elliott Wave theory , it seems that USDCAD has managed to complete 5 main down waves and we can expect more up waves .
Also, we can see the Regular Divergence(RD+) between Consecutive Valleys .
I expect USDCAD to rise to at least 1.37860 CAD.
Fundamental View:
The Bank of Canada initiated its rate-cutting cycle , while the Federal Reserve remains firm with no immediate plans to ease.
Strong NFP data on Friday reinforced USD ( TVC:DXY ) strength .
Oil prices( BLACKBULL:BRENT ) may offer temporary support to CAD , but macro divergences clearly favor the dollar .
Note: Stop Loss(SL)= 1.36110 CAD
U.S Dollar/Canadian Dollar Analyze (USDCAD), 4-hour time frame.
Be sure to follow the updated ideas.
Do not forget to put a Stop loss for your positions (For every position you want to open).
Please follow your strategy; this is just my idea, and I will gladly see your ideas in this post.
Please do not forget the ✅' like '✅ button 🙏😊 & Share it with your friends; thanks, and Trade safe.

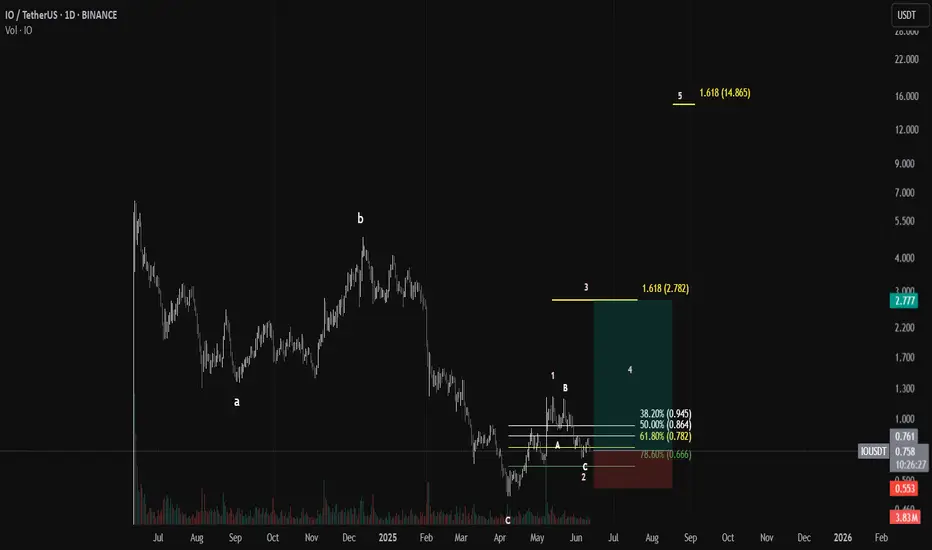
Io trade planIO/USDT Long Trade Setup | Daily Timeframe
📉 Structure: ABC Correction Completed
🚀 Elliott Wave Count: Wave 1 and 2 completed — potential Wave 3 breakout incoming
🔹 Entry Zone: 0.750 – 0.770 USDT
🔻 Stop-Loss: 0.666 USDT (below 78.6% Fib retracement)
🎯 Target 1 (Wave 3): 2.782 USDT (1.618 extension of Wave 1)
🎯 Target 2 (Wave 5): 14.865 USDT (1.618 extension from Wave 3
Gold (XAUUSD) Eyes 3,330 Zone as Safe-Haven Demand Builds!!Hey Traders, In today’s trading session, we’re keeping a close watch on XAUUSD for a potential buying opportunity around the 3,330 zone. Gold continues to trade within a strong uptrend, and is currently undergoing a healthy correction, bringing it near a key support/resistance level that could act as a springboard for the next leg higher.
From a fundamental perspective, rising geopolitical tensions in the Middle East have led to the evacuation of diplomatic personnel and increasing concerns of potential military escalation. As uncertainty grows, safe-haven assets like gold tend to attract stronger demand from investors seeking protection against volatility and risk.
If the situation deteriorates further, we could see a surge in gold prices as market participants hedge against geopolitical instability.
Trade safe,
Joe

Crude Oil Eyes 65.40 Support Amid Middle East Uncertainty!!Hey Traders,
In today’s trading session, we’re closely monitoring USOIL for a potential buying opportunity around the 65.40 zone. The commodity remains in an overall uptrend, and is currently undergoing a corrective phase, approaching a key support/resistance area near 65.40. This level aligns well with the broader trend structure and may offer a favorable risk-to-reward setup.
On the fundamental side, geopolitical tensions are on the rise. Reports indicate that U.S. embassy personnel are being evacuated from parts of the Middle East amid growing regional instability. Allegedly, Israel is preparing for potential military action against Iran should nuclear deal talks collapse.
If these tensions escalate further into military conflict, oil prices could spike in response to the heightened risk to regional supply chains.
Trade safe,
Joe


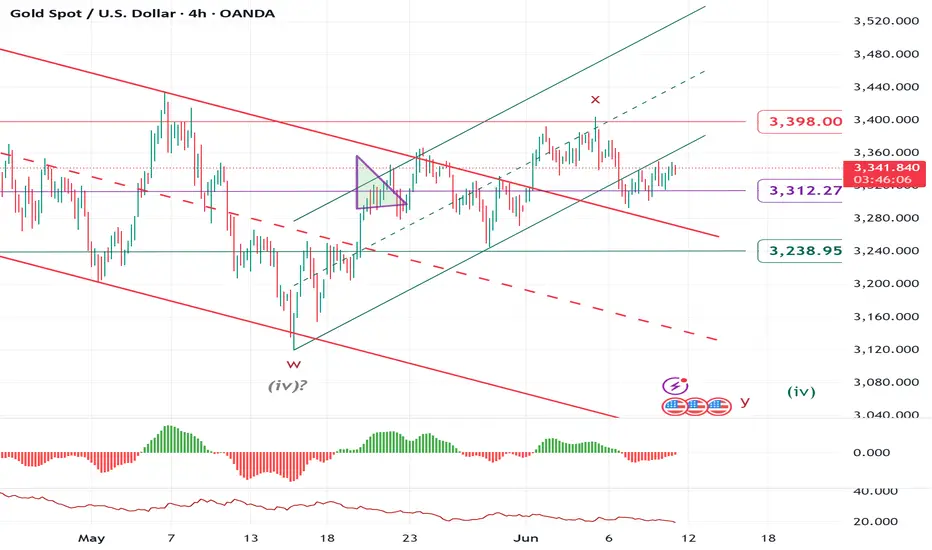
ELLIOTT WAVE XAUUSD H4 update
EW Trade Set Up H4
subminuette wave (iv):
downward price movement from 22 april high at 3500 area looks a sideway correction unless an impulsive movement start breaking up 3350 level first and then 3400 level shortly.
key levels (area)
3400
3350
3312 POC
3290
3240
Elliott wave daily EURUSD update
Elliott wave daily EURUSD update
The price movement of the last few weeks requires a change
and update of the wave count
______________________________________
upward movement from area 1.018/genuary 2025 to area 1.1580/april 2025
looks impulsive - minute wave ((i)).
we are now in a corrective minute wave ((ii))
zigzag or flat or any double
target area 1.1040/1.0800 area
in the very short term level to monitor 1.1500 area
over 1.1500 area a flat correction more likely ( to area 1.1570)
note
FX option expiries for 6 June 10am New York cut
1.1500 (EUR 3.19bn)
1.1400 (EUR 2.38bn)
1.1300 (EUR 1.28bn)
FOREXLIVE