GOLD → Risk zone 3340. Sell-off after rallyFX:XAUUSD , after breaking out of its accumulation phase, rallied towards the 3400 zone of interest, but failed to reach liquidity and reversed, selling off its gains due to economic uncertainty.
In my opinion, the market is unexpectedly subdued and has reacted very weakly to geopolitical problems in the Middle East. The market has digested the news of US airstrikes on Iranian nuclear facilities and is awaiting PMI data from the US and the eurozone, Fed statements, US GDP and other macroeconomic data. The uncertainty factor has done its job... Participants fear further escalation of the conflict, but so far Iran has refrained from taking drastic steps, which has reduced demand for gold as a safe haven asset. Geopolitics and macro statistics remain in focus.
Technically, gold is trading above 3340 (in the buy zone). A retest of the liquidity zone is possible, and if buyers keep the market above 3340-3350, the price may continue to rise.
Support levels: 3347, 3342, 3320
Resistance levels: 3366, 3396
On D1, the key level is the 3340-3347 area. At the moment, we are seeing a sell-off and a move to retest support. Accordingly, a false breakdown and price holding above 3340, followed by a change in character and a breakdown of the bullish structure, will hint at growth. But if the reaction at 3340 is weak and the market continues to storm this support, then in this case, the metal could drop to 3300
Best regards, R. Linda!
Elliott Wave

ADAUSDT → Bear market. Support breakdownBINANCE:ADAUSDT.P is in the distribution phase after exiting consolidation. The coin continues to update local lows within a downtrend.
Technically, the cryptocurrency market is in stagnation/correction, as there is no bullish driver yet. Bitcoin is currently consolidating but continues to shoot local downward impulses, which generally has a negative impact on coins.
ADA is entering a distribution phase of accumulation formed in the range of 0.62 - 0.71. If the bears keep the price below 0.62-0.6, ADA may well test the intermediate bottom of 0.5364-0.51
Resistance levels: 0.61, 0.62
Support levels: 0.5993, 0.5364
Focus on 0.61 and the local level of 0.5993. Price consolidation below this zone could confirm the bearish nature of the market, which could lead to another decline.
Best regards, R. Linda!

USDCAD-Expecting a PB to 1.42 and then HUGE FALL !!!DISCLAIMER : All labelling and wave counts done by me by manually and i will keep change according to the LIVE MARKET PRICE ACTION. So don't bias, hope on my trade plans...try to learn and make your own strategy...Following is not that much easy...I AM NOT RESPONSIBLE FOR ANY LOSSES IF U TOOK THE TRADE ACCORDING TO MY TRADE PLANS....THANKS LOT..CHEERS

₿itcoin: PullbackBitcoin has experienced significant selling since Friday, briefly slipping below the $100,000 mark. We previously mentioned that a sharper pullback wouldn't surprise us. Whether prices will drop a bit further remains to be seen for the moment. Ultimately, we still expect Bitcoin to climb into the upper blue Target Zone (coordinates: $117,553 – $130,891) before a broader C-wave sell-off occurs, pushing the price down to the lower blue Target Zone (coordinates: $62,395 – $51,323). There, we anticipate the low of the larger orange wave a, which should mark the start of another corrective upward move. Afterward, we're preparing for the last downward leg of blue wave (ii). However, if Bitcoin directly surpasses the resistance at $130,891 – and thus our upper blue Target Zone – we'll locate it still in blue wave alt.(i) (30% probability).
📈 Over 190 precise analyses, clear entry points, and defined Target Zones - that's what we do.

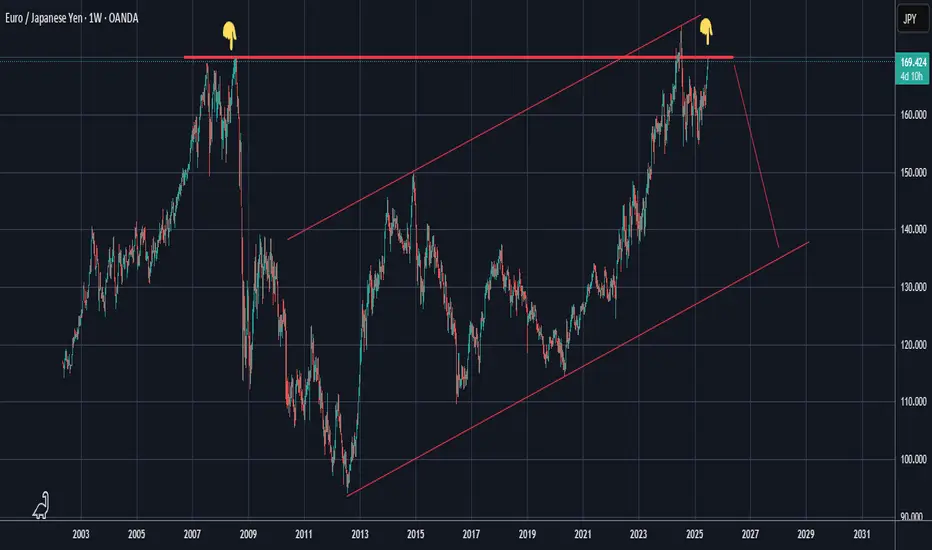
USDJPYLooking at this chart after I just did the EURJPY analysis, now this one looks more bullish than bearish BUT that's only if there is a breakout from the supply zone which Im assuming will give us a consolidation first before it shoots straight up to complete Wave 5. At the completion of Wave 5, we can expect the drop again as a correction and retest, which should usher in more buyers to form a Cup and Holder pattern. I really see the JPY being stronger than USD futuristically and practically.

BNB Double Correction Hits Extreme ZoneBINANCE:BNBUSD has now entered the Blue Box buying area, signaling the final phase of the correction. A weekly reversal confirmation is the next key step — once that’s in place, the bounce phase is expected to begin.

Injective Enters the Daily Bouncing AreaCRYPTO:INJUSD has tapped into the equal legs zone at $9.99–$8.97, a key Fibonacci-based support area where buyers may begin to step in. This zone often acts as a magnet for a reaction higher, especially if the broader structure supports a bullish reversal.
In the coming weeks, watch for confirmation signals — a strong bounce from this zone could kick off the next leg up.

EURJPYI saw an analysis on this pair and tried to get something like an early entry on it, but I noticed there's a lot going on on the smaller timeframes so I went to bigger and found some interesting facts like how the current price is at the area of previously strong supply zone/resistance zone. Which therefore imposes that we should see sellers coming in strong at any time now as we are in the sellers club, but this needs further confirmations from your side, what do you think?
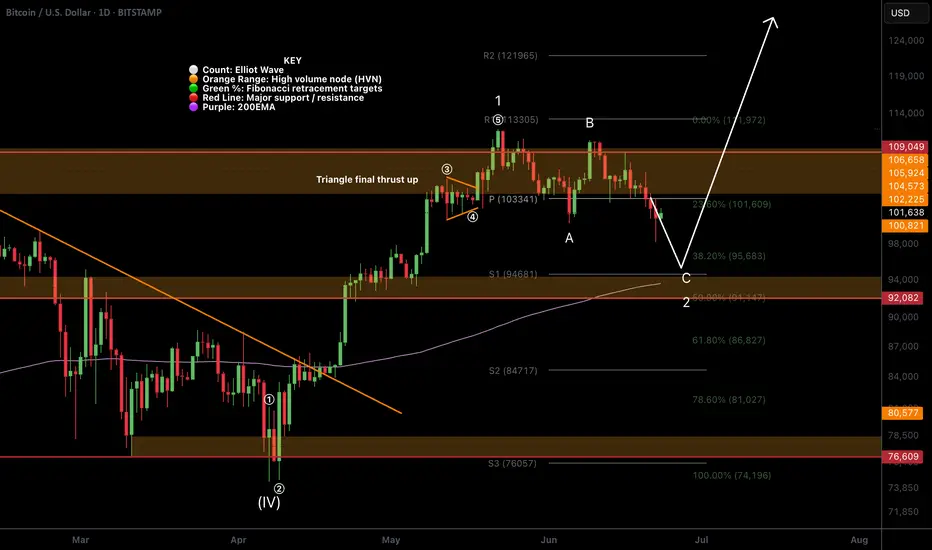
BTC Textbook Elliot Waves!CRYPTOCAP:BTC local analysis hasn't changed in a few weeks.
Price printed another text book Elliot motif wave, with the wave 4 triangle terminal pattern ending in the usual thrust up with a poke above all time high.
Price is also printing a textbook ABC for wave 2 with 5 waves down for A, 3 waves up for B and a strong wave C down to finish. Wave C's are always the strongest.
Pattern suggests price has one more push lower to complete this corrective wave tapping the quadruple support: S1 daily pivot, ascending daily 200EMA, major support High Volume Node (HVN) and 0.5 Fibonacci retracement at 92-94k range.
Most investors are publicly calling for buys in this area so price may be front run by the whales! The consensus often do not get what they want.
Safe trading
AAVE Standing out among the alt coins!CRYPTOCAP:AAVE is looking stronger than most for now. Local analysis has broken the bullish market structure on what appears to be a textbook Elliot Wave 1.
Price is testing quadruple support: Daily 200EMA, daily pivot, major support High Volume Node (HVN) and the 0.382-0.5 Fib retracements. This should be a tough nut to crack (as long as CRYPTOCAP:BTC doesn't dump hard).
Wave 2 retracement's are usually deep and come with a strong fear. It is where most retail investors capitulate only to find price turns around and continues bullishly without them in a aggressive wave 3.
Analysis is invalidated below $111, so quite a ways off yet.
If war escalation continue, irrational investor behaviour will likely break this technical analysis.
Safe trading.

Nifty directions and levels for June 23Good morning, Friends! 🌞
Here are the market directions and levels for June 23:
Market Overview
The global market is showing signs of consolidation with some cautious sentiment, and our local market is also reflecting the same.
However, Gift Nifty is indicating a 130-point negative start.
So, what can we expect today?
The structures in the higher degree timeframes are slightly different from one another, so we can't take any firm decision in advance.
However, my expectation is that the market may close with a negative bias today.
Let’s look at the chart for more clarity.
On the 15-minute chart, both Nifty and Bank Nifty appear to be showing a similar structure.
Current View
The current view suggests that if the market sustains the initial gap-down and consolidates, we can expect the correction to continue.
In this case, even if there is a solid pullback, the market may not move much higher.
This would mean it could consolidate between the previous day’s high and the upcoming low.
Alternate View
The alternate view suggests that if the market takes a pullback initially, it may consolidate within the previous day's range.
If it breaks the previous high after that, we can expect further rally continuation, possibly in a diagonal pattern.

#Banknifty directions and levels for June 23:Current View
The current view suggests that if the market sustains the initial gap-down and consolidates, we can expect the correction to continue.
In this case, even if there is a solid pullback, the market may not move much higher.
This would mean it could consolidate between the previous day’s high and the upcoming low.
Alternate View
The alternate view suggests that if the market takes a pullback initially, it may consolidate within the previous day's range.
If it breaks the previous high after that, we can expect further rally continuation, possibly in a diagonal pattern.

AppleNo change in regard to my Apple analysis. I am still waiting for price to either break down to the target box or head straight to the upper target box from here. I think given the current price action we have a higher probability of moving lower first, but the fact remains it is not required. This week will hopefully bring some needed clarity. Regardless of what happens, I believe we're within minor B. It is only a matter of what pathway price takes to get to its end destination.

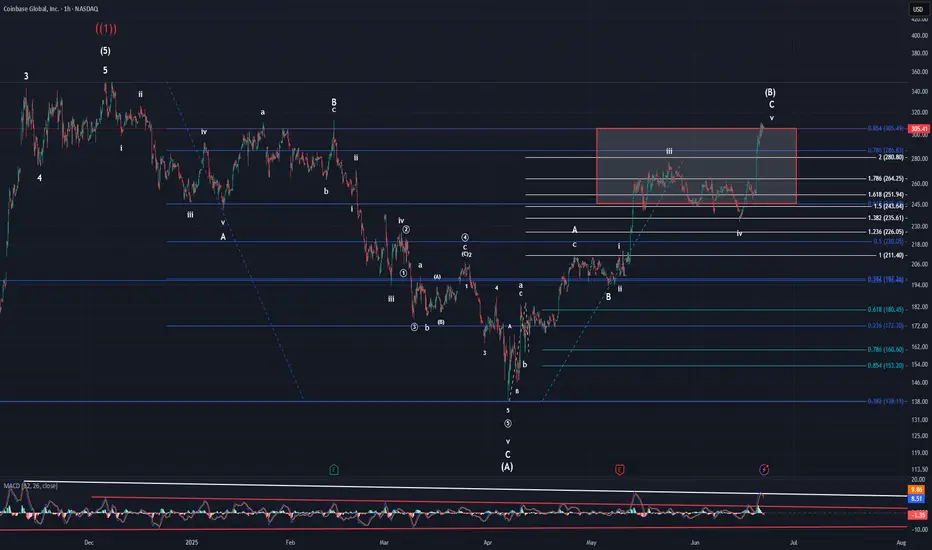
CoinbasePrice technically speaking has a full 5 waves with this latest move higher off the $240 low. I don't believe the micro-waves 4 & 5 are done yet though. MACD has reversed and looks to be heading down now, so I think that wave 4 will be kicking off starting Monday. Technically speaking, thus pattern could be complete, but my gut tells me that it is not. It is already overextended as it has breached the 0.854, but I still believe this is intermediate (B) due to the preceding price action.
In short, my primary is we get a slight move lower for 4 and then another slight high for 5 of v of C of (B). The ALT is that we head lower from here kicking off (C).
GOLD 4H target and 1H target 1TP / 3.340 Dollars
2TP / 3.120 Dollars
Gold for sell now with 2 targets

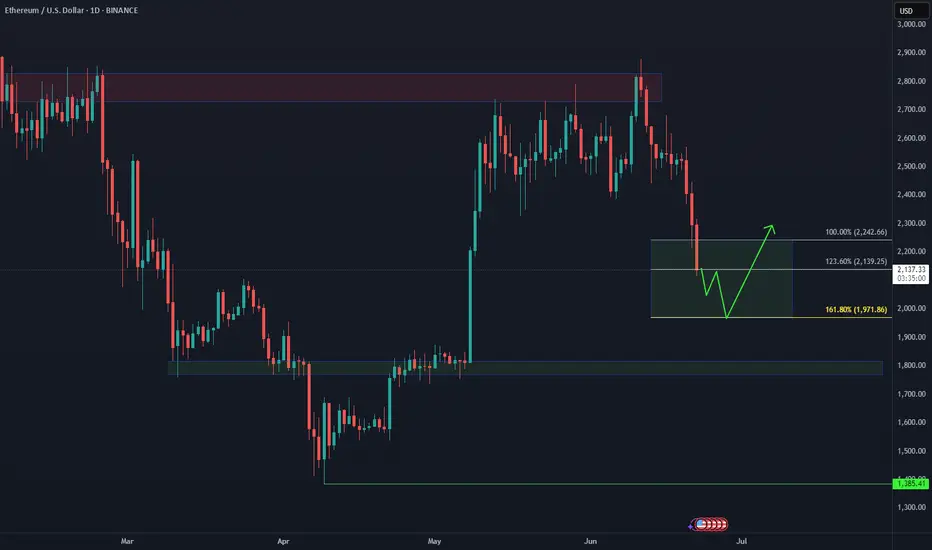
Ethereum: How Deep Into the Buying Area?📉 CRYPTO:ETHUSD is currently testing the extreme buying zone $2140–$1970 — a key area where a bullish reaction is anticipated. But if the bounce fails to materialize next week, eyes shift to the next potential demand zone near $1800.
This level aligns with prior structure and could offer a stronger base for the next leg higher — as long as the broader structure remains intact.
USDT Dominance Update (2H)The USDT Dominance (USDT.D) chart — often referred to as the “reverse chart of crypto” — is currently showing signs of strength. On the micro time frame, a new impulsive wave structure has emerged, and we are likely progressing through wave 3 of this formation.
Wave 3 appears to be targeting the 4.88% level.
A minor correction (wave 4) may follow.
Ultimately, wave 5 is projected to reach the 5.00% zone.
Market Implications:
If this scenario unfolds as expected:
Bitcoin could down toward the $100,000–$101,000 range.
However, altcoins may face a sharp correction, with potential losses of 15–20%, exacerbated by the rising BTC dominance and capital flow concentration.
⚠️ While macro bullish momentum remains intact for the market, this short-term USDT.D surge could present a temporary but significant shakeout, especially across the altcoin sector.
— Thanks for reading.

Gold Technical ✅ Entry Level (Long Position):
Ideal entry zone: Between $3,360 – $3,370
This is near the Wave (4) low and just above the ascending channel support line.
Also aligns with the 23.6% Fibonacci retracement level, where price has shown signs of support.
---
🎯 Take Profit (Exit Levels):
These targets are based on Fibonacci extensions and the upper boundary of the channel:
1. TP1: $3,400 (50.0% Fib level) – conservative target, aligns with minor resistance.
2. TP2: $3,415 (61.8% Fib level) – key Fibonacci golden ratio and likely Wave (5) area.
3. TP3: $3,435–$3,440 (upper channel line) – aggressive target, aligns with 100% extension and projected Wave (5) peak.

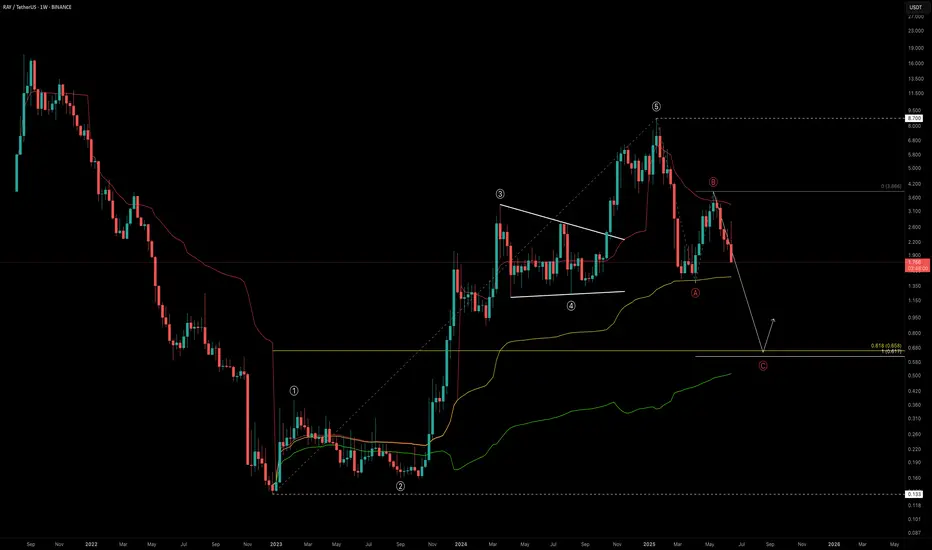
RAY Outlook: Is a -60% Drop the Reset We Need?RAY marked its bottom in December 2022 at just $0.133, entering a prolonged accumulation phase that lasted nearly a year. Then, in late 2023, it broke out into an explosive bull run, skyrocketing +6421% over 756 days and peaking at an impressive $8.70.
This run completed a full five-wave Elliott Wave structure. After topping out, RAY dropped -84% down to $1.388 — likely marking the Wave A correction. A strong relief rally followed into the $4 region before facing rejection at the yearly VWAP, possibly completing Wave B. Now, all signs point toward us being in the final Wave C of the larger corrective structure.
So, where could Wave C bottom out?
🔍 Fibonacci Confluence Zones (Log Scale)
Let’s assess the key levels with log-scaled Fibonacci tools:
🔹 Fib Retracement (from $0.133 low to $8.7 high):
The 0.618 fib retracement lies at $0.658
🔹 Trend-Based Fib Extension (Wave A → B projection for Wave C):
1.0 TBFE sits at $0.617
✅ These two levels align nearly perfectly, giving us a strong confluence zone between $0.62 and $0.66
Additional Confluences
Anchored VWAP Bands:
The 0.618 VWAP band multiplier also aligns with this $0.6 zone
Liquidity Perspective:
This level would wipe out long positions built over the past 550 days — clearing and potentially resetting the market
🚨 Fair Value Trend Model (FV Trend Model):
According to my Fair Value Trend Model indicator, the fair value for RAY currently sits around $0.78 — right in line with the broader confluence zone. This model uses log-log regression to estimate Bitcoin’s and other assets’ fair-value over time.
👉 Feel free to use the indicator
Just head over to my profile, click on the “Scripts” tab, and you can add the Fair Value Trend Model to your charts to experiment with it yourself.
Together, these technical elements form a compelling high-probability zone for long setups around $0.6–$0.8.
💡 Educational Insight — Why 0.618 is a Critical Fib Level
In Elliott Wave theory and harmonic trading, the 0.618 retracement is known as the "Golden Ratio" — often serving as a magnet for price during corrections. When paired with a 1.0 trend-based fib extension, it can mark exhaustion zones where Wave C concludes.
🔭 Summary: What’s Next for RAY?
Potential bottom zone: $0.61–$0.78
Watch for reversal signals like bullish candlestick patterns, volume spikes, or divergences
A drop to this zone would represent a -60% drawdown from current levels
Remember: High-probability setups don’t come every day — patience is your edge
Set alerts. Stay prepared.
_________________________________
💬 If you found this helpful, drop a like and comment!
Want breakdowns of other charts? Leave your requests below.
Bitcoin Short: Wave CAfter a 6-days move up after we have hit our target in the previous analysis, I think Bitcoin has completed what I think to be the Wave B and is already on the Wave C run down.
Over in this video, I expressed my personal viewpoint that Bitcoin is not a hedge against the dollar and that it is actually a risk-on/off product more similar to the equities markets like the S&P500. I recommend that anyone who is interested to perform a study on the correlation and beta Bitcoin.
I suggested that the reason why it more closely related to the equity markets is due to it's deep integration within the financial sector (e.g. ETFs, structured products from banks).
Given that I think that the equity markets are primed to crash soon, I think that Bitcoin will follow suit.
Good luck!

S&P500 Update: Break of Lower TrendlineIn this video, I updated the wave count for S&P500 and discussed 2 different ways of counting it but ended with a bias on a stronger wave 3 down as opposed to a wave 5 of 1 down.
The stop loss is above 6016, with 2 take profit targets:
1) 5940
2) 5923
Good luck!

Do you wanna see the bigger picture? (USDT.D Analysis 12H)After counting many waves for many days, I have a senario for USDT dominance which will lead the entire market on its way.
For those whose not fimiliar with this parameter, there is a very simple explanation.
It's the reversed way to see the market. If this parameter drops, your alts will skyrocket and if it rises, you're gonna be crying on somebody's X post's comments.
First of all, the short term wiev is bearish. We are currently in an impulsive wave 3 which is expected to be hardest for altcoins at the moment. There will be crash unless the value of this parameter drops below %4.50 and invalidates the analysis (you'll like this senario better, trust me).
All right, we got rid of the scalpers who bothered to read this far and now I'm here to explain what I see for the golden future.
Currently, USDT.D is forming a BEARISH impulsive wave for higher time frames. As long as you stick with 4H candles, you won't be able to see it.
USDT.D is trying to forming its bearish flag, by doing so it will be its second wave and will prepare its very own collapse.
Last summer, BTC has done the same thing (Check for daily time BTC).
There is more.
If we calculate the depth of this incoming flag pattern, breaking this flag would lead USDT to %3.75 which is the yearly support (Check in weekly, you'll see it).
If we calculate the time needed to past for this flag to work, it's the same amount of time needed for previous flag to break from last summer.
We also need to add fundementals in it. Currently people started to talk about a senario which will lead world to WW3. I don't think that will happen. But the problem in here is it will market throguh downside.
Furthermore, there is FED.
FED is insisting to leave interest rates on its own without a change. I believe that we won't be seeing any rate cuts till the end of this summer.
I believe that the FED will cute rates between Agust and September. This will be the fuel for our rocket to fly and ignite the wave 3.
I know it's a long script but you know it's necessary.
Thanks for reading.

USDJPY: Ready for Wave 5?USDJPY is showing a strong bullish wave structure, with a clear path toward higher levels based on Elliott Wave Theory. After a successful breakout from a multi-year consolidation, price action appears to be completing a Wave (4) correction thereby setting the stage for a Wave (5) rally.
Based on the bullish structure and projected continuation:
1st Target = 157.78
2nd Target = 177.41
Final Target = 209.16 Full wave extension, top of macro channel
With support holding above ¥140.00 and a bullish bounce forming, this could mark the Wave C bottom of (4), setting the stage for the next major leg up.
Disclaimer:
This analysis is for informational and educational purposes only and does not constitute financial advice. Markets are dynamic and unpredictable.
