Gold Futures – Double Top Leads to Bearish SetupGold Futures on the MCX chart is showing a classic Elliott Wave pattern in play. After forming a regular flat correction with a double top near the 99,300–99,200 zone, prices have started to drift lower. The double top structure—combined with the completion of Wave B—suggests that a Wave C decline is underway.
Wave A took the price down to around 90,890, followed by a corrective Wave B that failed to break the previous high convincingly.
The near-term outlook on the 4-hour timeframe remains bearish. I am anticipating five waves down within Wave C, which may take price back toward the previous Wave A low or slightly lower, possibly ending in a diagonal pattern, before a bullish reversal can be expected.
Disclaimer: This analysis is for educational purposes only and does not constitute investment advice. Please do your own research (DYOR) before making any trading decisions.
Elliott Wave

AERODROME About to Defy Gravity? One Final Obstacle!Yello Paradisers — did you catch this developing setup in real-time on #AERO? After calling the completion of the higher-degree Elliott Wave 1 structure followed by an ABC correction, the chart is now flashing a high-probability opportunity — but only if a key resistance gets flipped in the coming sessions.
💎#AEROUSDT appears to have just wrapped up with point C printing a strong bounce from the R/S level, a zone that previously acted as a powerful base during the earlier markup phase.
💎The impulsive 5-wave structure clearly marked the first leg of strength, topping out perfectly in confluence with standard wave theory. What followed was a clean and controlled ABC correction.
💎Price action is currently pressing up against a well-defined resistance, which is not just horizontal but also perfectly aligned with the dynamic MTF EMAs — creating a confluence rejection zone. These moving averages have been compressing into the structure, adding weight to this level as a final barrier before a breakout scenario can unfold.
💎What we are now watching is simple: if we get a confirmed candle closing above the current resistance range, it would be a textbook continuation signal. That close would signal a probable structural shift — a break away from the corrective phase and the beginning of a new leg toward higher resistance levels around the 0.754 to 0.792 zone.
💎Until then, caution is critical. Any weakness or failure to close above resistance would imply the pair is not ready yet. Worse, a candle closing below the 0.446 invalidation level will confirm that the bulls are not yet in control and a deeper move is likely before a real reversal emerges.
💎This setup is not one to force — but it's certainly one to track closely. Everything is aligned for a breakout, but we do not front-run resistance in uncertain zones. That’s where most get chopped up. Confirmation is key, and when the market gives it, we act with full conviction.
This is exactly how Paradisers operate. We wait. We confirm. We execute only when all pieces align. No guessing, no emotional decisions — just disciplined, high-probability trading.
MyCryptoParadise
iFeel the success🌴

Bitcoin Rally is almost over! Btc has been performing as expected and now, I expect it to reach either till the upper channel, which is clearly a reversal pattern) or beyond it to the Fib 100 to complete the 5th wave. This is a high probability setup considering the market conditions.
So before the rally stops, is gonna make a new high.
Any feedback is appreciated! :)
BITSTAMP:BTCUSD

BANKNIFTY is moving towards 59000The monthly Cash Data chart is forming a diametric pattern. Waves (a) through (f) have completed and we are currently in the middle of wave (g) of the diametric pattern.
This wave is moving towards 59,000

ADA(based on NEowave)this branch of Cardano is diamond diametrical but I didnt count the other branches and the larger degrees but based on ETH and other Altcoins I think it will pump soon.

ChainLink LINK gearing up for a move back toward $20CRYPTO:LINKUSD found strong buyers in the $14 - $12 equal legs zone after a three #elliottwave pullback, setting the stage for the next upside push.
Momentum is shifting—are you ready for the breakout?

NZDUSD Potential UpsidesHey Traders, in today's trading session we are monitoring NZDUSD for a buying opportunity around 0.60350 zone, NZDUSD is trading in an uptrend and currently is in a correction phase in which it is approaching the trend at 0.60350 support and resistance area.
Trade safe, Joe.

Red Lights for SOLANASolana has recently completed its 5-wave impulsive rise, and now a correction phase appears to be underway. Notably, a diamond top formation has formed and already broken to the downside, further supporting the short-term bearish outlook.
As long as SOL trades below the $180 resistance, this corrective scenario remains valid.
I currently do not expect a drop below the $146 support zone, making this a structured micro pullback within a larger bullish macro trend.
This setup offers opportunities for both short-term short and long entries, depending on how the price reacts near key levels. While the macro structure and fundamentals remain highly bullish for Solana, this correction could provide an ideal re-entry point before the next major leg up.
— Thanks for reading.

EURUSD_1DEurodollar Analysis
Daily Time Frame Medium and Long Term
Elliott Wave Analysis Style
The market is in 5 waves of ascent, which is expected to be in wave 5, which can move towards the target of 1.1717 by maintaining the price above 1.1280 and after completing 5 Elliott waves, enter a decline towards 1.0660
Important short-term number and for this week 1.1414

Doge(based on NEowave)like ETH wave E is ending and soon it will start a huge bullish wave.
wave E look likes a bow-tie diametrical and wave g is at the end which is the last chance to buy.

S&P 500 Short Update: Ending DiagonalEnding diagonals completed. Stop above 6040. Take profit at 5744 first.

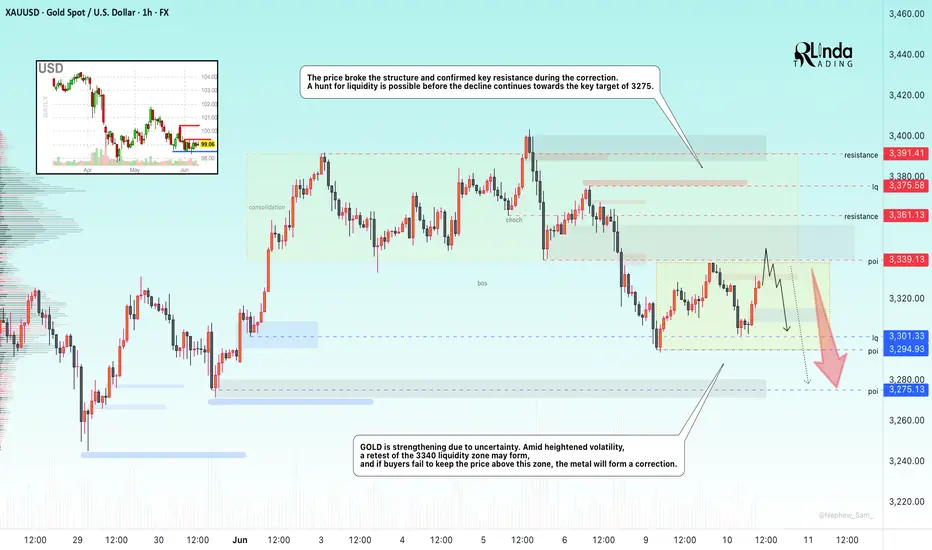
GOLD → Hunt for liquidity ahead of continued correctionFX:XAUUSD is strengthening due to uncertainty while the dollar consolidates. Amid heightened volatility, a retest of the 3340 liquidity zone may form, and if buyers fail to keep the price above this zone, gold may form a correction
Demand for the dollar is supported by the rise in USD/JPY after soft comments on interest rates by Bank of Japan Governor Ueda. Gold is responding with a correction. Traders remain cautious ahead of the outcome of the second day of trade talks between the US and China in London. Donald Trump confirmed that dialogue with Beijing is continuing, but key differences remain. Investors are also awaiting US inflation data (CPI), which could determine the further dynamics of the dollar and gold. Meanwhile, inflation expectations in the US fell from 3.6% to 3.2% in May.
Technically, gold broke the structure and confirmed key resistance during the correction. A hunt for liquidity is possible before the decline continues towards the key target of 3275.
Resistance levels: 3340, 3361
Support levels: 3301, 3275
The price is forming a new trading range of 3340 - 3301 (3294). Before declining, especially if the fundamental background changes to positive as negotiations progress, gold may test the liquidity zone of 3340 and form a false breakout, which will trigger a continuation of the correction to 3275.
Best regards, R. Linda!
USDJPY Long then Short: inverse H&SThis is a follow-up to the USDJPY idea that I posted yesterday. I am seeing an inverse H&S setup that is broken as the video is being recorded.

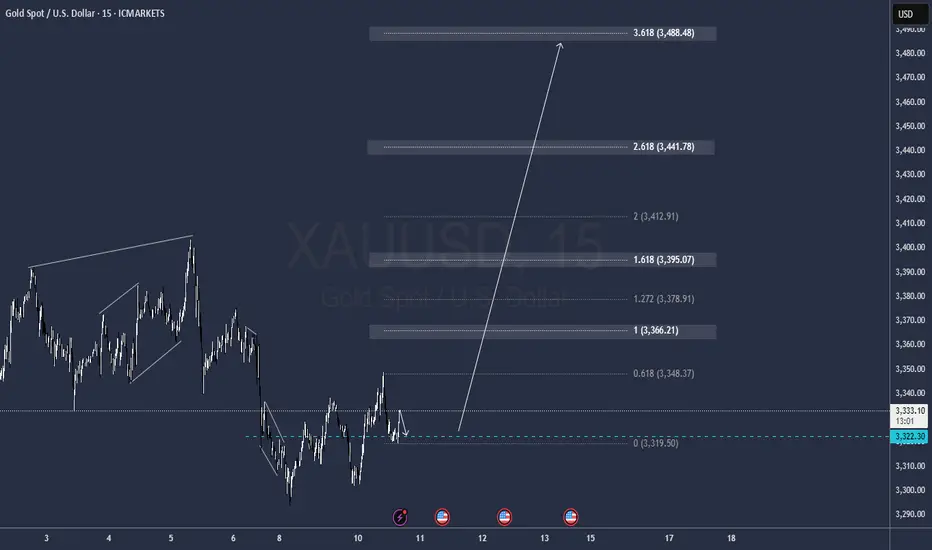
GOLD → Correction before a decline or continuation of the trend?FX:XAUUSD is testing the liquidity zone during the Asian session and forming a false breakout. The metal is recovering, but the fundamental background remains unstable...
On Monday, gold is holding steady at around $3,300 amid a weaker dollar and caution among traders ahead of US-China talks and the release of US inflation data (CPI) on Wednesday. Strong NFP data for May strengthened the dollar and lowered expectations for a Fed rate cut. However, domestic problems in the US are putting pressure on the currency... Markets are adjusting positions ahead of CPI. Geopolitics and domestic unrest in the US are holding back gold's decline, despite possible optimism about a trade deal.
Technically, the trend is bullish, with the price previously breaking the structure but rising in the Asian session after a false breakdown of the order block and the 3300 liquidity zone. Further movement depends on 3330 - 3340
Resistance levels: 33301, 3339, 3375
Support levels: 3301, 3275
The price is heading towards 3330-3340 for a retest. If the dollar continues to decline and gold manages to consolidate above 3340, the bullish trend may continue. BUT! A false breakout of the 3330-3340 zone could trigger a further decline after the bullish structure breaks down.
Best regards, R. Linda!

Carvana is setting up for a dropI believe CVNA is printing expanding triangle as wave 4 in larger 5.
If this count is correct, currently wave D of triangle is close to its end and soon, around $325-340, the trend should reverse and go down to complete the triangle with wave E which will erase >60% of market cap.
After this move the stock is expected to climb up again.

Inj Trade Plan📊 INJ Elliott Wave Update 🚀
Zigzag correction ✅ (5️⃣-3️⃣-5️⃣) followed by an ABC flat (3️⃣-3️⃣-5️⃣) — textbook cleanup before liftoff.
Wave (b) is in the past — Wave (c) just getting started 🟢
🔹 Wave 1 & 2 are complete
🔹 Wave 3 loading... ⚡
📍 Targeting:
• 1.618 @ $25.61 🎯
• 2.618 @ $142.12 💸
• 3.618 @ $193.99 🚀
🔻 Invalidation below $8.34 (78.6% retracement of wave 1)
🌊 If this count holds — we’re staring at a macro wave 3 explosion. Eyes on the prize. 🧠💥
#INJ #ElliottWave #CryptoTA #Altseason2025 #Wave3Incoming #LongSetup #InjMoonMission #TradingView

virtual Trade Planhuge wave 1 completion towards the upside making 5 wave of wave 1 complete and now wave 2 is now it's ending Traders can enter this coin slowly for an explosive wave 3 towards ATH
the whole 5 wave target is around 12.62$ making this trade a solid 12 RR

Ai16Z trade planthis coin has completed 5 waves move up from the lows creating a complete strong wave 1
and now the wave 2 is almost over traders can enter in this coin for an explosive wave 3 towards upside targeting 1.50$ that is 43 RR setup, and it will come very fast

SPX6900 - Time to Get Aggressive and Flip SPX🔥 CRYPTO:SPX6USD With a new ATH on the horizon, wave (3) is eyeing $2.4 - $3.1 as the next target. But this is just the start, momentum is building and summer volatility could push prices even higher!

FARTCOIN is primed for a 3X move!🚀 CRYPTO:FARTCOINUSD April rally cooled off, buyers stepped in at the $1 - $0.75 extreme zone, and now wave (3) is gearing up for liftoff.
🎯Targeting $2.3 - $3.2—momentum is building fast!
Are you strapped in for the ride, or still watching from the sidelines?

KAITO is setting up for its next 2x move!📈 BINANCE:KAITOUSDT Found strong buying interest in the #BlueBox zone and now it's gearing up for a potential 100% rally.
🚀 Targeting $3.3 - $4.3 as momentum builds.
Did you catch the dip, or are you waiting for confirmation?

Triangle Breakout Brewing in TCS?After completing a sharp five-wave rally that ended near 4592, TCS entered a classic zigzag correction. The drop from the top formed an A-B-C pattern where Wave A brought prices to 3913, followed by a corrective bounce to 4489 for Wave B, and then a strong decline to 3056 completing Wave C. This entire move looks like a textbook zigzag correction and marks a potential end to the correction.
From the low of 3056, the stock started to recover and formed a five-wave advance, which has been marked as a smaller-degree Wave 1. What followed next is quite interesting — instead of a typical zigzag or flat for Wave 2, price moved sideways and carved out a triangle. This triangle seems to have completed with Wave E ending around 3358.
Now, with the triangle complete and prices starting to move up again, it looks like Wave 3 might have just kicked off. The key level to watch on the upside is around 3642, which is the 0.382 retracement of the previous fall. If price crosses this, it would increase confidence in the bullish structure. The projected target zone for Wave 3 lies between 3933 and 4288, depending on how strong the move gets.
The entire setup remains valid as long as price stays above the 3056 low. If that breaks, the bullish count is off the table.
Chart will be updated as price action evolves.
Disclaimer: This analysis is for educational purposes only and does not constitute investment advice. Please do your own research (DYOR) before making any trading decisions.
