EUR/USD | Distribution in Play – Short Bias Active After completing a textbook Wave 5, price entered a premium supply zone and executed a clean liquidity sweep.
🔹 Confirmed Change of Character (ChoCh) signals the shift from bullish to bearish order flow.
🔹 Price is respecting the SMC structure:
📍 Liquidity grab
📍 Mitigation of bearish order block
📍 Distribution phase after impulsive rally
📉 Short-Term Bias: Bearish
🎯 Targeting the demand zone below near 1.1275–1.1292, where we may expect accumulation to begin again.
📌 Plan:
1. Short entries valid below 1.1439 supply.
2. Monitoring reaction at the blue zone for possible reversal next week.
⚙️ Strategy used:
SMC + Wyckoff Distribution + Elliott Wave (Top-down)
Elliott Wave

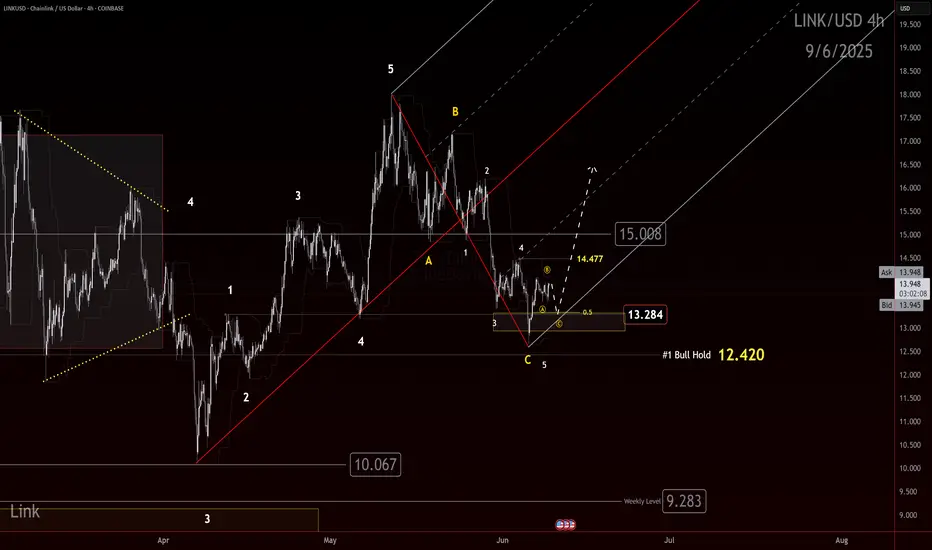
LINK Bulls Building Toward a Chain ReactionIf you find this information inspiring/helpful, please consider a boost and follow! Any questions or comments, please leave a comment!
LINK just gave us a clean reaction out of an identified box. Bulls may finally be gaining control and a trend shift up is on the table.
We had eyes on this box for a potential reaction. The market delivered. Now bulls need to prove they can build on it. The first key is to defend 13.284. As long as this level holds, the case for a higher trend remains alive.
Next, bulls need to clear 14.47. That is the first smaller degree LH that must be taken out to confirm that buyers are pushing through the structure.
The big step remains 15.00. This has acted as a major flipping level. A true test for the bulls will be whether they can reclaim and hold above it. If they do, the door opens for stronger upside follow through.
The path is clear:
💥 Hold 13.284
💥 Break 14.47
💥 Reclaim 15.00
We will continue to track this closely with the Elliott Scanner mindset. If momentum picks up through these levels, this could become an attractive higher-degree setup.
Watch these levels carefully. Bulls have work to do, but the ingredients for a shift are building.
Trade Safe!
Trade Clarity!
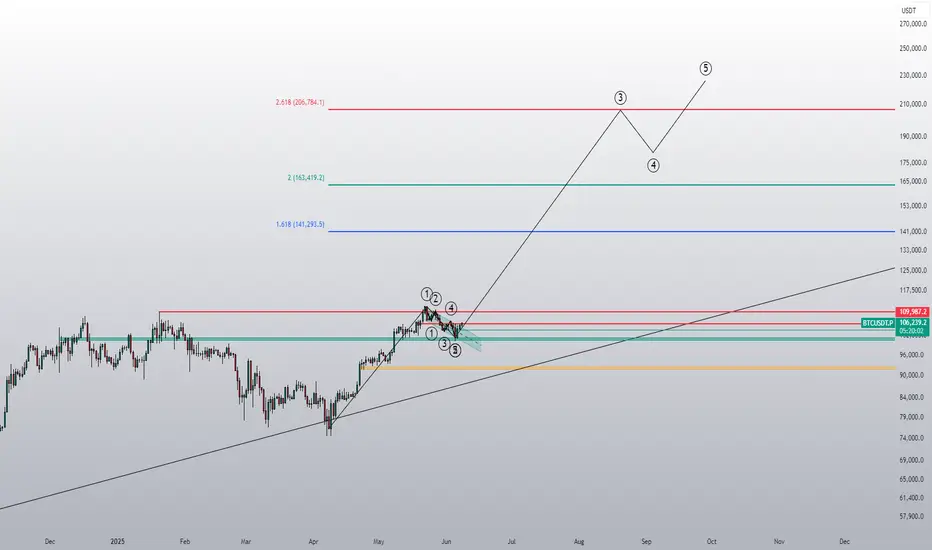
BITCOIN ROAD TO 300K !!! ELLIOTT WAVE CASE STUDYThere are three possible cases for Bitcoin which we can now consider according to Elliot wave count on big picture:
Case I: According to this count if we hold above 74.5k , recent low, we may see major shift in BTC. Retracement Up to 92-79k is good which will form inverse head & shoulders, potentially breaking ATH up to 170K, if things goes well & 74.5K region remains on hold.
Case II: If in case 74.5K region breaks, then it will invalidate minor count causing BTC to retrace more up to 64-52K major reversal zone region. If such thing happens, bullish shark pattern will be formed causing major reversal from that region BUT 49K region should remained hold!!!
Case III: Worst case scenario if 49K region breaks, then it will cause major count invalidation dropping BTC further up to 45-33K region.

Pudgy Penguins PENGU Gearing Up for a +100% Move! 🐧 BINANCE:PENGUUSDT has completed its 5-wave advance from the April low (wave 1) and corrected with a 3-wave Zigzag structure in wave (2), reaching the buying area at equal legs $0.009 - $0.008.
🚀 Now, it's setting up for wave (3) higher, with an initial target at $0.022.
🌊 Are you positioned to catch the next wave higher?

Gold Rejected at Resistance, Targets $3,305 & Below Gold ( OANDA:XAUUSD ) rose to $3,400, as I expected in my previous idea .
Gold is trading near the Resistance zone($3,387-$3,357) and has failed to break the resistance zone validly .
In terms of Elliott Wave theory , it seems that Gold has managed to complete the microwave 5 of the main wave C with the help of Expanding Ending Diagonal . It was a corrective Zigzag(ABC/5-3-5) structure .
Also, we can see the Regular Divergence(RD-) between Consecutive Peaks.
I expect Gold to touch $3,305 after breaking the lower line of the ascending channel at the first target and then decline to the Support zone($3,281-$3,245) and Monthly Pivot Poin t.
Note: Stop Loss(SL)= 3394.000
Gold Analyze ( XAUUSD ), 4-hour time frame.
Be sure to follow the updated ideas.
Do not forget to put a Stop loss for your positions (For every position you want to open).
Please follow your strategy; this is just my idea, and I will gladly see your ideas in this post.
Please do not forget the ✅' like '✅ button 🙏😊 & Share it with your friends; thanks, and Trade safe.

Exploring Bullish Targets for Hyperliquid HYPE🚀 BINANCEUS:HYPEUSD has surged into a new ATH and the most bullish scenario suggests a nest structure forming.
🎯 This setup could lead to an extension beyond the 1.618 Fib level at $66, opening the door for +$100 range in the coming months.
Are you positioned for this breakout? What’s your personal target for this cycle?

Bitcoin: Weekly Bullish Continuation🟠 The weekly divergence between the March 2024 and January 2025 peaks has driven the recent 3-month decline.
🔴 BTC is expected to make a weekly move higher, creating another divergence in the way.
🔵 BTC held above the 2024 peak range 73K without overlap, while the Stock RSI has completed a full reset, reinforcing the bullish momentum.
🟢 Outlook: Over the next 6 months, Bitcoin CRYPTO:BTCUSD is expected to rally into new ATH, with a potential target around 127K by October 2025.

Silver correction is nearing its endSilver is completing a bow-tie diametric pattern, currently in wave-f. After the diametric completes, there is a potential for an upward trend to form.
Good luck
NEoWave Chart

S&P500 Short: Ending DiagonalHi all, over here, I presented a cleaned-up chart of the EW counts for S&P500 and gave 2 entry points for shorting. The most important points are here:
1. 5th wave completion (or completing)
2. Ending Diagonal: will follow a sharp move down.
Alternatively, you can wait for a breakdown of the lower trendline to short.
Good luck!

Valaris deep correction has endedVery strong balance sheet, excellent management, and stable backlog of fleet bookings will allow VAL to make significant money for shareholders in the years ahead.
Together with its price trend reversal it will be an assuring addition to upcoming oil long-term price trend reversal.
Short term Elliott Wave Analysis given in a note below.

My Thoughts #014The pair seems to have still maintained its bullish trend.
Since the market is making a new higher high.
As you can see the fractal low is still holding so anything can happen
I see that pair has a potential to buy and move higher since it's been In a strong trend to the upside.
The pair could just change and sell at any point
So let's use proper risk management
And let's do the most

GOLD → Correction to 3275FX:XAUUSD and medium-term outlook: Friday's strong unemployment data strengthened the dollar and triggered a sell-off in gold. Money is temporarily flowing out of the metal and into currencies and the stock market...
Technically, gold is still in a bullish phase on the global timeframe. Logically, the situation is more reminiscent of a countertrend correction of the zone of interest before continuing growth.
Despite the rise in the DXY after Friday's news, the dollar is still under pressure from Trump, who is pushing for an early interest rate cut. This move could significantly shake the market (dollar down, gold up)
Locally, on the hourly XAUUSD timeframe, we can clearly see how the price is breaking out of the uptrend, thereby triggering a downward impulse.
Resistance levels: 3325, 3343
Support levels: 3303, 3275
The liquidity level of 3300 could act as a magnet for the price, from which a correction to the resistance of the range of 3325 could form (liquidity hunt), but due to the change in the fundamental background, gold may continue its correction to 3275 (support zone) before a possible continuation of growth.
Best regards, R. Linda!

USDJPY Pending Short at 146.32In this idea, I have plotted all the necessary information on the chart itself. But allow me to point them out in words:
1. A resistance zone drawn with a rectangle that shows 5 red down arrows, out of which 4 are historical price rejection points and the last one is an expected rejection point at the top of the resistance zone which will be our short entry.
2. An Elliott Wave count update that shows a double combination wave 2 showing that we are now in a C wave of the double combination Y wave.
3. 3 different trendlines: The purple is expected to break, the blue is where price is expected to be rejected that will coincide with the top of the resistance zone, and the green which will be our stop loss if break above.
4. A take short position risk-reward plot where SL is set is initially set up at 147.187 but this should really be following the green trendline, and a TP that is initially set at the blue H&S neckline at 141.042 (see previous USDJPY idea for the big picture H&S plot).
Overall, I am expecting a final push for USDJPY to move up that will be in-line with the equity markets last leg up) and then a higher degree wave 3 down for USDJPY that will also be in-line with equity markets downturn.
Good luck!

Gold Short Update: SL at 3340; TP at 3272Hi all, here is the video update to the short idea that I posted 19 hours ago. Main thing is the update of the Stop Loss and Take Profit.
Thank you.

Palantir UpdateThere is a lot to unpack regarding Palantir based on what has transpired as of late. I have removed the possible smaller degree irregular abc pattern that I was tracking. If you draw fibs for what would be a sub-minuette wave i of (v), you see that our recent top was made right around the 1.236. This is very standard for ED's. Also, when it reversed, it did so with strength which is another trait of ED's.
MACD broke down below the trend line and has come back into the wedge. It appears to be weakening/curling, setting price up for a potential move down again. What I would like to see, is for MACD to remain under the upper trend line while resetting before dropping and pulling price back down with it. This would fit well with the white count. If this happens, then I believe the ensuing price action would reflect close to what I have laid out on white.
The ALT count, which is becoming less and less likely every day, is the yellow pattern. This suggests that we're within a larger degree irregular ABC pattern. If this is the case, then price would likely drop to the $65 area if not lower. I think this pattern is very low probability, but it could still happen so it will stay on the chart for now.
In short, I believe we have topped in an ED with the slim chance of getting one more slight high. If we have topped, we should be headed for the target box in a 3-wave fashion. This would be a great place for longs should the coming price action follow my predicted structure.

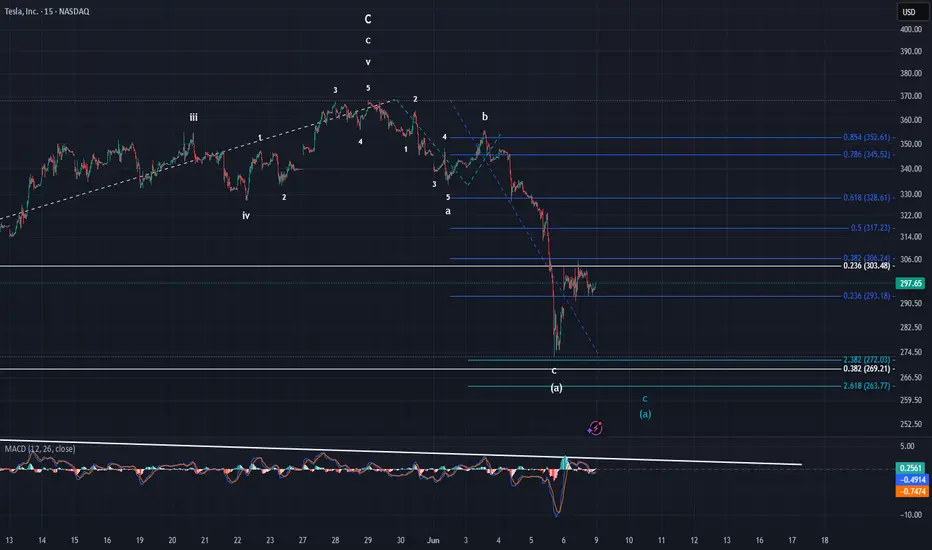
Tesla UpdateTesla has had quite a rough go at it lately. For those of you on trading view that follow me, you may not have had the daily updates as those on my website, but you should've known too by my posts that a decent drop was coming. Just so I am as clear as I can be, this is just the beginning of this consolidation lower. We might not even be done with this current drop for the minuette a wave either. As annotated by the turquoise label and the turquoise fibs, another low is very possible, and I would go so far as to say very probable. The reason why I think it is probable, is the structure that was created on the move lower. It appears like the move higher that started on 05 June is a miniscule wave 4 with 5 yet to come.
Now, another move lower isn't required by any means. We could easily continue higher from here for minuette wave b. That is why I have drawn some blue retracement fibs. If we have in fact bottomed in (a), then we would be targeting the $328-$350 area for (b).
In short, we either make another low from here to the $263 area finishing (a), or we continue higher for wave (b). MACD/structure seems to be indicating the turquoise count will come to pass. Either way we should head higher again soon. If we can make another low towards the 2.618 then I will likely take a small long position to ride out (b).
NASDAQ Potential UpsidesHey Traders, in today's trading session we are monitoring NAS100 for a buying opportunity around 21,300 zone, NASDAQ is trading in an uptrend and currently is in a correction phase in which it is approaching the trend 21,300 support and resistance area.
Trade safe, Joe.

Sonic Trade PlanSonic is Unfolding wave B and Wave C will come very fast
Wave B is unfolding in a clear 3-wave (ABC) structure inside the highlighted resistance zone.
Once this B wave completes, a sharp C wave down is expected—targeting the 1.618 area (~$0.28) as marked in the “Area of Opportunity.”
This zone presents a potential high-reward setup for bulls after the correction completes.
Caution until confirmation.
#ElliottWave #WaveB #WaveC #CryptoAnalysis #TA #Altcoins #CorrectionWave

Bitcoin 4H chart Elliot Wave analysisThe price reacted to the 0.236–0.272 Fibonacci level, effectively marking the end of the WXYXZ correction. However, for a Wave 2, this represents a relatively shallow retracement implying that alternative scenarios must remain on the table. This could still be an unfolding flat structure (3-3-5), with Wave A forming as a triple zigzag though this is less likely. A more probable outcome is a zigzag (5-3-5), which would require a sharper corrective move. Another possible structure is a double zigzag (WXY).

This could go very high!This looks incredibly like a full-send setup, which could blast Bitcoin up to 200k in a wave 3 of an Elliot wave pattern.
ImmunityBio, Inc (Wave Analysis) Weekly - UpdateImmunityBio, Inc (Wave Analysis) Weekly - Update
We are in downtrend wave E from Triangle corrective wave. maybe we are in last wave c or we still in diagonal wave a.
So, there are 2 Scenarios.
please see the chart.
Regards,

ONDOUSDT trade PlanONDOUSDT is forming a larger A-B-C corrective structure on the daily timeframe. The current wave count suggests that wave C is underway with bullish targets at 2.2287, 3.1943, 4.7567, and 6.3191. Structure remains valid as long as the recent low holds as the end of wave B.
#ONDO #Crypto #ElliottWave #ABCStructure #WaveC #Altcoins #CryptoAnalysis #Bullish #TechnicalAnalysis #TradingView #CryptoTrader

BTC Elliott wave analysis 6/8/2025 In my view, we are currently entering an A-B-C corrective wave, which is part of wave (4) and will complete wave (iv).
The bullish Crab harmonic pattern suggests that wave Ⓐ of (4) should bottom around 95,600–96,000. Following that, the Gann fan indicates that wave Ⓑ could rise to the 100,000–101,000 range, which also aligns with a key resistance zone.
For wave Ⓒ, the Gann fan suggests a downward move to around 94,000–92,000, a zone that corresponds to strong support.
Once wave (4) completes, the market should be positioned to begin wave (5), which will finalize the larger wave ⑤.
A key validation level to watch is 84,000. If the price drops below this level, the count would be invalidated, as wave (4) cannot fall below the low of wave (2).
