BTC is high! Any Weakness?If you find this information inspiring/helpful, please consider a boost and follow! Any questions or comments, please leave a comment!
Bitcoin Breaks to All-Time Highs — What’s Next for Price Structure?
Bitcoin has officially pushed into new all-time highs, and while the move wasn’t entirely unexpected, it still packs a punch. We discussed this possibility in recent videos, though I wasn’t fully convinced at the time. That’s the nature of trading—uncertainty is the cost of admission, and conviction builds as structure confirms.
As always, I was watching the price action closely. BTC started providing the clues needed to lean into the more bullish interpretation. The levels held. The flips were clean. Momentum lined up.
That said, I did take some speculative shorts at lower degrees—not to fight the trend, but to respect possible overextensions within the count. For those following the Elliott Wave roadmap, these intraday reactions were worth probing, but nothing confirmed a larger reversal yet.
The key now is structure.
We’re currently navigating uncharted territory, and in these zones, understanding wave context and market behavior around prior resistance becomes even more critical. There’s no overhead supply—only psychology, fib projections and profit-taking to watch for.
Here’s what I’m focused on:
Clear labeling of the motive sequence—is this the end of a Wave 3 or just a smaller subdivision?
Volume behavior and momentum divergence—looking for any signals that we’re near exhaustion.
Pullback zones—marking areas where Wave 4 or consolidation might emerge, if it’s due.
This is a time to stay sharp, not euphoric.
Trade safe, trade smart, trade clarity.
Elliott Wave

XAUUSD: Is corrective wave 4 competed?XAUUSD have been in uptrend for sometimes now with small pauses on the way. Given the current wave count we are clearly on corrective wave 4. The question is, is the correction completed or should we expect a further push to the downside? One of the possibilities is that the precious metal is making a complex correction WXY and currently we are bullish to complete wave X before resuming the decline for 4th wave completion.
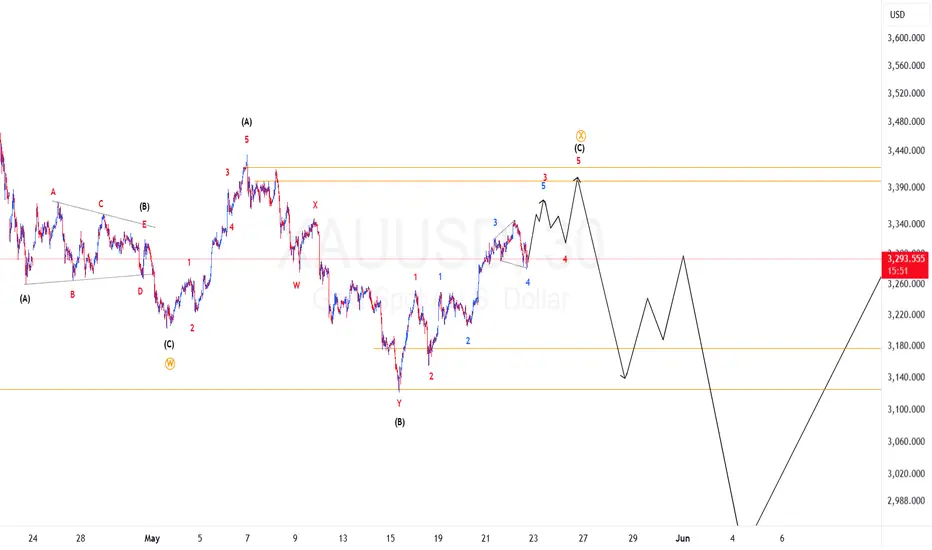
My Thoughts #010I still am waiting for a clear set up but here is my thoughts
The pair could still sell but also buy.
Sells
When we take out the safe low as choch then I will wait for retest then take my entry
Buys
When we reach demand zone and we get a choch
Then I will buy and hold until the all time high
Anything can happen
Use proper risk management
Let's do the most

Is GBPUSD ready for a pullback?With the current wave count the structures show a possibility that impulsive wave 1 is completed. If we are correct we should expect price to drop correctively for wave 2. To take advantage of the decline a trader should find other confluences that support the idea. Trade responsibly.

GOOG back under 150Been following for a couple days and potentially just got confirmation that w-3 of W-(C) is now under way with the big candle coming out. A new low will make that more probable.

$SPY May 22, 2025AMEX:SPY May 22, 2025
15 Minutes.
Last week I expected the retracement towards 580 levels as numbers were far away from moving averages. But AMEX:SPY kept moving towards595 and suddenly broke yesterday towards 582 levels.
I expect it to settle down around 579 - 581 levels then a pull back is on cards as now we have the reverse on the cards with the 200 being away again.
On left side we have a big gap around 570 - 577 levels which I feel will be sorted out before a consolidation.
The weakness below 590 has keto 582 levels.
At the moment if 578 is broken i see support around 573 574 levels.

TRX/USDT Potential UpsidesHey Traders, in today's trading session we are monitoring TRX/USDT for a buying opportunity around 0.2680 zone, TRX/USDT is trading in an uptrend and currently is in a correction phase in which it is approaching the trend at 0.2680 support and resistance area.
Trade safe, Joe.

My outlook for BTC going into the cycle lowI would expect BTC to form a short term top somewhere in this area to then form a cycle low around june 6th. I am watching for reaccumulation at this demand zone, but its way to early to tell how this cycle low will play out. (If there is no top in this area i am still expecting a retracement around this date, the price level does not matter)

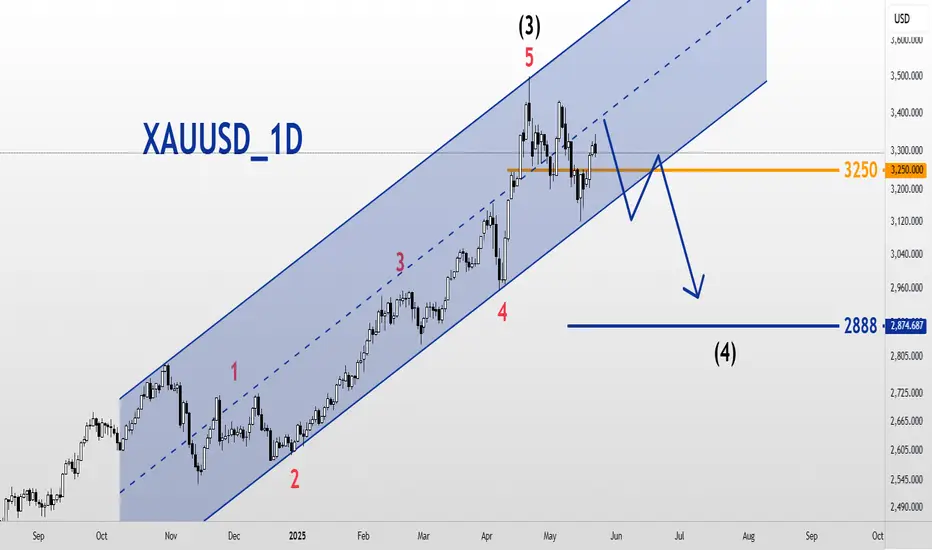
XAUUSD_1D_SellGold Analysis
Daily Time Frame Medium and Long Term
Elliott Wave Analysis Style
In the long term, the market could have completed the big wave 3 and entered a medium-term correction and completed the big wave 4.
In the meantime, the main and important number is 3250, and by maintaining the price below this number, we will enter a correction towards the number and range of 2888.
A channel break down is a confirmation for a fall!
EURUSD Pullback in Play – Next Stop: $1.1337EURUSD ( FX:EURUSD ) is moving in the Resistance zone($1.1310-$1.1162) while the upper line of the descending channel has been broken.
According to Elliott Wave theory , a breakout of the descending channel can at least confirm the end of a corrective wave . The corrective wave structure was a Double Three Correction(WXY) .
I expect EURUSD to rise to at least $1.1337 after completing a pullback to the upper line of the descending channel .
Note: If EURUSD touches $1.11590, we can expect further declines.
Please respect each other's ideas and express them politely if you agree or disagree.
Euro/U.S. Dollar Analyze (EURUSD), 4-hour time frame.
Be sure to follow the updated ideas.
Do not forget to put a Stop loss for your positions (For every position you want to open).
Please follow your strategy and updates; this is just my Idea, and I will gladly see your ideas in this post.
Please do not forget the ✅' like '✅ button 🙏😊 & Share it with your friends; thanks, and Trade safe.

Gold Long Update: Change in wave countsI'm providing the update to the wave counts by reverting back to an older count in order to "complete wave 3". I also breakdown the waves for wave 4 and explain how to set the stops in the event that price moves down.

Gold Long: Wave 3 of 5I believe we have completed wave 4 of 3 and is currently in wave 3 of 5. In fact, it should be wave 3 of 3 of 5.
The risk-reward is quite good over here. We are risking 20 points for 110 points of profits.
Good luck!

GBP/JPY Elliott Wave Completion + AO Divergence @ Zone 4.23 | BUHey traders! 👋
Here’s an exciting setup on GBP/JPY (1H) — we might be at the early stage of a major reversal, and you’ll want this on your radar. Let's break it down with Elliott Wave theory, the Awesome Oscillator (AO), and some powerful Fibonacci confluence.
🧠 Elliott Wave Count – 5-Wave Impulse Completed
We have a clean 5-wave bearish impulsive structure:
1️⃣ Wave (1): Sharp drop kicks off the trend.
2️⃣ Wave (2): Classic pullback, respecting structure.
3️⃣ Wave (3): Longest and most powerful wave down.
4️⃣ Wave (4): Corrective triangle/flat with weakening bear momentum.
5️⃣ Wave (5): Final push into a key demand zone, but lacks strength.
🛑 What makes this special? Wave (5) lands right into “Zone 4.23” — a Fibonacci extension (423.6%) of the corrective leg — acting as a magnet for price exhaustion.
📊 AO Divergence – Early Warning Signal!
Check the Awesome Oscillator (AO):
Price makes lower lows (Wave 3 → Wave 5)
AO makes higher lows — textbook bullish divergence 🔍
This is smart money exhaustion: the bears are running out of steam, even though price is still pushing lower. When momentum diverges from price, a reversal is highly probable.
📌 ZONE 4.23 – Fibonacci Confluence + Demand Zone
This zone (191.900 – 192.300) is no ordinary support. It combines:
📐 423.6% Fibonacci extension (a powerful exhaustion level)
🟦 Historical demand zone from previous impulsive rally
🤖 Price reacting instantly on touch = algorithmic buying likely
⚠️ What Comes Next – Break of Structure (BOS) = Entry Trigger
We’re not rushing in blindly. Here’s the plan:
Wait for BOS: Price must break above Wave (4) structure (~193.200).
AO flips green: Extra confirmation of new bullish momentum.
Retest of BOS or Zone 4.23: That’s our golden buy entry.
Target Zone: Use Fibonacci retracement of full Wave 1–5 down. First targets:
🎯 38.2% = 193.800
🎯 61.8% = 194.900
🎯 Full correction = 196.000+
🎯 Conclusion: This Is a Setup with EDGE
✅ Completed Elliott Wave
✅ AO Divergence = Hidden strength
✅ Fibonacci 4.23 Confluence
✅ Demand Zone bounce
✅ Clear BOS-based entry plan
🔥 Are You Ready for the Reversal?
Drop a comment if you're watching this setup too 👇
Like ❤️ + Follow if you want more clean, actionable Elliott Wave + AO confluence setups like this!
📈 Let’s catch the move before the crowd reacts.
#GBPJPY #ElliottWave #AO #Divergence #ForexTrading #TechnicalAnalysis #BuySetup #SmartMoney #Fib4.23 #BreakOfStructure #TrendReversal

Gold Long, S&P Short, USDJPY Short: Flight to SafetyThis is a multi-asset idea in which I explain how different instruments helps us to paint a picture of what is happening at a macro level, specifically to the financial markets.
Over here, I proposed that the equity markets, represented by S&P500, are going to correct heavily and that we will be in a flight-to-safety mode. Not brought up here but will add strength to the hypothesis is the yield on US Treasuries have also gone up.

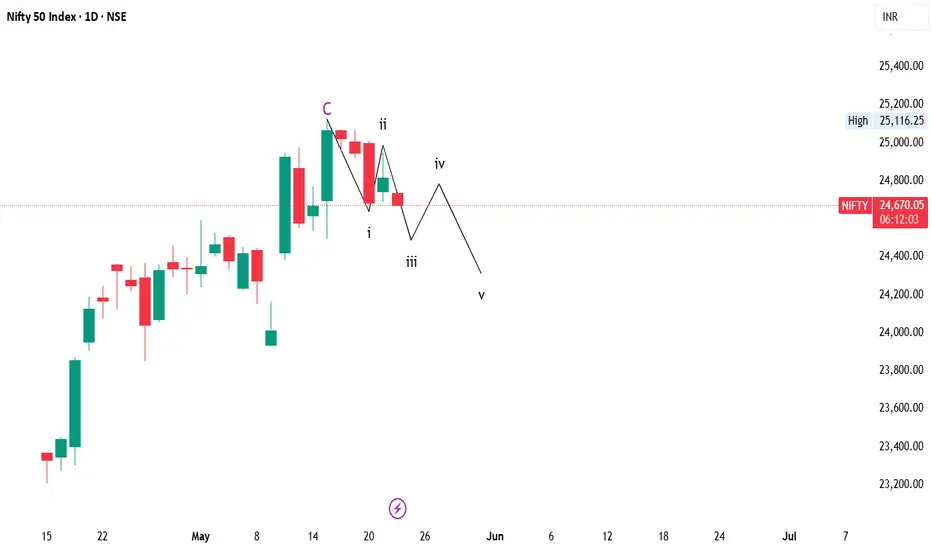
#Nifty Action
As expected, Nifty Wave 2 reached its 61.8% upward target yesterday.
Nifty will move towards its own wave3 goal. Between in 24280 to 24200
Caught the pivots up, now what?If you find this information inspiring/helpful, please consider a boost and follow! Any questions or comments, please leave a comment!
After catching the directional turn and key pivot level ahead of the recent move, Ethereum delivered the reaction we were anticipating. But what comes next?
The current W2 corrective structure isn’t textbook, so what do we do?
At this stage, we’re anchoring our analysis off the Wave 3 price action, which likely completed before the latest correction. That sets us up to track a potential Wave 4 development.
Here’s what’s still on the table:
We have a sideways style W2
For a wave 4, based off of alternation, we should be looking for a:
A sharp zigzag
Or a contracting triangle coiling up for the next breakout
Key Level to Watch:
👉 A clean break below 2159 would invalidate the more bullish interpretations and open the door to deeper corrective action. ⚠️
Until then, staying patient and letting the structure develop will be key.
Trade safe, trade smart, trade clarity.

Going short on the Nasdaq 100CAPITALCOM:US100
The Nasdaq 100 has moved up impulsively on a 5-wave move over the past 6 weeks, which is very bullish long term. However, in the short term, it is overextended, with the RSI indicator over the 70 level.
I expect it to decline over the next couple of weeks to the area marked in the green rectangle, between the 50% and the 78.6% Fibonacci Retracement level.
I hope you find this interesting.
Good luck to you

Going Short on BitcoinBINANCE:BTCUSDT
Bitcoin has moved up strongly in the last 5 weeks in a 5-wave up move, which is very bullish long term. However, after a 5-wave move, there is usually a 3-wave corrective move to the opposite direction. The most common target will be the Golden Pocket, which is between the 61.8% Fibonacci Retracement and the 78.6% Fibonacci Retracement. Which would be between $86,500 USDT and $81,200 USDT. This move will probably take several weeks, probably between 2 and 4 weeks, before it resumes to the upside.
Another point to consider is that the RSI indicator has reached overbought levels, above the 70 level. I would like to see it near oversold levels, 30 level, before considering going long.
I hope you find this interesting.
Good luck to you

SHIB/USDT Potential UpsidesHey Traders, in today's trading session we are monitoring SHIB/USDT for a buying opportunity around 0.00001420 zone, SHIB/USDT is trading in an uptrend and currently is in a correction phase in which it is approaching the trend at 0.00001420 support and resistance area.
Trade safe, Joe.

BTC Back to $100K — The Final Dip Before All-Time Highs?Bitcoin has been trading slowly and steadily just below its all-time high at $109588. The key question now is:
💭 Is BTC ready to break through and print a new all-time high? Or does it need one more dip before liftoff?
Let’s break it down.
Elliott Wave Structure & Market Context
BTC recently completed a clean 5-wave impulsive structure, with Wave 5 topping out into a major resistance zone. That confluence included:
Value Area High (VAH)
Weekly resistance
Daily multi-level clusters
Final resistance zone before price discovery
After multiple rejections from this zone, BTC lacked the momentum for a breakout — so a retracement was expected.
And that’s what we’re now seeing: a textbook ABC correction.
📉 ABC Correction Breakdown
✅ Wave A: Dropped sharply, nearly tapping the psychological $100K level
✅ Wave B: Retraced into the prior resistance band between $106133 and $104464 — rejected perfectly off the 0.786 Fib of Wave A
🔄 Wave C: Now unfolding
To project the potential bottom of Wave C, we use the trend-based Fib extension (Wave A = Wave C). The 1:1 extension lands at:
🎯 $99875 — Right at the $100K psychological magnet
Add this confluence:
🟢 Key swing high at $99475
✅ 0.5 Fib retracement of the entire 5-wave rally
🔍 Psychological Level: $100K
🔑 Liquidity and demand zone
This makes the $99K–$101K area a strong, high-conviction support zone.
🟢 Long Trade Setup
Entry zone: Ladder between $101K – $99K
Stop-loss: Below GETTEX:97K
Target: New all-time high at $109588
R:R: ~3:1+
Structure: Correction into high-confluence zone + psychological level = high probability setup
📌 Summary:
BTC likely finishing Wave C of ABC correction
$100K = confluence of Fib, structure, psychology, and liquidity
Setup is simple: Wait for price to retest this zone and trigger your plan
If this level holds, BTC may be ready to attempt a breakout into price discovery
Let the chart come to you — and trade the reaction, not the anticipation. 📉🔁📈
____________________________________
If you found this helpful, leave a like and comment below! Got requests for the next technical analysis? Let me know.

DUSKUSDTThis is a long-term analysis for the weekly time frame. Our guess is that the price will return from around 0.012 to 0.015 and even higher (completion of wave 4) and then complete its wave 5 at around 0.053 to 0.041.
If this happens, buying it spot is quite low-risk and we can even look at it for a long-term hold and an investment under one condition.
If this Elliott analysis is correct, the price could reclaim its new high within two years or more and even see numbers beyond it.
In terms of timing, late July and early August are a good time for the end of wave 4 and late 2025 and early 2026 are ideal times for the end of the hypothetical wave 5.

C98/USDT 15M ANALYSISHey Traders! 👋
I'm tracking a potential impulsive Elliott Wave structure on C98/USDT.
📈 Wave Count So Far:
- We completed a clean 5-wave impulsive move up — labeled i through v.
- This was followed by a classic zigzag (ABC) correction, forming what looks like a textbook
Wave 2.
- The corrective structure appears complete, and price is now holding above key support.
🔍 Current Expectation:
I'm now looking for Wave 3 to unfold, which typically brings the strongest momentum in the Elliott Wave sequence.
Trade Setup:
🟢 Entry Zone: 0.06 – 0.0615
🔴 Stop Loss: 0.05923
🎯 Target Price: 0.0652
💡 Note: Always manage your risk and confirm with your own analysis before entering any trade.

ETH - This will take time Part IIAs previously outlined, the fourth wave of the Primary degree in Ethereum (ETH) is forming a large triangle pattern, consistent with the corrective structure observed in XRP. This pattern is likely to extend over time, with the fifth wave of the Primary degree expected to begin around November or December 2025. A potential sharp breakout could occur starting in February 2026, signaling the start of a significant bullish move. If this breakout materializes, ETH could experience a substantial price increase, potentially exceeding current expectations, with a target significantly higher than anticipated.
