USD/CHF 4H Analysis – Bearish Continuation Setting Up?USD/CHF is currently forming a textbook symmetrical triangle consolidation pattern just below key EMAs (20, 50, and 200), signaling potential exhaustion in bullish momentum. Price is compressing against the upper boundary of the triangle, failing to sustain above the 0.382 Fib retracement level (0.82302), which is aligned with the 50 EMA – a known area of dynamic resistance.
This consolidation follows a clear bearish leg from the swing high at 0.83472, which suggests this triangle is likely a continuation pattern. A clean break below the ascending trendline support would confirm bearish continuation, with a measured move target near the 0.81068 level, which aligns with the -0.27 Fib extension.
🔍 Key Technical Levels:
Resistance: 0.82302 (0.382 Fib), 0.82525 (0.5 Fib), 0.82753 (0.618 Fib)
Support: 0.82026 (0.236 Fib), 0.81579 (Swing Low), 0.81068 (Bearish Extension Target)
📌 Watch for:
A decisive break and close below triangle support
Volume spike or bearish engulfing candle for confirmation
RSI is neutral but leaning slightly bearish; room for downside
🎯 Bearish Bias
📍 Tag: #USDCHF #ForexAnalysis #WrightWayInvestments
Elliotwaveanalysis

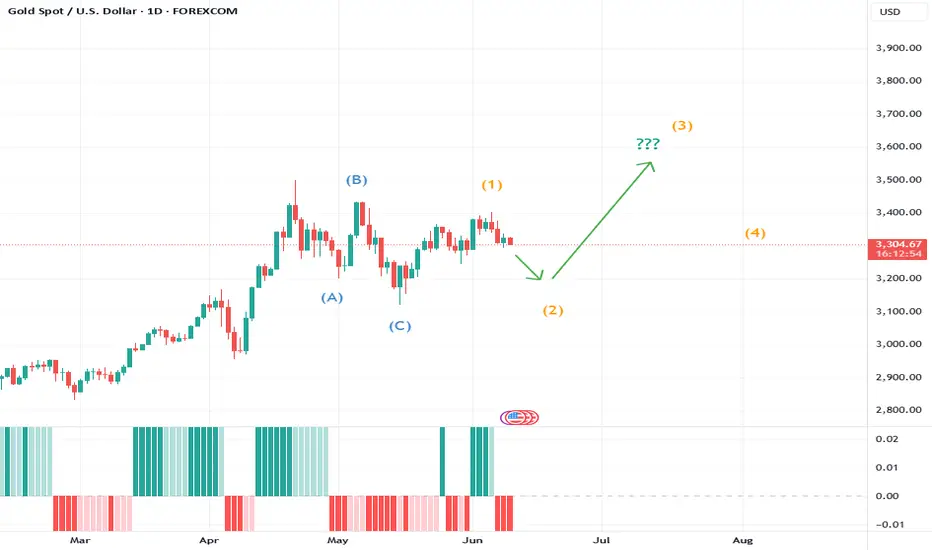
XAU/USD 1H – Clean Impulsive Setup UnfoldingGold has completed a clean Wave (2) correction, bottoming at $3,292.30, respecting both structural demand and fib confluence. Price is now showing early signs of Wave (3) development to the upside.
📌 Key Structure:
Wave (1) High: $3,403.30
Wave (2) Low: $3,292.30 (confirmed higher low structure)
Market is now consolidating slightly above the 0.5 fib level ($3,324.45), with bullish structure still intact.
📈 Technical Confluence:
Price is holding the internal bullish trendline
RSI is neutral but building potential upside momentum
Price action is forming higher lows, indicating strength post-correction
🎯 Next Bullish Targets:
$3,366.08 (0.236 fib level of Wave (2) correction)
$3,403.30 (Wave (1) high retest)
Final Wave (3) extension zone: $3,445 – $3,500
📉 Invalidation Level:
A break and close below $3,292.30 would invalidate this Wave (2) bottom and open the door for a deeper correction.
✅ Bias:
Bullish, as long as price holds above the 0.618 – 0.705 fib zone. A strong push from this area could confirm the next leg of Wave (3).
@WrightWayInvestments
@wrightwayinvestments
@wrightwayinvestments

CRUDE OIL: 12 JUNE, 2025 - BOTTOM AND TAKE OFF!?Conclusion: The ABC)-orange correction may have just completed, and a five-wave is pushing much higher, targeting the nearest target at the high around 94.19 or 130.50.
Details: Since the high of 130.50, a decline with A,B,C)-orange has unfolded as a Zigzag. I counted a five-wave within the A)-orange, and a triangle within the B)-orange, and finally the C)-orange has completed as a five-wave. So, perhaps that ABC has ended with convincing evidence.
So crude oil is likely to rise in the medium term, even though the alternative scenarios with relatively high probability in another development also show increasing bullish weight. And it is aiming for the nearest target at 94.19. While price must always remain above 55.30 to keep the Bullish market view valid.

S&P500: Within reachThe S&P 500 has edged past the 88.70% retracement and is now trading within our magenta Target Zone (Coordinates: 5,880 points to 6,166 points). This places magenta wave (B) likely near its peak - a move that could soon give way to a sharper decline as part of the anticipated wave (C). At current levels, the setup remains favorable for initiating short positions. To manage risks, a stop just 1% above the upper boundary of the Target Zone is recommended. If the index breaks above resistance at 6,6675 points, however, we would shift to an alternative interpretation: a bullish continuation in the form of the wave alt.(III) in blaue. We currently assign a 40% probability to this scenario. One final note: the minimum technical requirement for wave (B) has already been fulfilled by the entry into the Target Zone. This means wave (C) could begin any time.
Over 190 precises analyses, clear entry points and defined Target Zones - that's what we do.

₿ Bitcoin: Further Upside ExpectedBitcoin (BTC) pulled back slightly in yesterday’s session but remains on track to continue its corrective rally within green wave B. In line with our primary scenario, this advance is expected to reach the blue Target Zone between $117,553 and $130,891. Afterward, we anticipate the onset of wave C, which should initiate a substantial decline—driving the price down into the lower blue zone between $62,395 and $51,323. This is also where we expect orange wave a to conclude. From there, wave b should provide a temporary rebound before wave c resumes the broader downtrend, ultimately completing blue wave (ii). That said, there’s still a 30% probability that blue wave alt.(i) has not yet topped. In this alternative scenario, BTC would extend higher, potentially breaking above resistance at $130,891 before the corrective phase resumes. The daily chart illustrates the entire five-wave blue sequence and shows our expected low for wave (ii) within the blue zone between $37,623 and $26,082.
📈 Over 190 precise analyses, clear entry points, and defined Target Zones - that's what we do.

BTC.D(based one NEowave)the Z wave of this branch shown as a triangle and I think its finished but for confirmation breaking the 61.9 is important.
its a green light of Altseason.

ALTS Bullish! Lots of wave 3 Bullish Impulsive patterns forming!This is an update to my past 3 Arbitrum posts. Clear impulsive price action, highest volume, indicative of wave 3s/extended waves. Lots of extensions of subwaves going on in the middle of the sandwich ( 3rd wave of blue wave 3 ), Happy Trading. NOT FINANCIAL ADVICE
"Markets can remain irrational longer than you can remain solvent"
COINBASE:ARBUSD

₿ Bitcoin: Push to the Upside! Bitcoin has made a significant push to the upside, which brought it closer to the upper blue Target Zone between $117,553 and $130,891, where we primarily expect the corrective rise of green wave B to conclude. We consider this price range an opportunity to take partial profits or to open short hedges for tactical protection of existing long positions — thus, we don't plan to sell all our Bitcoin holdings there. Potential short hedges could be secured with a stop 1% above the upper edge of the zone since there's a 30% chance that price could exceed this zone to develop a new high for blue wave alt.(i) before reversing later. Primarily, however, green wave C should commence in the upper blue zone and drive BTC down into the lower blue zone between $62,395 and $51,323—and thus to the low of orange wave a.
📈 Over 190 precise analyses, clear entry points, and defined Target Zones - that's what we do.

ADA(based on NEowave)this branch of Cardano is diamond diametrical but I didnt count the other branches and the larger degrees but based on ETH and other Altcoins I think it will pump soon.

A Potentially Dangerous Pattern Takes ShapeWhile the futures market has yet to break into new all-time high territory, the previously discussed bearish micro setup has now been invalidated. In its place, we’re witnessing a complex, overlapping advance—creeping steadily toward the prior highs in the S&P 500 (ES).
At the micro level, I currently see no compelling bearish setup. However, this grinding upward move—lacking strong conviction from either buyers or sellers—is not necessarily bullish. In fact, it’s a hallmark of a potentially dangerous pattern: a primary degree ending diagonal.
If my interpretation is correct, both the “orange” and “purple” wave counts point to the same ominous conclusion. They suggest that what we're seeing could culminate in a sharp, possibly violent reversal—one that would ultimately retrace back to where this entire primary wave began. For reference, that’s just above 4,000, marked by the conclusion of Primary Wave 4 in October 2022.
This is the moment for caution—not after the damage is done.
Yes, we may push into new all-time highs. But within this fragile and overlapping structure, that outcome is far from guaranteed. Even if we get there, the looming question remains:
At what cost?

Hellena | Oil (4H): SHORT to support area of 58.00.Colleagues, the previous forecast did not meet expectations for too long, and the price has been in a prolonged sideways movement.
In this regard, I decided to slightly revise the waves and make a new forecast.
At the moment, I believe that the price will resume its downward movement in the medium-term wave “3.” The complex configuration of the correction makes it difficult to fully understand whether it is a combined correction or a five-wave movement.
In either case, I expect the price to reach the support area of 58.00.
Manage your capital correctly and competently! Only enter trades based on reliable patterns!

Doge(based on NEowave)like ETH wave E is ending and soon it will start a huge bullish wave.
wave E look likes a bow-tie diametrical and wave g is at the end which is the last chance to buy.

Hellena | BITCOIN (4H): LONG to resistance area of 115,000.I see that price has shown a violent rise in a five-wave move and I have redrawn the waves a bit to make it clear where to expect a correction. I think we are currently seeing a correction in wave “4” (104,000).
But most importantly, I expect an update of the high. Therefore, I believe that the level of 115,000 will be reached and it may be a wave “5”, after which we can expect a deeper correction.
Manage your capital correctly and competently! Only enter trades based on reliable patterns!

USDT.D(based on NEowave)I think wave E of triangle touched the necessary high and crypto is ready for a big pump.
pay attention to the targets and stop loss!

Gold’s Week Ahead: Structure, Scenarios, and What to WatchChart Overview:
Gold (XAU/USD) is at a critical juncture. The recent action shows a completed three-wave correction, and price is now setting up for what could be a powerful motive wave. My primary scenario is a bullish move once the current structure matures, but I’m also tracking alternate counts—flat, triangle, and double zigzag—all of which still point to at least one more push higher.
Why This Count?
The leading diagonal (5-3-5-3-5 or 3-3-3-3-3) for wave 1 fits the textbook, with wave 4 overlapping wave 1—a classic Elliott Wave signature.
The three-wave correction appears complete, which often signals the start of a new impulsive sequence.
I’m watching for confirmation: a completed corrective pattern and a strong move off the lows.
What’s Next?
If the correction finishes and price holds above the wave 1 low, I’ll be looking for a long setup targeting the 100% or 1.618 extension of wave 1.
Invalidation is simple: if the wave 1 low breaks, the count is off and I’ll reassess.
I’ll wait for structure to complete before entering—patience is key.
Update on Arbitrum wave 3 Extension! Bullish!
Update! Subwave 3-3-3 confirmed. Expected continues grinding up as we complete the remaining wave 4,5-4,5 structures. Elliott Waves are so cool 😎

Update on ARB! Bullish Impulse confirmed!ARB according to my Elliott Wave Theory knowledge, is currently grinding up in a bullish impulse. Wave 4 retraced around 38%-50% .618 invalidation looking lonely, just how I like it 👌. Subwave 3 of 3 maybe complete as we seem to be building a triangle structure, indicative of a wave 4. Not financial advice!

BITCOIN ROAD TO 300K !!! ELLIOTT WAVE CASE STUDYThere are three possible cases for Bitcoin which we can now consider according to Elliot wave count on big picture:
Case I: According to this count if we hold above 74.5k , recent low, we may see major shift in BTC. Retracement Up to 92-79k is good which will form inverse head & shoulders, potentially breaking ATH up to 170K, if things goes well & 74.5K region remains on hold.
Case II: If in case 74.5K region breaks, then it will invalidate minor count causing BTC to retrace more up to 64-52K major reversal zone region. If such thing happens, bullish shark pattern will be formed causing major reversal from that region BUT 49K region should remained hold!!!
Case III: Worst case scenario if 49K region breaks, then it will cause major count invalidation dropping BTC further up to 45-33K region.

₿ BTC: Upside Potential Remains IntactBTC posted modest gains over the weekend, but more upside is expected in our primary scenario. We continue to track a corrective advance in green wave B, with the potential to extend into the upper blue Target Zone between $117,553 and $130,891. From that top, wave C should initiate a downward move into the lower blue zone between $62,395 and $51,323—completing orange wave a. Subsequently, we anticipate a bounce in wave b, followed by another decline in wave c, which should conclude the larger correction of blue wave (ii). There is still a 30% chance that blue wave alt.(i) could make a new high, extending beyond the Target Zone and delaying the broader corrective sequence.
📈 Over 190 precise analyses, clear entry points, and defined Target Zones - that's what we do.

BTCUSD analysis for this cycle TopBTCUSD analysis for this cycle Top
1. According to the Elliot wave it is the 5th wave of elliot theory
2. As per the time cycles Btc should define the top in the last quarter of this year possibility in (oct or nov)
3. And for the projection as always the Btc favourite patthen AB=CB is also in play.
4. Fib extension tool level 1.618
So as we can see if btc will play according to this analysis. As its always follows this same things again & again in all cycle. So we can expect the top somewhere around (165,000).

TRXUSDT at the Crossroads: Breakout or Stall?TRX is currently in the multi-leg Wave 4 consolidation, a classic corrective phase before the anticipated final Wave 5 impulsive.
This consolidation phase is healthy within the larger trend, allowing for overbought to fade before the next move higher.
A clear breakout above the $0.28–$0.30 range would affirm the Elliott Wave forecast, targeting $0.30 → $0.31 → $0.33. A confirmed close above $0.30 would unequivocally solidify the Wave 5 scenario, paving the way for these upside objectives.
The 81.77 monthly RSI suggests an overbought market, supporting the anticipation of continuous consolidation within Wave 4, potentially retracing back to the $0.25–$0.27 support zone before resuming higher.
Long-term trend indicators are firmly bullish, with the Monthly EMA (20) at $0.1911 and SMA (20) at $0.1769, both considerably below current price action, confirming unbroken upward momentum within the greater timeframes.
So while short-term price action suggests consolidation, technical stance favors continuation to the higher side, and a breakout above $0.30 would signal Wave 5's beginning and continued momentum towards $0.33.

Injective & Elliott WavesAn impulse leads to a correction. A correction leads to an impulse.
The chart here starts with a bullish impulse. 1,2,3,4,5—blue-left. This impulse leads to a correction. ABC—orange.
The first ABC correction, the bear market, ends June 2022.
A correction leads to an impulse so a new bullish impulse starts right after and we have a new 5-up waves. 1,2,3,4,5—blue-center.
The bullish impulse ends March 2024 and this leads to a new ABC correction. Orange-right. The correction hits bottom 7-April 2025. The end of the correction signals the start of a new bullish impulse, 1,2,3,4,5 blue-right. The 2025 bull market.
This is Elliott Wave Theory simplified.
Namaste.

Bearish Impulse Complete! Possible zigzag correction in play.Bearish wave 5 of impulse completed the Bearish Trend, now correcting to the upside in a zig zag structure, leg A & B complete, now for wave C im targeting the 1:1 of wave A. We will see if this remains a 3 wave structure, or if it runs into 5 waves it could be an A/W wave of a larger correction. I am still studying Elliott Waves so ahem, this is not financial advice!
