"Gold Analysis Using Elliott Wave: Prolonged ABC Correction"I believe that gold is currently undergoing a significant and prolonged ABC correction. At the moment, we are in a subordinate wave structure, specifically within a WXY correction pattern, marked on the chart with , , , , , and in red.
For the upcoming weeks and days, it is crucial to observe the potential price movements. In my chart, I have drawn the larger timeframe with white lines to illustrate the overarching trend, while a red line indicates the smaller, subordinate wave structure.
Currently, we are in the red-marked WXY zone, which suggests that around the 3,286 level could be an ideal point to enter a long position targeting higher levels in wave Y. Conversely, this could also be an opportune moment to short down to wave B and then C.
On the short-term chart, we are at point A, marked in yellow. After reaching A, I expect a trend reversal within the highlighted rectangle towards B (also marked in yellow), followed by an upward move to C.
Subsequently, we may see a five-wave decline labeled as i, ii, iii, iv, v. After this decline, a corrective upward movement is anticipated, characterized by an ABC pattern.
These are my expectations for gold based on this analysis. Please note that this information is for educational purposes only; there are no guarantees regarding trade execution or outcomes. Whether you decide to enter a position or not depends solely on your own judgment.
Elliotwaveanalysis

"Gold Analysis Using Elliott Wave: Prolonged ABC Correction"I believe that gold is currently undergoing a significant and prolonged ABC correction. At the moment, we are in a subordinate wave structure, specifically within a WXY correction pattern, marked on the chart with , , , , , and in red.
For the upcoming weeks and days, it is crucial to observe the potential price movements. In my chart, I have drawn the larger timeframe with white lines to illustrate the overarching trend, while a red line indicates the smaller, subordinate wave structure.
Currently, we are in the red-marked WXY zone, which suggests that around the 3,286 level could be an ideal point to enter a long position targeting higher levels in wave Y. Conversely, this could also be an opportune moment to short down to wave B and then C.
On the short-term chart, we are at point A, marked in yellow. After reaching A, I expect a trend reversal within the highlighted rectangle towards B (also marked in yellow), followed by an upward move to C.
Subsequently, we may see a five-wave decline labeled as i, ii, iii, iv, v. After this decline, a corrective upward movement is anticipated, characterized by an ABC pattern.
These are my expectations for gold based on this analysis. Please note that this information is for educational purposes only; there are no guarantees regarding trade execution or outcomes. Whether you decide to enter a position or not depends solely on your own judgment.

SUSDT - 1WThe previous bullish analysis failed and I currently expect a correction to the range of 0.3 to 0.33 cents...

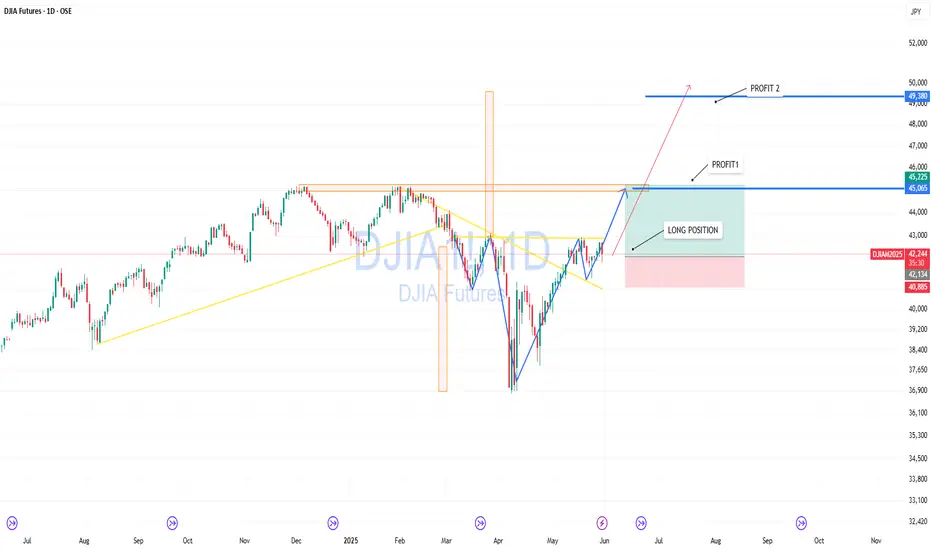
DJIA — Setting Up for Breakout and New ImpulseThe Dow Jones Index is approaching a critical resistance zone. After a deep V-shaped recovery and clear bullish structure, price is preparing for a breakout.
Chart shows a clean long entry with a stop below the recent consolidation. A break and hold above 45,000 could lead to a move toward 46,000, and if momentum holds — up to 49,300.
Partial profit-taking levels:
— Target 1: 45,225
— Target 2: 49,380
Fundamentally, US equity markets remain strong, and DJIA may play catch-up after lagging during the last correction.
CHFJPY SHORTCHFJPY is expected to continue tanking to complete the ABCDE triangle corrected before the up-surge to follow the dominant trend. shorting on current price action to complete the triangle wave correction

EURJPY SHORTwith safe haven assets expected to be bullish, i expect JPY to be strong against risk on currency like euro. EURJPY is expected to fall to complete a triange formation in the coming weeks before the bullish impulsive leg.

A look at monthly Chart of BTCIf we count Elliot Wave at weekly or monthly, we see we are at the ABC Correction of the Primary Impulsive wave, that the ABC might create an Irregular or Expanded Flat. I think the chart is going to create a C wave of the ABC Primary wave, and those numbers might be a target, but according to Fibbonaci Levels, 0.618, which is 40,000. Other targets can also be seen on the chart.

Tracking a pattern that could signal the Top is In I am tracking a micro pattern with the new local high made in the ES last night and today's price action as a micro 5-down....we should get a slight retrace into the 5960 ish area. Maybe tomorrow...maybe in the overnight session tonight.
If price can then breach todays micro low of 5884 in the ES futures...we need to then follow through with a breach of 5857 to give us our first indication, we may have struck a top.
From there I am following 2 counts...Purple, or my primary count which is a minor C of Intermediate (A).
Best to all,
Chris

Dollar At Resistance; Will Lower CPI Cause New Drop? We had a volatile start of a new trading week.
The dollar moved higher across the board as the US and China appear to be moving toward lowering tariffs, suggesting progress toward a potential trade deal. As a result, stock futures are also trading to the upside. However, keep in mind that sharp moves on Monday can easily be reversed through the rest of the week, possibly even today, after US CPI came out lower than expected, which can cause some weakness on yeilds, and possibly FED will be ready to cut rates after-all.
So, I think that USD can still come under pressure, especially if we also consider that rise on DXY is in three legs and that a lot fo gaps from this weekend are still unfilled.

GBP/JPY Elliott Wave Count Warns of Impending Sell-OffThe GBP/JPY pair has just completed a 5-wave downtrend, which ended around early April. Since then, the price has been moving higher in what appears to be a typical A-B-C corrective pattern — a common move that occurs after a major downtrend in Elliott Wave Theory.
We are currently in the final wave (C) of this correction, and within that, it appears that Wave 5 of C is now unfolding. This final wave appears to be nearing its end, and the price is approaching a strong resistance area between 196.813 and 197.513.
T1: 193.735
T2: 192.133
SL: 198.252
❌ Invalidation Level:
If the price closes above 198.252, this Elliott Wave count is likely wrong. That could mean the market is preparing for a bigger rally instead.

S&P500: Top Within ReachThe S&P has recently continued its upward movement, climbing higher into the magenta-colored Short Target Zone between 5,880 and 6,166 points. Primarily, we expect the top of the current wave (X) in magenta within this price range, after which a downtrend should follow with wave (Y). This final phase of the magenta three-part movement should lead the index into the green Long Target Zone between 4,988 and 4,763 points, completing the overarching green wave there. A rise above the upper boundary of the Target Zone and a breach of resistance at 6,675 points would trigger our alternative scenario.
📈 Over 190 precise analyses, clear entry points, and defined Target Zones - that's what we do.

IBM: Bullish AttemptsIBM has made progress in our scenario: Currently, the price is rising above the crucial resistance at $265.72; clearly surpassing this mark is important in the ongoing wave (3) in magenta. While we cannot entirely remove our alternative scenario with a new low for wave alt. in green, it still holds a 33% probability. We primarily expect that the regular wave in green was already completed at $211.52 and are therefore preparing for a direct continuation of the increases in the broader wave in green.
📈 Over 190 precise analyses, clear entry points, and defined Target Zones - that's what we do.


ETH(based on NEowave)I changed my analysis and I think Its better to consider eth in the middle of the running diamond diametrical.
stop loss of this analysis is 2400$.

Apple: Wave [2] Correction We now consider the dark green wave to be complete and thus place AAPL in the intermediate corrective movement of wave , which can be further subdivided into waves (A), (B), and (C) in magenta. Currently, only the last part of this (C) wave should be missing before the next impulsive uptrend unfolds towards the previous all-time high. We must still weigh our alternative scenario with a 34% probability: If the price falls below support at $168, this scenario with a new low for the blue wave alt.(IV) would be confirmed, although in this case, the price should not fall significantly below our previous Target Zone.
📈 Over 190 precise analyses, clear entry points, and defined Target Zones - that's what we do.

GBPAUD SHORT TERM SELLS BEFORE TE BUYSGbpAUD is expected to sell for a short term correction before the major buys

How I Use Elliott Waves to Trade — A Real Example from XAU/USDElliott Wave Theory is a powerful tool I use to understand market structure and build trading plans with confidence. In this post, I’ll walk you through how I’m applying it to the current setup in XAU/USD (Gold) on the 1-hour chart, and how I develop a trading plan around it.
🌀 The Current Structure: A 5-Wave Impulse in Progress
Based on the chart, I believe gold is in the middle of completing a classic 5-wave impulsive move. We’ve already seen the completion of Wave 1 and Wave 3—and we’re now likely in the midst of a Wave 4 correction.
🔍 How Do I Know This?
There are several clues:
Wave 3 is extended, meaning it’s longer than both Wave 1 and the expected Wave 5.
Inside Wave 3, Wave 2 was a sideways flat, and Wave 4 was a sharp zigzag.
This follows the Guideline of Alternation, which states that if one correction is sharp, the next tends to be sideways.
These characteristics give me confidence in my wave count.
💡 Why I Love Trading Wave 5
Wave 5 is my favorite wave to trade because it offers a high-probability opportunity when the structure is clear and confirmed. Here’s how I approach it:
📉 Step 1: Define the Invalidation Level
According to Elliott Wave rules, Wave 4 cannot enter the price territory of Wave 1. This gives me a hard stop loss zone—if price dips below that, the count is invalid, and I step aside.
🎯 Step 2: Determine the Target (Take Profit)
When Wave 3 is extended, Wave 5 usually relates to Wave 1, and I consider three common Fibonacci targets:
61.8%
100%
161.8%
Since the 100% extension of Wave 1 is the most typical scenario, that’s where I’ll tentatively place my take profit.
🛠️ Step 3: Plan the Entry
Now that I have both my stop (below Wave 1) and my take profit (100% of Wave 1), I plan my entry.
Here’s how:
Wave 4 often retraces to the 38.2% Fibonacci level of Wave 3—which is where I begin looking for support.
This level also coincides with the termination point of the previous Wave 4, adding further support per Elliott guidelines.
If price enters that support zone and I see a complete corrective structure (flat or triangle), that’s my green light to enter.
If all the above conditions are met, I’ll post a follow-up with my exact entry strategy.
🧠 Final Thoughts: Flexibility Is Key
While this plan is structured, the market is dynamic. Patterns evolve. Counts can shift. The key is to stay objective, recognize when the scenario changes, and adapt quickly.
Elliott Wave trading is not about perfection, but about anticipation, risk control, and reacting intelligently as price unfolds.

Solana(based on NEowave)I consider this as a triangle but under the price zone which is 139 it tells us its going to make a diamond diametrical.

Hellena | EUR/USD (4H): LONG to the resistance area 1.14048.Dear colleagues, it appears that this week started with a downward movement. It was decided to replace the last forecast with a new one, because the price is updating the minimum of wave “4”, now the formation of wave “c” of medium order is taking place.
I believe that the upward movement to the area of 1.14048 will start again and we have 2 options:
1) market entry
2) working with pending limit orders closer to the 1.09794 area.
Manage your capital correctly and competently! Only enter trades based on reliable patterns!

Hellena | GOLD (4H): LONG to resistance area of 3439.37.Colleagues, Last time, I suggested that the five-wave movement was not yet complete. It seems that this is indeed the case.
Wave "5" of the higher degree is unfolding, and I expect the price to reach the resistance area around 3439.37, which marks the top of wave "X".
Within the smaller five-wave structure, I believe wave "3" is currently in progress.
A correction toward the 3248.38 area is possible.
Manage your capital correctly and competently! Only enter trades based on reliable patterns!

Hellena | SPX500 (4H): SHORT to 38.2% - 50% Fibo lvl 5489.Colleagues, I have reviewed the waves a bit and I believe that when the strong psychological level of 6000 is reached, a reaction and correction in wave “2” is possible.
I propose to consider this movement as a strong five-wave movement. Wave “1” will be over soon.
I consider the 38.2% - 50% Fibonacci levels of 5489 to be the main target of the correction.
Manage your capital correctly and competently! Only enter trades based on reliable patterns!

EURUSD Breaking Above Resistance Line; Wave 5 In PlayEURUSD moved nicely higher in April, into the 1.15–1.16 area, a resistance where pair slowed down at the end of wave 3, that put retracement in play. However, a pullback has been made in three waves, so its seen as temporary within the broader uptrend. We saw some deeper retracement down to 1,1, near the 38.2% Fib from where we can see some nice turn up, above the trendline resistance so it appears that bulls are in play for wave 5. Therefore, be aware of more upside afte some intraday dips. Support is at 1.1266 area.
GH

$MSTR Is Preparing For A Dive...NASDAQ:MSTR : We cannot ignore the downside risks at this point. With $430.35 intact, NASDAQ:MSTR is poised for a significant downward move toward the March lows or lower to complete wave (C) of a simple zigzag correction.
