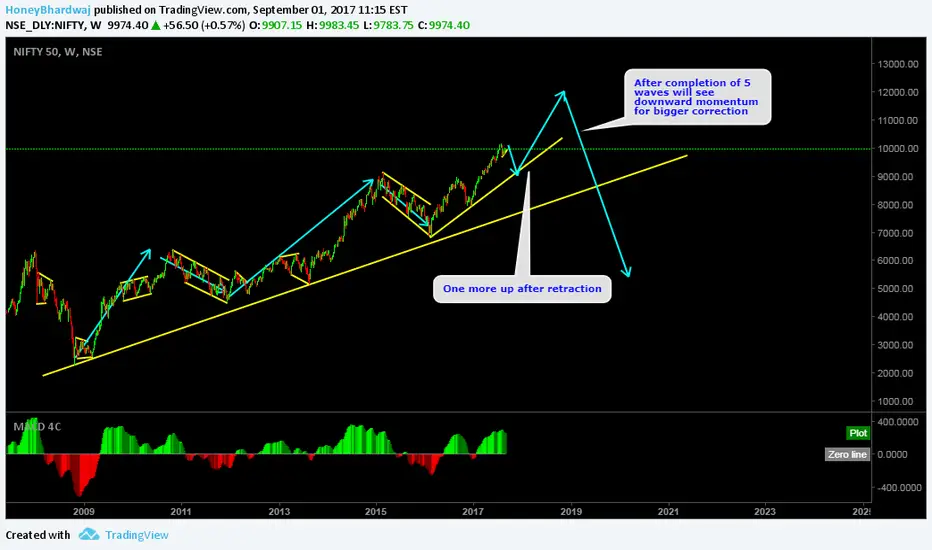
Nifty elliott wave analysis, one more impulse after correction.Hi Guys, This is analysis cum educational ideas, nifty has one more up rally inside its 5th wave of bigger 5th wave of impulse. current downside movement will be correction, after that rally nifty will go into deeper correction, some may call it as crash but it will be just bigger monthly corrective phase as third wave completes.
Elliotwavecount
NZDUSD Elliot Wave count ShortContinuation from my Weekly chart .
We are in complex structure WXY = To complete Major wave B
Last 2 Legs of this wave Y and we are done with it .
2nd Last B = in abc
where a = 12345 b = abc c= will be in 12345 ( 5 , 3 , 5 structure )
I am Short till 0.7060 / 0.7040 Level
Next is C to complete Major wave B
What soever c shape form I will be long from 0.7050 till 0.78000 Level.
Elliot wave By mazchaudhry

AUSNZD Elliot Wave count ShortAt this moment we are in Triangle/ diagonal (abcde )
where ( c ) is near to finish at 1.11000 level
I am short on this Pair from 1.11000 Level till 1.05000 level for (d)
I would be chasing (e) to complete 4th wave .
Wish all of my followers many happy Green Pips .

AUSJPY Elliot Wave Count Long Daily ChartTo complete C of X till 95.25
I am Long
Now we in middle of C's 5th wave up .
Crystal Clear Trend .
I am Fully Sponsored to the Event .


GBP USD Wave count Wave 4 in Progress = ABC
Division ABC of wave 4 as follows :::
A is complete in 12345
B is in Progress ABC ( in Blue ) will be complete at 1.1960
C will be Long in 12345 to Complete wave 4 at 1.2960 ( Expected )
So Lets consider Long Right from 1.19600 till 1.29600
Regards
Elliot Wave By mazchaudhry
Trade at your own risk

NAS100 - the first one to go for wave 4 NAS100 is the first one that go to wave 4 -
the end of wave 4 might be there, however it is possible it has another set of wave within the channel to go to fib ext 1- 5470 .
First target up (within the channel) 5750

Possible Flat correction...Hi All,
Ive been racking my brains to see why EUR keeps rallying even though maximum fib extensions of 686% has been reached; but I think I have a possible solution which makes perfect sense!
IT'S A FLAT CORRECTION!!!!!! (3-3-5)
In the bigger picture from my previous post, I am expecting a bigger ABC correction to close the gap which I think is still happening due to the nature of the previous impulse wave reaching the max fib extensions as I mentioned above signifying a move has finished. In terms of how this current move fits into that scenario, wave (a) and (b) are complete and (c) is currently in play to complete the flat - once (c) wave is done, the bigger wave A will be complete.
We have a few big USD announcements (NFP in particular) this week which could help to push this pair down as EUR is extremely overbought.
Let's see what the next 2 days of trading brings as my shorts are still holding nicely.
Happy Trading!
Don

USDJPY Short Opportunities DetectedUSDJPY bias is still heavily short. Wave structure unfolding as expected and has stretched beyond the 1.618 target. This suggests current price behavior is brief pause in present downward trend. Looking for further short opportunities in current pseudo-rally.


EURUSD ShortGreetings,
Price reached an interesting position as you can see on the chart. I expect a corretion to the downside. Price still does have some steam so be cautious if you want to short this.
Goodluck


Short Dax - H&S & losing momentum Head and shoulders pattern is emerging. Expecting a significant C wave correction (Elliott wave count).
Short entry: 11724
Take profit 1: 11336
Take profit 2: 11183
Stop loss: 11906
-------
RRR: 3+

EUR/JPY longThis trade has been just beautiful,our latest Elliot Wave study just gave us a crazy run from 123.3 down to a line in the sand at 119.80
It will take some serious pressure to break the next 1st stop, so anything breaking 119.2 we are officially into final Wave5 and down we go. Otherwise enjoy the next a,b,c into the 122 area.

EUR USD Long Till 1.08500Hello to all
Wave C is still unfolding it self .
After 4th unfold in abc
5th Leg is unfolding at this moment
Hopefully it will end up in 12345 at 1.08500
At this moment it is in 5th extended wave .
In my opinion there are still some 100 pips in it to long side .
Thanks for support and following .

Bullish Long term EURAUDThe price has finished the 12345 Elliot wave. We can see a descending triangle, now I'm looking for a long to the target of 1.4140.

EUR USD LongEur USD Long Till the end of Wave 4 in abc
Target is clear at 1.07750
Feel Free to Ride the Trend
Elliot Wave By mazchaudhry
Trade at your own Risk .


EUR GBP ShortWave 4 is ending at 0.8775
With the completion of C in 12345
EUR GBP Short is active at 0.87750
Regards

US Oil Short Weekly Chart Monthly chart already Published
Here is my Weekly chart with Bit more explaining the short wave .
Short From 56.50 till 20.00 will be in ABC Formation ( As it is a Corrective Pattern )
Further division of ABC as bellow :
A= 12345
B= abc
C = 12345
Trade Plan ::
Lets wait for the Completion of X at 56.50
I will wait for (i)of A to complete
(ii) of A will be a Pullback there after a Congestion
I am going to enter into short trade at start of (iii)of A
many happy green pips to you all
Elliot Wave By mazchaudhry
Trade at your own Risk .

US OIL Short I am Short from 56.50 Till 20.00 For 2017
See the Elliot wave pattern on the Chart
Self explaining my Short .
All Corrective WXY X WXY X WXZ Ending at 20.00
Elliot Wave By mazchaudhry
Trade at your own risk .

US OIL US OIL Wave Pattern ( Corective Pattern )
Instead of making a 12345 Down wards ,,It made a ABC = X
Conclusion :::
It is in upward movement in WXZ Pattern .
So I am Long in US Oil till 56.5
Regards
Elliot Wave By mazchaudhry
Trade at your own Risk
