INVERSE CUP AND HANDLE $TSLA TO $120 The inverted cup and handle, also known as the upside-down cup and handle pattern, is a bearish chart formation that can occur in both uptrends and downtrends. Unlike the traditional bullish cup and handle pattern, this inverse pattern features two key components: the "cup," which forms an inverted U-shape, and the "handle," a brief upward retracement following the cup.
Sell NASDAQ:TSLA right now with fact check:
brand reputation risk, high competition, loss of EV market leadership, cyber truck/ product recalls, declining sales with lower margin, stock volatility concern, insider selling, investors buy it based on expected future earnings rather than its current profitability.
+ Head and shoulder/ inverse cup and handle, P/E ratio 79.8-161.23 (overpriced), falling knife, dead cat bounce, the lowest target estimate stands at $120.00, below the 50-day, 100-day, and 200-day moving averages, MACD indicator is -19.8, bearish signals.
+ potential stagflation, tariff war, slow economic growth, inflation, rising public debt, geopolitical tensions, ai bubble, and more
ELON

$TSLA RETEST $250 TO CONFIRMThe NASDAQ:TSLA experienced a rapid surge without any accompanying news.
It's expected to retest the $250 level, after which a further evaluation will be necessary to determine its next move.
SELL NOW AND BUY LATER

OH NO GUESS WHAT I FOUND $TSLA HEAD AND SHOULDERThe head and shoulders pattern is a chart formation in technical analysis that signals possible trend reversals, often suggesting a change from a bullish to a bearish trend. It features three peaks: a central "head" that is the highest, flanked by two "shoulders," with a neckline connecting the troughs between these peaks.
Tesla's stock is often viewed as a risky investment for several reasons:
High Valuation: NASDAQ:TSLA stock price is considered very high compared to traditional car manufacturers, with a much higher price-to-earnings ratio.
Market Volatility: The NASDAQ:TLSA price is highly volatile, influenced by factors like CEO Elon Musk's public comments, regulatory changes, and overall market sentiment.
Intense Competition: The electric vehicle market is becoming more competitive, with many established and new companies investing heavily in EV technology.
Production Issues: Tesla has experienced production and supply chain challenges, which can affect its ability to meet demand and maintain profitability.
Regulatory Risks: Changes in government policies and regulations, especially those related to environmental standards and EV incentives, can significantly impact Tesla's business.
While these points highlight potential risks, Tesla also has strengths such as strong brand recognition, technological innovation, and leadership in the EV market. It's important to consider both the risks and potential rewards when evaluating Tesla as an investment.
SELLL NOW!!!!!

EASY $280Hey, I'm back with $TSLA.
Buy now! It will reach $283 soon.
+ Let's see if NASDAQ:TSLA breaks $283.
I don't need to explain why it will rise again cause the selloff has been too intense (oversold), and all the bad news is already factored in.
We buy in fear and sell in greed

GOLD market Update: BUY DIPS 2990 USD TP 3100 USD🏆 Gold Market Update / Wednesday
📊 Technical Outlook
🔸Bullish OUTLOOK
🔸5 waves Bullish Sequence on H1
🔸2846/2930 w1, 2930/2887 w2, 2887/3045 w3
🔸3045-3055/2980-2990 wave 4 pullback now
🔸2980-2990/3100 - final wave 5 pump
🔸Recommend to BUY DIPS 2980/2990 USD
🔸Price Target BULLS: 3100 USD in Wave5
🏆🔥 Latest Gold Market Update – March 2025 🔥🏆
🚀 Gold Prices Hit New Highs!
💰 Gold Breaks $3,040+ – Soaring to record levels as investors seek safe-haven assets. 🏦✨📈
📊 Analysts Raise Targets – UBS forecasts $3,200 by June amid strong bullish momentum. 🔮💎
🌎 Key Market Drivers:
⚠️ Geopolitical Tensions Rising – Middle East conflicts fuel gold’s safe-haven appeal. 🌍🔥
📉 Stock Market Volatility – Investors flee equities, boosting gold demand. 📊📢

BTCUSD Daily Updated Outlook and V-Shape Recovery
🏆 BTC Market Update
📊 Technical Outlook
🔸Mid-term: BEARISH OUTLOOK
🔸Status: 40% correction in progress
🔸Potential V-shape recovery
🔸Similar fractal to 2021
🔸105 000 - 68 000 40% correction
🔸68 000 - 118 000 - 80% gains
🔸Price Target Bears: 68 000 USD
🔸Price Target BULLS: 118 000 USD
📉 Market Dynamics:
💰 BTC Pulls Back – Bitcoin corrects 🔻22% from its all-time high, but analysts see a potential rebound ahead. 📊📈
🏦 Institutional Power Play – MicroStrategy holds nearly 500K BTC at an average price of $66K, planning to buy more with a $21B stock issuance. 📉💎
🌎 Global Bitcoin Developments:
🇧🇹 Bhutan's Secret Stash – The country holds $750M in BTC, making up 28% of GDP, powered by hydro-mining. ⚡⛏️
⚖️ U.S. Crypto Regulations – Stricter rules under President Trump aim to integrate crypto into traditional finance. 📜🏦
🕵️♂️ Satoshi Mystery Continues – New theories emerge about Bitcoin's anonymous creator. 🤯🔍

GOLD H1 Update: Bullish Outlook BUY DIPS by ProjectSyndicate🏆 Gold Market Highlights (March 2025)
📊 Technical Outlook
🔸Bullish OUTLOOK
🔸Broke out and set new ATH
🔸Strong UPTREND: Sequence of Higher Lows
🔸Recommend to BUY DIPS 2925/2950 USD
🔸Price Target BULLS: 3050 USD - 3100 USD
📈 Historic Milestone Achieved
🏅 Gold Futures Surpass $3,000
🔥 Gold prices hit an all-time high, closing above $3,000 ATH
🚀 Major breakout in the precious metals market!
📊 Analyst Perspectives
🔮 Continued Bullish Sentiment
📉 Both Wall Street & Main Street expect further gains beyond $3,000.
💡 Analysts see upside momentum continuing in the coming weeks.
🌍 Market Dynamics
⚡ Factors Driving the Rally
🌎 Global trade tensions & geopolitical risks pushing investors toward gold.
📌 Safe-haven demand surging amid uncertainty.
⏳ Historical Context
📜 Comparisons to the 1980 Bull Run
🔄 Parallels drawn between the current rally and the historic 1980 surge.
❓ Can gold repeat history and extend its gains even further?
🏦 Global Demand Trends
🇨🇳 China’s Record Gold ETF Inflows
📈 Massive inflows into gold ETFs in China, signaling strong demand.
💰 Jewelry demand expected to stabilize as the economy recovers.
🏦 Investor Behavior
🎯 Increased Attention Amid Uncertainty
🏛️ Investors shifting focus to gold as a hedge against economic instability.
💎 Gold’s safe-haven status reaffirmed, attracting more institutional buyers.
📢 Final Takeaway:
🔹 Gold is shining brighter than ever! 🌟
🔹 Expect volatility, but long-term outlook remains bullish. 💹
🔹 Keep an eye on key resistance & support levels. 🔍

DOGE RUN IS OVER! TAKE PROFITS OR HOLD YOUR BAGS TILL 2025!Its clear that the doge run is pretty much over. DOGE is headed back down to $.05 and possibly lower over the next few years to maybe below 1 cent, till the next potential crypto run around 2025. These little pumps from Elon and friends is all just a joke so they can empty their bags and have the liquidity to do it while everyone else is buying in to these hypes. I said this weeks ago if you look at my other chart that this thing needs years to consolidate and correct. It outpaced the market in its run and went straight up and in this market anything that goes straight up comes straight down. Also there is no use case and DOGE is not being used, this is all a hype run and a get rich quick pump and dump. Once the rest of the market starts the next run up DOGE may have a bounce but only in dollar value as everything is pegged to Bitcoin but its BTC/DOGE ration will fall. If you believe in the tech then hold your bags and stop looking at the price. If you are just trying to make some money then this may be the time to get out and take profits if you haven't already or cut your losses if you bought in at the top. Good Luck.
If you have any questions or just appreciate this idea then leave me a comment. Follow me for frequent updates as well and if you have a chart you would like me to look at then let me know. Thank you all and good luck.
NOT FINANCIAL OR TRADING ADVICE JUST MY OPINION.

EURUSD UPDATED Strategic Outlook 2025: 0.9000 PT BEARS 📉 **EUR/USD Weekly Outlook Update**
🔹 **Downtrend Intact**: The **EUR/USD** downtrend has been well-defined since **2009**, and a recent **strong rejection** after a period of distribution confirms bearish momentum.
🔹 **Technical Target 🎯**:
- **Short-term Outlook**: EUR/USD is set to hit **0.95** by **summer 2025**.
- **Year-End Projection**: Expected to end **2025 at 0.9000**.
- **Upside Cap**: Limited to **1.13** at most in 2025.
🔹 **Key Reasons for Further Decline** 📉:
- **Strong USD (DXY Strength) 💪**
- **Firm U.S. Political Leadership 🇺🇸** vs. **Weak EU Leadership 🇪🇺**
- **Fragile Eurozone Economy 🏦**
## 📊 **Why the Eurozone is Set for Further Decline**
🔻 **Slow Economic Growth ⏳**
- The **Eurozone's economy** is growing at a sluggish pace compared to other regions.
- **Weak domestic demand**, **low productivity growth**, and **high export dependency** on slower-growing markets (e.g., China 🇨🇳) weigh on investor confidence and euro demand.
🔻 **Demographic Challenges 👴📉**
- Aging populations in **Germany, Italy, and Spain** reduce the labor force.
- Higher pressure on **social services & pension systems** slows long-term growth potential.
🔻 **High Energy Prices & Inflation 🔥📊**
- The **energy crisis** (exacerbated by the Russia-Ukraine war 🇷🇺🇺🇦) raises business costs.
- **Inflation remains high**, limiting the **ECB’s ability** to stimulate growth without worsening price pressures.
🔻 **Geopolitical Tensions & Economic Risks ⚠️🌍**
- The **Ukraine war & energy disruptions** hit Europe harder than other regions.
- **Reliance on Russian energy** led to severe **supply shocks**, further weakening the eurozone economy.
🔻 **Eurozone Structural Issues 🏗️❌**
- Economic **imbalances between member states** (Germany & France strong, Italy & Greece weak).
- **Common monetary policy** limits individual governments’ ability to react to crises.
- **High debt burdens** in weaker economies drag down overall performance.
🔻 **Tight Fiscal Policies 💰🚫**
- **EU fiscal rules** restrict deficit spending, limiting government stimulus efforts.
- **Lack of fiscal unity** prevents stronger coordinated responses to economic downturns.
📌 **Bottom Line for EUR/USD Traders**
✅ The **downtrend remains dominant** 📉.
✅ **Technical & fundamental** factors favor a **weaker euro**.
✅ Expect further declines **toward 0.95 by summer & 0.90 by year-end**.
✅ Limited upside beyond **1.05** in 2025.
🚀 **Stay updated & trade wisely!** 💹

Forex Trend Trading: A Complete Guide for Traders📊 Market Structure: Uptrend vs. Downtrend
🔼 Uptrend Market Structure (Higher Highs & Higher Lows)
Price makes higher highs (HH) and higher lows (HL).
Indicates buyers are in control.
Traders look for buying opportunities at key support levels.
Example Structure:
📍 HH → HL → Higher HH → Higher HL (trend continuation).
🔽 Downtrend Market Structure (Lower Highs & Lower Lows)
Price forms lower highs (LH) and lower lows (LL).
Sellers dominate the market.
Traders look for selling opportunities at resistance levels.
Example Structure:
📍 LL → LH → Lower LL → Lower LH (trend continuation).
📌 Steps to Trade Trends Effectively
1️⃣ Identify the Trend
✅ Use a higher timeframe (H4, D1, W1) to determine the major trend.
✅ Look for HH & HL (uptrend) or LH & LL (downtrend).
✅ Use trendlines, moving averages, and price action for confirmation.
2️⃣ Find Key Support & Resistance Levels
✅ Use previous swing highs and swing lows to mark key levels.
✅ Identify trendline support & resistance zones.
✅ Look for breakouts or retests for entry confirmation.
3️⃣ Use Technical Indicators for Confirmation
🔹 Moving Averages (MA) – 50 EMA & 200 EMA for trend direction.
🔹 RSI (Relative Strength Index) – Overbought (>70) or Oversold (<30) for trend exhaustion.
🔹 MACD (Moving Average Convergence Divergence) – Confirms trend strength & momentum.
4️⃣ Plan Your Entry & Exit Points
✅ Entry Strategy:
Buy at higher lows (HL) in an uptrend.
Sell at lower highs (LH) in a downtrend.
Use candlestick patterns (pin bars, engulfing candles) for confirmation.
✅ Exit Strategy:
Place Stop Loss (SL) below last HL (uptrend) or above LH (downtrend).
Use Take Profit (TP) at key resistance/support levels.
Consider trailing stop losses to maximize gains.
5️⃣ Risk Management & Trade Execution
✅ Risk-to-Reward Ratio (RRR) – Aim for at least 1:2 or higher.
✅ Position Sizing – Risk only 1-2% of your capital per trade.
✅ Monitor Trade – Adjust SL/TP as the trade progresses.
🎯 Trend Trading Strategies
📌 Pullback Trading
Wait for a retracement to a support/resistance level.
Enter at key Fibonacci levels (38.2%, 50%, 61.8%).
Confirm with price action signals.
📌 Breakout Trading
Enter when price breaks a major resistance (uptrend) or support (downtrend).
Wait for a retest of broken structure before entering.
Avoid false breakouts using volume confirmation.
📌 Trendline Trading
Draw trendlines connecting HLs (uptrend) or LHs (downtrend).
Enter when price bounces off the trendline in the direction of the trend.
⚠️ Common Mistakes to Avoid
❌ Trading against the trend without confirmation.
❌ Ignoring risk management and overleveraging.
❌ Entering too late in an extended trend.
❌ Ignoring economic news & fundamental factors.
📌 Final Thoughts
✅ Trend trading is a powerful strategy when used with proper market analysis.
✅ Always confirm trends with technical indicators & price action.
✅ Stick to your plan, manage risk, and stay disciplined for long-term success.
🔹 Happy Trading & Stay Profitable! 🚀📊

Dogelon Mars Set For Price Reversal Amidst Steep Falling Wedge Dogelon Mars is a dog-themed meme coin built on the Ethereum and Polygon chain, following the example of other successful dog coins like Dogecoin, Shiba Inu and Floki Inu is set for a price reversal after surging 250% in the Month of January 17th, 2025 before quickly retracing.
Chart pattern shows an impending 400% surge coming up on the horizon. With partnerships from top blockchains like Arbitrum, Orca, Houbi, OKX, Solana, etc. AMEX:ELON coin is set to be on a bullish course with a 400% surge in sight.
Dogelon Mars has had a market cap of $1.25 billion in the year 2021 before retracing to $72.5 Million in market with increasing momentum and an active telegram community AMEX:ELON is very much ready for the next legged-up.
About Dogelon Mars
Dogelon Mars plays on several popular themes in the meme coin space. Its name is a mixture of Dogecoin and Elon Musk, the billionaire entrepreneur who is an outspoken supporter of Doge. It alludes to Mars, a spin on the famous moon meme, implying that Dogelon will experience a massive upward movement. Beyond its tongue-in-cheek name, Dogelon Mars has managed to build a significant community, with more than 494,000 Twitter followers and more than 48,000 followers on Telegram.

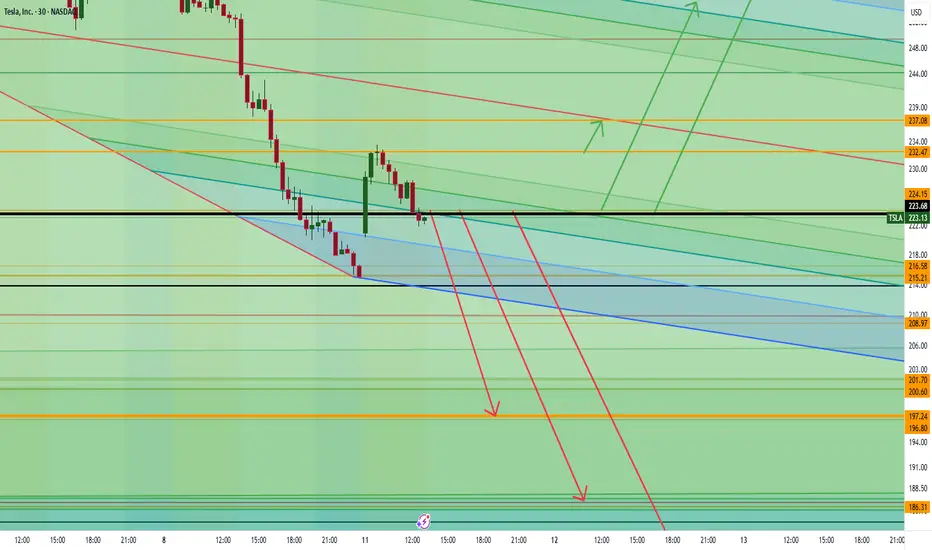
Tesla is About to Collapse… or Skyrocket—Are You In?Tesla is all over the news with boycotts, drama, and market chaos, but the real action is on the charts. If we break below 222, things could get ugly fast with a drop toward 197, 186, and even 176. But if we hold above 223, momentum could send us flying past 232, 237, and potentially 256 or even 264.
Big money is watching, and the next move could be massive. The question is—are you trading this or just watching from the sidelines?
Kris/ Mindbloome Exchange
Trade Smarter Live Better
ELON BUYHello friends
Given the price reaching resistance and the long price correction, now is a good opportunity to buy...
Here we suggest you buy step.
We have also specified price targets for you.
*Trade safely with us*

Bounce or Sustained Rally-Either will be Sufficient Tesla chart on weekly and daily timeframe. Bounce is likely incoming, at best a sustained rally.

xrpusd H4 Best Level to BUY/HOLD +40% gains🔸Hello guys, today let's review 4hour price chart for XRP. Outlook remains bullish currently pullback in progress, however buying low still is a perfect trade setup with low risk.
🔸XRP is currently in pullback/correction mode after the re-test of ATH.
limited upside at current market price 2.50 usd, pullback not complete.
🔸Recommended strategy bulls: BUY/HOLD 2.00 usd, TP 2.80 USD.
40% unleveraged gains. swing trade setup, patience required. good luck.
🎁Please hit the like button and
🎁Leave a comment to support our team!
RISK DISCLAIMER:
Trading Futures , Forex, CFDs and Stocks involves a risk of loss.
Please consider carefully if such trading is appropriate for you.
Past performance is not indicative of future results.
Always limit your leverage and use tight stop loss.

Supply and Demand Zones Trading in Forex: A Detailed OverviewSupply and demand zones are a core concept in price action trading, helping you spot areas of strong buying or selling interest. Mastering these zones can help you predict reversals, breakouts, and continuations with high accuracy. Let’s dive in! 🚀
🧠 What are Supply and Demand Zones?
📉 Supply Zone (Bearish): An area of high selling pressure where price tends to drop. It forms when sellers overwhelm buyers.
📈 Demand Zone (Bullish): An area of high buying pressure where price tends to rise. It forms when buyers overpower sellers.
These zones act like magnets for price — when price returns to these levels, you often see strong reactions.
🗂️ Characteristics of Strong Zones
✅ Sharp Price Movement: Strong supply and demand zones create fast and aggressive price moves away from the area. 💥
✅ Multiple Rejections: The more times a zone holds and rejects price, the stronger it is. 🛑
✅ Freshness: The first retest of a fresh zone often yields the strongest reaction. 🆕
✅ Volume Spike: Higher volumes show genuine interest from large players. 📊
🎯 How to Identify Supply and Demand Zones
1️⃣ Find Strong Moves: Look for big bullish or bearish candles after a consolidation or small pullback.
2️⃣ Mark the Base: Draw a rectangle from the start of the strong move to the end of the consolidation.
3️⃣ Adjust for Wick/Body: Include the entire wick for aggressive zones or just the body for conservative zones.
📈 Bullish Supply and Demand Zone Strategies
1️⃣ Demand Zone Bounce (Buy Setup)
🛑 Identify: A clear demand zone with a strong bullish move away.
📉 Wait: For price to return to the zone.
🕯️ Confirm: With a bullish candlestick pattern (like Hammer, Engulfing).
🎯 Enter: A buy order at the zone’s edge.
🛡️ Stop Loss: Below the zone’s low.
🏁 Target: Nearest supply zone or strong resistance.
💡 Example: Price rallies from 1.2000, pulls back to the same zone, then forms a bullish engulfing — you buy.
2️⃣ Demand Zone Breakout (Continuation Setup)
🛑 Identify: A demand zone forming a higher low in an uptrend.
💥 Breakout: Wait for price to break the supply zone above.
📉 Retest: When price retests the broken supply (now demand), enter long.
💡 Example: Price breaks 1.2500 resistance, retests it, and bounces higher — you enter.
📉 Bearish Supply and Demand Zone Strategies
3️⃣ Supply Zone Rejection (Sell Setup)
🛑 Identify: A clear supply zone with a strong bearish move away.
📈 Wait: For price to return to the zone.
🕯️ Confirm: With a bearish candlestick pattern (like Shooting Star, Engulfing).
🔻 Enter: A sell order at the zone’s edge.
🛡️ Stop Loss: Above the zone’s high.
🏁 Target: Nearest demand zone or strong support.
💡 Example: Price spikes up to 1.3000, then drops sharply — on a retest, you short.
4️⃣ Supply Zone Breakout (Continuation Setup)
🛑 Identify: A supply zone forming a lower high in a downtrend.
💥 Breakout: Wait for price to break the demand zone below.
📈 Retest: When price retests the broken demand (now supply), enter short.
💡 Example: Price breaks 1.1800 support, retests it, and drops further — you enter short.
🛠️ Tools to Enhance Supply and Demand Trading
🧰 Support & Resistance Levels – Combine zones with horizontal levels for added confluence.
📐 Fibonacci Retracements – Zones aligning with Fibo levels are extra strong.
📉 Trendlines – A zone break + trendline retest makes a powerful entry signal.
📊 Volume Analysis – High volume confirms genuine buying or selling pressure.
⏳ Timeframes & Zone Strength
⏱️ Higher Timeframes (4H, Daily, Weekly):
Stronger & more reliable zones.
Great for swing trading.
⏱️ Lower Timeframes (5M, 15M, 1H):
More frequent but weaker zones.
Ideal for day trading or scalping.
⚠️ Common Mistakes to Avoid
❌ Forcing trades: Not every zone gives a valid signal — be patient.
❌ Ignoring context: Always follow the trend unless there’s clear reversal evidence.
❌ Skipping confirmation: Wait for candlestick patterns and rejections.
❌ Poor risk management: Always set a stop loss and manage position size.

Nicest setup I’ve seen in a while-Not complicated; why make it?Tesla with perfect technically sound pattern
Five or six things coming together, including a perfect tag of the breakout line, a perfect tag of the long-term uptrend line a Bollinger band crash perfect tag of the Fibonacci .62
It’s like a perfect set up
Not very complicated; why make it complicated?

Quick 4-Min Tesla Analysis: Deeper Pullback or Ready for LiftoffJust wrapped up a quick Tesla analysis (under 4 min)! Right now, we could see a dip to the $289 zone before pushing higher, or a deeper move down to $250 before driving up toward $475.
Where do you think Tesla is headed next? Let me know your thoughts!
Kris/Mindbloome Exchange
Trade Smarter Live Better

Since DOGE is pretty hot at the moment... It's also pretty in the middle of a longer range of price action range with no real reward and a lot of risk to be found at this price point.
You can look at it technical, you can say it's due to politics (like that has always been a solid in the past...), you can blame it on the fomo and the news...
You always have a choice when to act and what to do when you act. Just be smart about it ;-)
Cheers!

+200 pips Best Level to Short EURUSD from Resistance🔸Hello traders, let's review the H4 chart for EURUSD today. Trading
near premium prices of the multiweek range, closing in on heavy S/R
Currently risk/reward is shifting in bears favor, so it's recommended
to look for sell side setups in EURUSD.
🔸Premium prices at 0500/0535, below at 0225/0190. range highs 0470
and range lows set at 0250. trading near premium prices.
🔸Recommended strategy for EURUSD traders: focus on short selling any rips/rallies or short sell at market price EURUSD is currently trading near premium levels and is almost maxed out already, limited upside. TP1 bears +100 TP2 bears +200 pips final exit 0225 keep in mind this is a swing trade setup so naturally will take more time to complete / hit both targets. good luck traders!
🎁Please hit the like button and
🎁Leave a comment to support our team!
RISK DISCLAIMER:
Trading Futures , Forex, CFDs and Stocks involves a risk of loss.
Please consider carefully if such trading is appropriate for you.
Past performance is not indicative of future results.
Always limit your leverage and use tight stop loss.

Best Level to BUY/HOLD BTC TP 105 000 USD Swing Trade Setup🔸Hello traders, today let's review 3hour price chart for BTCUSD . we are still
stuck in range since December, range highs at/near 108k, range lows at 90k.
however currently expecting fake breakdown of defined range before reversal.
🔸Bulls/Bears fight in the range is about to come to an end with a fake breakdown
of the recent/defined range, and prompt reversal and re-test of range highs.
🔸Bitcoin is stuck in unproductive range since December 2024, right now
drifting lower on autopilot, currently no viable trade since we are stuck.
Tech overshoot levels: 87 500, 85 000, 82 500. That's the levels we the probability
of reversal / throwback inside range is the highest.
🔸Recommended strategy: BUY LOW near tech overshoot levels 2/3 and exit/TP
near recent range highs, TP BULLS 105 000 USD. Best entry near 82500/85000 USD.
good luck traders!
🎁Please hit the like button and
🎁Leave a comment to support our team!
RISK DISCLAIMER:
Trading Futures , Forex, CFDs and Stocks involves a risk of loss.
Please consider carefully if such trading is appropriate for you.
Past performance is not indicative of future results.
Always limit your leverage and use tight stop loss.

300% gains BONK Best Level to BUY/HOLD swing trade setup🔸Hello guys, today let's review daily price chart for BONK. Outlook remains bullish currently pullback in progress, however buying low still is a perfect trade setup.
🔸BONK is one of the top rated solana meme coins. currently undergoing correction and still not complete, however risk/reward is shifting in bulls favor right now. we are close to the floor / reload zone for the bulls.
🔸Recommended strategy bulls: Price action contained within bullish channel. get ready to buy low near 11000/13000, TP is 33000/36000 +300% gain. BUY/HOLD setup for patient traders. keep in mind that BONK already got a heavy valuation, so do not expect miracle overnight gains.
🎁Please hit the like button and
🎁Leave a comment to support our team!
RISK DISCLAIMER:
Trading Futures , Forex, CFDs and Stocks involves a risk of loss.
Please consider carefully if such trading is appropriate for you.
Past performance is not indicative of future results.
Always limit your leverage and use tight stop loss.

Bullish & Bearish Reversal Divergence Trading in Forex🔍 Bullish & Bearish Reversal Divergence Trading in Forex: A Detailed Overview
Divergence is a powerful concept in technical analysis — it helps spot potential trend reversals and momentum shifts. Let’s dive into the details with clear strategies and some visual flair! 🚀
🧠 What is Divergence?
Divergence happens when price action and a technical indicator (like RSI, MACD, or Stochastic) move in opposite directions. This hints that the current trend is losing strength and a possible reversal is coming.
📈 Types of Divergence
🐂 Bullish Reversal Divergence (Buy Signal)
Price: Makes lower lows ⬇️
Indicator: Makes higher lows ⬆️
Meaning: Sellers are losing momentum; buyers might take over soon.
Signal: Potential uptrend reversal ahead.
🔑 Key Confirmation Tools:
Support zone bounce 🛑
Bullish candlestick patterns (Hammer, Engulfing) 🕯️
Increased buying volume 📊
💡 Example Setup:
RSI makes a higher low while price drops lower — prepare for a long (buy) position.
🐻 Bearish Reversal Divergence (Sell Signal)
Price: Makes higher highs ⬆️
Indicator: Makes lower highs ⬇️
Meaning: Buyers are losing strength; sellers could take control.
Signal: Potential downtrend reversal ahead.
🔑 Key Confirmation Tools:
Resistance zone rejection 🚧
Bearish candlestick patterns (Shooting Star, Engulfing) 🌑
Increased selling volume 📉
💡 Example Setup:
MACD makes a lower high while price pushes higher — prepare for a short (sell) position.
🛠️ Best Indicators for Divergence Trading
RSI (Relative Strength Index) – Tracks overbought/oversold conditions. 📊
MACD (Moving Average Convergence Divergence) – Measures momentum shifts. 💥
Stochastic Oscillator – Identifies trend strength and reversals. 🎢
🎯 Divergence Trading Strategies
1️⃣ Classic Divergence Strategy
Spot bullish or bearish divergence. 🔍
Confirm with support/resistance levels. 🧱
Wait for a reversal candlestick pattern (like a Doji, Engulfing, or Pin Bar). 🕯️
Enter trade with a tight stop loss below support (for buys) or above resistance (for sells). 🎯
2️⃣ Divergence + Trendline Break Strategy
Draw a trendline following the current trend. 📐
Spot divergence as the trend loses strength. 🚨
Wait for a trendline breakout for extra confirmation. 💥
Enter trade on the break and retest of the trendline. 💯
3️⃣ Divergence + Moving Average Strategy
Spot divergence between price and indicator. 📉
Use a moving average (MA) like the 50 EMA or 200 EMA to confirm the trend shift. 📈
Buy when price crosses above the MA after bullish divergence. 💚
Sell when price crosses below the MA after bearish divergence. ❤️
⚠️ Common Mistakes to Avoid
🚫 Ignoring confirmation: Always wait for candle closes or breakouts.
🚫 Forcing divergence: Only trade when divergence is clear.
🚫 Skipping risk management: Use a stop loss and position sizing.
🚫 Overtrading small timeframes: Higher timeframes (4H, Daily) offer more reliable signals.
