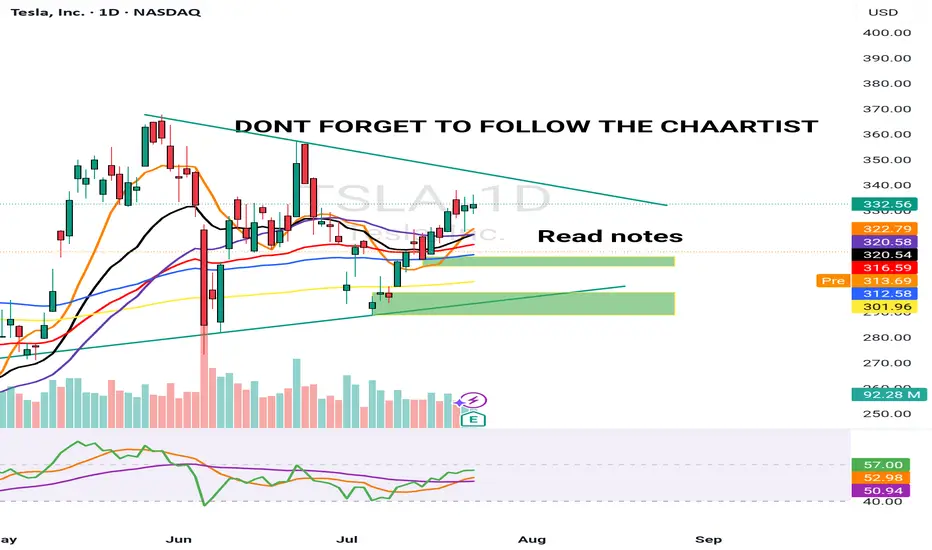
TSLA 24 JULY 2025I have marked 2 levels in green boxes. Price is inside this box pre market and TSLA is down -8.5% from the highs of $338 post market till $310 & -7.5% down from yesterday's close
A better level is the lower demand zone but its not the best. Price has not hit any major resistance.
My job is to read the data & trade. I am still bullish & 10% up down move is normal for Tesla &
This could be a "BEAR TRAP".
Elonmusk
TSLA Tesla Options Ahead of EarningsIf you haven`t bought TSLA before the recent rally:
Now analyzing the options chain and the chart patterns of TSLA Tesla prior to the earnings report this week,
I would consider purchasing the 350usd strike price Calls with
an expiration date of 2025-8-15,
for a premium of approximately $14.90.
If these options prove to be profitable prior to the earnings release, I would sell at least half of them.
Disclosure: I am part of Trade Nation's Influencer program and receive a monthly fee for using their TradingView charts in my analysis.

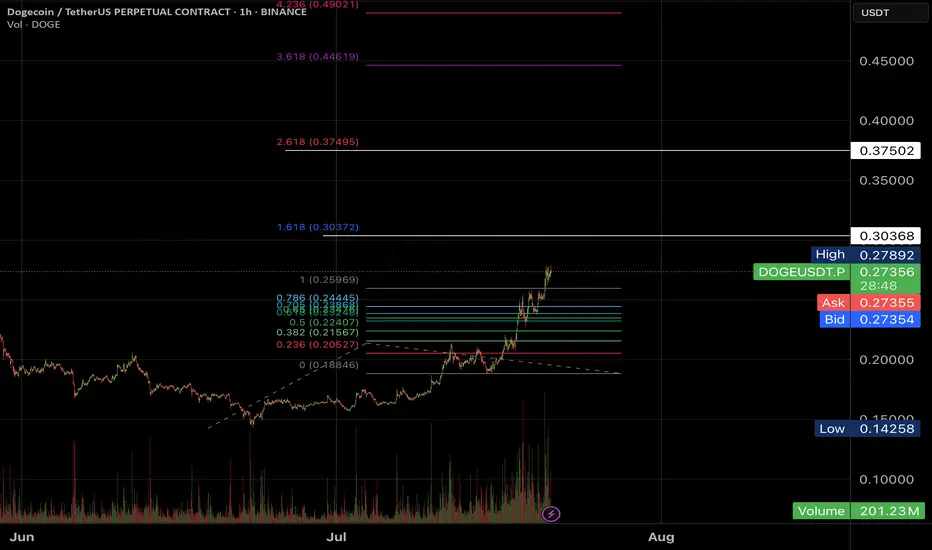
Are you looking for a short in #DogeHi Padawans,
BTC.D is dropping from 66% to 60%, and as expected, ALTs are starting to pump.
I’m keeping an eye on DOGE and will look to take some quick short scalps once it reaches the target levels.
Best regards,
CryptoObi
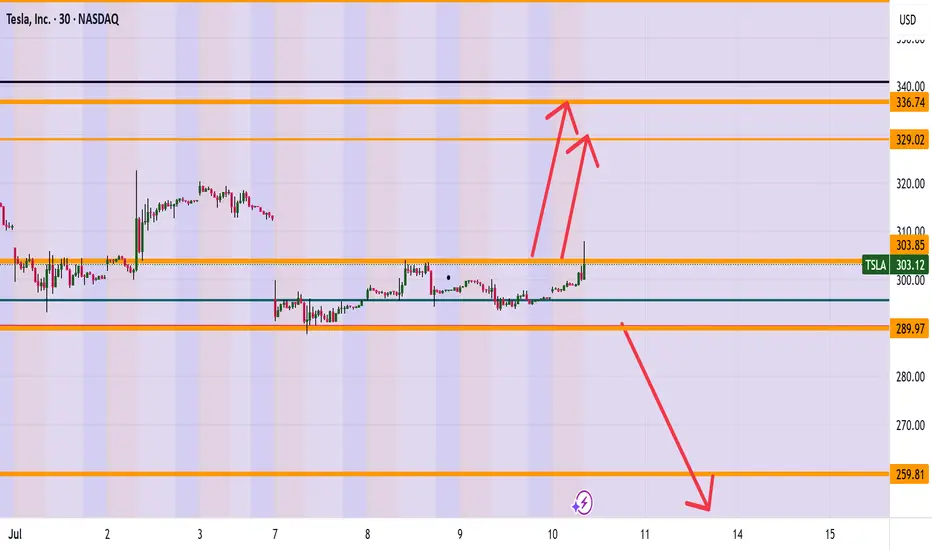
TESLA (TSLA) ARE WE HEADING TO 336? Morning Folks
It appears we are trying to break the highs of 304 and if we are successful a nice range up to 327-336 makes sense. However be careful if sink back down under 289 which then can see levels of 259 getting hit.
What are your thoughts on Tesla? Put in the comments section below
Kris Mindbloome Exchange
Trade Smarter Live Better
$TSLA Time to Fade or..?NASDAQ:TSLA (like NASDAQ:GOOG ) is standing out to me as bullish, yet, corrective Elliot Waves a higher degree series of ABCs appear to be underway.
A final wave C appears to be underway which would take price too all time highs in an expanded flat correction pattern. My count could be wrong and the interference could be from the increase it sentiment volatility connected to the US headlines lately and Trump posting on socials. Things may get back to normal after the summer and a clearer pattern may emerge.
Price is struggling to get past the weekly pivot point bullishly or the weekly 200EMS bearishly and is trapped within that range.
For now long term target is the R2 daily pivot at $693 as the higher probability is continued upside
Safe trading

MUSK on TRUMP's Bill | "outrageous, disgusting abomination"Elon Musk’s sided against the latest Trump-backed tax-and-spending package, in a plot twist between the recent partners turned enemies.
Musk called the legislation a “massive, outrageous, pork-filled Congressional spending bill” and a “disgusting abomination,” publicly shaming senators and representatives who backed it.
With such a strong opinion against it one may wonder, is this going to negatively affect Tesla?
Together with this strong reaction, the price has already been trading lower for the past few days.
The administration has defended it as the “One Big Beautiful Bill,” insisting it will stimulate growth, even though Elon Musk warned the bill would swell the U.S. budget deficit by roughly $2.3–2.5 trillion over the next decade, calling the added debt “crushingly unsustainable”.
When I first read this, it made me think of Tesla's long generated “green credits”, which in 2024 alone, brought in roughly $2.76 billion. “green credits” (officially, zero-emission or regulatory credits) work by building more clean vehicles than required and selling the excess allowances to other automakers that need them to comply with emissions mandates.
Now I'm no expert on US policy, and so I roped in GPT to help me explain how this new bill implicates TESLA's profit:
Under the Senate’s “big, beautiful” tax-and-spending bill, Tesla’s regulatory-credit business faces two assaults:
❗ Repeal of CAFE- and ZEV-mandates
The bill would eliminate penalties for automakers missing Corporate Average Fuel Economy targets and roll back zero-emission vehicle mandates that currently force legacy manufacturers to buy credits if they fall short. Remove those penalties and mandates, and there’s no structural need for credits—undercutting the very market that funds Tesla’s $2–3 billion-a-year credit-sales business
❗ End of consumer EV tax incentives
By phasing out the $7,500 new-EV credit (and the $4,000 used-EV credit) within months of enactment, the bill dampens U.S. EV demand overall. A smaller EV market means fewer opportunities for Tesla to leverage fleet-wide ZEV regulations against higher-emitting rivals—further squeezing credit prices and volume
Bottom line: Without CAFE/ZEV obligations and with EV purchase subsidies gone, Tesla’s “green-credit” line—a major profit driver in recent quarters—would likely collapse, removing a key buffer against manufacturing and pricing pressures.
This could be the beginning of a bear market for Tesla lasting throughout the rest of the Trump administration.
________________________
NASDAQ:TSLA

TESLA: Can double its price ($640) by the end of the year.Tesla is neutral on its 1D technical outlook (RSI = 51.064, MACD = 4.910, ADX = 24.971), consolidating for the past week, but remains over its 1D MA50 and 1D MA200 nonetheless. Since the major market bottom on January 6th 2023, it's been trading inside a Channel Up and this is its 3rd bullish wave. The 2 prior rose by +196.67% from the bottom of the pattern (despite the 2nd breaking marginally under it). Consequently, this suggests that Tesla can rise by +100% from the current $320 level, before the Channel Up tops (HH) again. We are bullish, TP = 640.
See how our prior idea has worked out:
## If you like our free content follow our profile to get more daily ideas. ##
## Comments and likes are greatly appreciated. ##

$TSLA | Robotaxi Launch Incoming? - Plan Rock Solid w/ 3 TradesNASDAQ:TSLA
Launch could be as soon as Sunday, June 22. However, Musk has emphasized safety as priority. There is the potential to undercut traditional taxi services at less than $0.20 per mile. Tesla’s government and military contracts are key growth drivers but further clash between Musk and President Trump could cause further volatility in price action. Long-term $271 is a critical price point. There are several ways to play Tesla:
* Range between $270 and $350
* $330 to $400 into price discovery
* Breakdown under $270 targeting $212 and $204

TSLA Short Entry | Recession UnderwayI have added to NASDAQ:TSLA short.
I have also linked my previous Tesla short chart from 2022.
Nothing has changed with Tesla. The company is severely over-valued.
I will continue to provide updates.

09/06/25 Weekly OutlookLast weeks high: $106,812.33
Last weeks low: $100,372.93
Midpoint: $103,592.63
Billionaire spats and V-shaped recoveries, the beginning of June starts off in an interesting way. As President Trump goes forward with "The big beautiful bill" Elon Musk lets his feelings be known publicly sending shockwaves throughout markets, but what does this mean for Bitcoin?
The bill could add $3-5T in US government spending which is great for risk-on assets as there is more money able to flow into markets. I believe this exact thought process is visible on the chart in the V-shaped recovery we can see on Thursday. A clear sell-off as Elon Musk's anti government spending views clash with the bill, the uncertainty causes a sell the news moment, just as BTC comes into $100,000 the dip is bought up on the realization this means greater inflows are on the way, dips are truly for buying at this stage in the cycle and to me, this proves it.
In a more bearish view of the chart I would say the clear resistance is now weekly high at ~$106,000. Anything above that meets huge selling pressure with price discovery on the other side the market just doesn't seem to have the fuel as of yet to make the next step. However I believe it is just a matter of time and as M2 global money supply grows we get closer and closer to seeing new significant highs.
For this week CPI & PPI take place on Wednesday and Friday respectively. With CPI set to grow from 2.3% to 2.5% according to forecasts it will be interesting to see how markets react, expect short term volatility. Key battlegrounds for me are weekly high and midpoint.
Good luck this week everybody!

Tesla Drop to the downside update In this video I recap what happened in the latest drop on Tesla and how we anticipated this move some 4 days ago .
I cover whats possibly next for tesla looking forward .
This video also covers a HTF perspective on the direction of Tesla .
Any questions ask in comments
Thanks for your support

TSLA SellOff ! Elon Musk vs Donald Trump ! Beginning of the End?If you haven`t bought the dip on TSLA:
Now you need to know that TSLA Tesla experienced a significant drop of 14% today, marking its worst single-day performance in over four years. This decline erased approximately $150 billion in market capitalization, bringing the stock down to $284.70.
The immediate cause of this downturn is the escalating feud between CEO Elon Musk and President Donald Trump. Musk's public criticism of Trump's tax legislation, labeling it a "repugnant abomination," prompted Trump to threaten the revocation of government contracts with Musk's companies. This political clash has introduced significant uncertainty regarding Tesla's future government support.
Beyond the political arena, Tesla's core business metrics are showing signs of strain. The company reported a 9% decline in quarterly revenues and a staggering 71% drop in profits. Additionally, Tesla has lost its leadership position in the electric vehicle market to China's BYD, indicating increased competitive pressure.
cincodias.elpais.com
Investor sentiment is also waning. A Morgan Stanley survey revealed that 85% of investors believe Musk's political activities are negatively impacting Tesla's business fundamentals. This perception is further exacerbated by declining sales in key markets, such as a 17% drop in Model Y registrations in California.
thestreet.com
Elon Musk and Donald Trump have publicly clashed, escalating a feud that has unraveled their once-close relationship. The dispute centers on several issues:
Republican Tax and Immigration Bill: Musk criticized a sweeping Republican domestic policy bill backed by Trump, calling it a "disgusting abomination" on X. Trump claimed Musk initially had no issue with the bill, accusing him of being upset over the removal of an electric vehicle tax credit.
Epstein Files Allegation: Musk alleged Trump's name appears in classified Jeffrey Epstein files, escalating tensions. Trump has not directly addressed this claim but responded by threatening to cut government contracts with Musk's companies.
Personal and Financial Accusations: Musk argued Trump would have lost the 2024 election without his financial support, accusing him of ingratitude. Trump countered, saying he was "disappointed" in Musk, claiming he asked Musk to leave the administration and accused him of "Trump Derangement Syndrome."
Government Contracts and Tariffs: Trump threatened to cancel "billions and billions" in government contracts with Musk's companies, like SpaceX, amid the feud. Separately, Musk reportedly made personal appeals to Trump on auto tariffs, which Trump noted might involve a conflict of interest.
Cabinet Clash: Reports indicate Musk clashed with Trump’s cabinet, including Marco Rubio, over spending cuts related to the Department of Government Efficiency (DOGE), with some describing Musk's behavior as disruptive.
Given these challenges, a price target of $215 for TSLA appears justified. The combination of political entanglements, deteriorating financial performance, and eroding investor confidence suggests that Tesla's stock may face continued downward pressure in the near term.
Disclosure: I am part of Trade Nation's Influencer program and receive a monthly fee for using their TradingView charts in my analysis.

Everything we know about the Trump - Musk divorce (so far)
Elon Musk publicly criticised Trump’s “One Big Beautiful Bill” as a “disgusting abomination” that would explode the U.S. deficit and “bankrupt America.” The bill is projected to add $2.5 trillion to the U.S. deficit over 10 years.
Musk claimed Trump wouldn’t have won the 2024 election without his support, calling the backlash “such ingratitude.”
Musk then alleged on X that Trump appears in the Epstein files. This marks a serious escalation (but we all thought this before Musk confirmed it right?)
Trump followed up on Truth Social by calling Musk “crazy” and hinting at cancelling federal contracts with his companies. Trump wrote that cancelling subsidies for Musk’s companies “could save billions,”.
Tesla has wiped out ~$100 billion in market value. Tesla now politically exposed?
Musk floated the idea of creating a new centrist political party, criticising both Democrats and MAGA Republicans. “We need a party that actually represents the interests of the people. Not lobbyists. Not legacy donors. Not extremists.”

TSLA Backtest: A robo-taxi launchpad? TBD ... 𝗧𝗲𝘀𝗹𝗮 𝗕𝗮𝗰𝗸𝘁𝗲𝘀𝘁: A robo-taxi launchpad? 🤖🚗
After a 20%+ breakout, NASDAQ:TSLA is retesting its 200dma with $295–300 now key support. Hold that — and bulls have room to run to $400+.
𝘉𝘶𝘭𝘭𝘪𝘴𝘩 𝘴𝘦𝘵𝘶𝘱 𝘸𝘪𝘵𝘩 𝘢 𝘥𝘢𝘵𝘦: June 12 robo-taxi reveal in Austin could mark Tesla’s first real step toward autonomous ride-hailing at scale.
𝘏𝘪𝘨𝘩 𝘱𝘳𝘪𝘤𝘦, 𝘩𝘪𝘨𝘩 𝘩𝘰𝘱𝘦𝘴: Tesla's valuation has always priced in the future. This time, the future might show up in a self-driving Model Y.
$NQ_F NASDAQ:NDX NASDAQ:QQQ NASDAQ:NVDA NASDAQ:AAPL AMEX:SPY NASDAQ:SOX CBOE:ARKK #Tesla #Robotaxi #FSD #ElonMusk #Stocks

Tesla vs. BYD: The Market’s Greatest IllusionIntroduction: The Tale of Two Companies
You don’t need to be an economist to see it. Just compare Tesla and BYD.
BYD: Founded in 1995, Chinese, over $107 billion in revenue.
Tesla: Founded in 2003, American, with less revenue—but a market cap six times bigger.
The reason? Because one sells cars, and the other sells dreams. And Wall Street loves a good dream.
The Illusion Economy: When Hype Outweighs Reality
Tesla’s valuation isn’t tied to assets, production, or profits. It’s a ritual of collective belief—a performance act where branding replaces substance, and expectation outweighs reality.
It’s the same logic behind a $1,000 jacket that costs $100 to make. Put a fancy logo on it, and suddenly, it’s not overpriced—it’s "premium." You're not just buying a product; you're investing in a lifestyle. Sure. Keep telling yourself that.
Tesla is the $1,000 jacket. BYD is the actual tailor shop.
Tesla vs. BYD: The Numbers Tell the Story
Tesla’s market cap is over $1 trillion, while BYD’s is under $200 billion. Yet, BYD outsells Tesla globally, especially in China, where it dominates the EV market. Tesla’s valuation is built on brand perception, future promises, and speculative optimism, while BYD’s is grounded in actual production and revenue.
Financial Storytelling Over Business Reality
Tesla isn’t just a car company—it’s a financial illusion. Markets rise not on performance, but on promise. Stock prices reflect not what a company is, but what a hedge fund feels it might become. It’s not a business model—it’s mood swings with decimal points.
BYD’s Competitive Edge
Production Power: BYD manufactures more EVs than Tesla annually.
Battery Innovation: BYD’s Blade Battery is safer, lasts longer, and is cheaper than Tesla’s.
Affordability: BYD’s EVs are significantly cheaper, making them more accessible to global consumers.
Market Reach: BYD dominates China, the world’s largest EV market, while Tesla struggles with pricing and competition.
The Consequences of Buying the Dream
Tesla’s valuation isn’t creating better cars. It’s just creating dumber investors.
Investors who think they’re visionaries because they bought into the hype.
Consumers who think they’re elite because they bought the label.
Boards who think they’re gods because someone inflated their stock ticker.
But every illusion has an expiration date. Every bubble has its needle. And when dreams are sold on credit, reality always comes to collect.
Reality Always Comes to Collect
This isn’t growth. It’s speculative theater funded by your retirement account.
Real value doesn’t need hype. It appears in supply chains, production lines, tangible goods, and on profit sheets that make sense even without a TED Talk.
So next time you see Tesla’s trillion-dollar valuation, ask yourself: Are you investing in a business? Or are you just buying the dream—before it bursts?

TSLA: Not recommended by me!Hello Traders,
TSLA Tesla fundamental score is not really good for me! My score is based on EPS data and EPS forecasts. there might be better stocks out there!
Regarding the technical aspects, White it reacted to the bottom of the channel median of the channel might be a small struggle. There is a strong possible resistance on the way up. I prefer to give a better/safer score after breaking this zone. Also, if we just consider technical analysis, any long options should have a SL, the possible rational SL is so far from the current price. in case of correction or breaking the zone, the possible SL could be very tighter.
Fundamental: Not recommended.
Technical: So-So.
Overall: I don't buy

DOGE can be worth many DOLLAR'SGrok, the AI supercomputer interface on Elon Musk’s X platform, predicts that Dogecoin might hit $10 between 2029 and 2040.
While I remain hopeful, I believe that a more realistic target could be around 3-5 dollars by the end of this decade. This could potentially trigger a significant blowoff top, leading to an extended bear market for cryptocurrencies.
When you examine this chart, it’s hard not to appreciate its beauty, comparable to Bitcoin, as it showcases a well-defined uptrend and follows cyclical rises and falls. This has resulted in Dogecoin creating numerous millionaires. The pressing question is whether those investors who currently hold 250,000 coins will become the next wave of millionaires in just a few years?

TSLA A.M. Dump IdeaHere is a bearish imuplse at close breaking structure to the downside creating a sell opportunity if price retraces back to the arrow. Simple Idea.

DOGECOIN (FREE SIGNAL)Hello friends
Given the good growth we had, the price has corrected and now is a good time to buy step by step and with capital management...
We have specified the purchase steps for you and the target is also specified...
*Trade safely with us*

TRUMPPPPPPPPPPPPPPPPPPPHello friends
Considering the good growth we had, you can see that the price formed a flag and corrected after reaching its ceiling.
Now, with the price correction, there is a good opportunity to buy in stages and with capital management and move towards the specified goals.
*Trade safely with us*

"DOGE - Time to buy again!" (Update)So if you pay attention to the doge chart you can see that the price has formed a Ascending FLAG or wedge which means it is expected to price move as equal as the measured price movement.( AB=CD )
NOTE: wait for break of the FLAG .
Give me some energy !!
✨We spend hours finding potential opportunities and writing useful ideas, we would be happy if you support us.
Best regards CobraVanguard.💚
_ _ _ _ __ _ _ _ _ _ _ _ _ _ _ _ _ _ _ _ _ _ _ _ _ _ _ _ _ _ _ _
✅Thank you, and for more ideas, hit ❤️Like❤️ and 🌟Follow🌟!
⚠️Things can change...
The markets are always changing and even with all these signals, the market changes tend to be strong and fast!!

TSLA bulls - Do You Have More?Tesla has had a stunning rebound , the chart has gone vertical right into a key resistance.
It's amazing how price action can respect key Fibonacci levels.
A 50% retrace can be observed on this chart. We all now Tesla can move in parabolic fashion but typically when it does tbag it's prone to large drawdown.
Ideally bulls would want to see price trade sideways to lower form here in setting up the potential for the next leg to $380
If price moves to quickly through this 50% Fib level expect a large reversal down.
I personally wouldn't buy up here as the bullish inverse head and shoulders from it's lower base has achieved its upside.
We need a new pattern to form and right now we haven't established a new bull flag of pattern of consolidation. NASDAQ:TSLA
