Dogecoin Buy Signal: Will the Channel Break Today?Hello friends
Given the good growth we had, you can see that the price has taken a break, which can be used as a buying opportunity.
We have identified the buying steps for you to buy in steps and move to the specified goals.
*Trade safely with us*
Elonmusk

XAI Agent GORK. Elon Musk is on board?XAI Agent GORK. Elon Musk is on board?
#Gork — is a meme coin operating on the Solana blockchain, inspired by the XAI Grok chatbot. It gained significant attention due to its humorous and satirical nature, with notable interactions from influential figures like Elon Musk. The coin has experienced rapid market activity, including high trading volumes and substantial price fluctuations, driven by social media hype and speculative trading.
Market-Maker Wintermute:
intel.arkm.com
Official X (Gork):
x.com
Official Contract and Chart:
gmgn.ai
Arkham (Gork):
intel.arkm.com
Added Gork to the portfolio. I’ll hold and monitor it, looking for exit points in case of strong growth.

ADA/USDT: Is ADA Preparing for Its Next Rally?(READ THE CAPTION)By analyzing the #Cardano (ADA) chart on the 3-day timeframe, we can see that over the past few months, the price surged from $0.33 to $1.32, delivering a gain of over 300%. After reaching its highest level in 3 years, it faced selling pressure and corrected down to $0.50.
Currently, Cardano is trading around $0.70, and if the price can hold and close above the $0.65 level, we may expect further upside in the medium term.
The next potential targets are $0.75, $0.81, $0.93, and $1.05, respectively.
Please support me with your likes and comments to motivate me to share more analysis with you and share your opinion about the possible trend of this chart with me !
Best Regards , Arman Shaban

The Illusion of Value: How the U.S. Market Became a Fantasy EconThe Illusion of Value: How the U.S. Market Became a Fantasy Economy
For decades, the American economy has been celebrated as the epicenter of innovation, wealth creation, and corporate success. But beneath the surface, an unsettling reality has emerged: The U.S. financial markets are increasingly driven by speculation, hype, and a distorted sense of value.
"Buy Now, Pay Later"—A Culture of Delusion
One of the most glaring symptoms of this detachment from reality is the widespread adoption of "Buy Now, Pay Later" (BNPL) services. A staggering number of American consumers have embraced debt-financed spending as a normal part of life. Credit cards are no longer the primary vehicle for financial mismanagement—BNPL systems have convinced people they can afford luxuries they fundamentally cannot.
This mentality, in turn, feeds into the stock market’s obsession with future promises over actual output. Investors have become infatuated with narratives rather than numbers, driving valuations to unrealistic highs for companies that either underdeliver or simply do nothing at all.
The MicroStrategy Paradox: Borrowing Money to Buy Bitcoin
Take MicroStrategy, for example—a company whose sole business model seems to be leveraging borrowed capital to buy Bitcoin. By traditional metrics, MicroStrategy offers no tangible product, no innovative service, no groundbreaking technology—just speculative accumulation. Yet, thanks to Bitcoin hype, its stock price is valued as if it’s a revolutionary player in the corporate world.
This irrational valuation mirrors the broader issue with American markets: Companies are being rewarded not for what they actually do, but for the financial games they play.
The Myth of Overvalued Titans: Tesla & Meta
Tesla and Meta serve as the poster children of speculative overvaluation.
- Tesla: Once hailed as an automotive disruptor, Tesla’s stock price often reflects what Elon Musk promises rather than what Tesla delivers. From self-driving software that never fully materialized to mass production goals that fell flat, Tesla’s ability to sustain its valuation relies more on Musk’s cult-like following than automotive success. Meanwhile, the gutting of regulatory oversight has allowed Tesla to push unfinished, potentially hazardous products into the market.
- Meta: Meta’s valuation has ballooned largely on the promise of virtual reality dominance. Yet, billions poured into the Metaverse have yielded little beyond overpriced VR headsets and gimmicky social spaces.
Elon Musk: The Master of Market Manipulation
Elon Musk’s influence on financial markets cannot be overstated. Through cryptic tweets, grand promises, and regulatory maneuvering, Musk has become a force powerful enough to shift markets with mere words. Whether it’s pumping Dogecoin, slashing Tesla’s safety oversight, or influencing government policy for personal gain, Musk operates in a reality where market value is dictated by his persona rather than corporate fundamentals.
The Rise of True Value Markets
While the U.S. economy indulges in financial fantasy, other global markets have started to present compelling opportunities:
- Europe: A more realistic, fundamentals-based approach to valuation is emerging. Traditional industries remain resilient, and companies must show actual profitability to attract investment.
- China: Despite regulatory challenges, China’s focus on industrial production, technological advancement, and infrastructure development gives its economy a sense of tangible progress.
- UK & Australia: Unlike the speculative U.S. markets, these economies remain grounded in earnings, productivity, and rational valuations.
Conclusion
The American financial landscape has become a speculative playground detached from reality. Companies are valued not for what they produce, but for what they promise, what they borrow, and what narratives they spin. Figures like Musk exploit market sentiment, while deregulation enables corporations to operate recklessly. As Europe, China, the UK, and Australia foster economies built on real value, the U.S. is at risk of crashing under the weight of its illusions.
SP:SPX TVC:DXY INDEX:BTCUSD TVC:GOLD NASDAQ:MSTR NASDAQ:TSLA NYSE:BLK NASDAQ:META XETR:DAX FTSE:UKX TVC:HSI SET:SQ NASDAQ:PYPL NASDAQ:AFRM NASDAQ:AAPL NASDAQ:AMZN NASDAQ:NVDA NASDAQ:COIN NASDAQ:HOOD

DOGECOIN BUY LIMIT...Hello friends✌
Given the good price growth and the arrival of buyers, now that the price is correcting, it is the best time to buy.
🙏If you like it, support it with a ✔like✔ and ✔comment✔.
*Trade safely with us*

WLD/USDTHello friends
Given the price growth we had, the price correction has now managed to make good bottoms, which indicates the strength of the trend, so we can enter the trade.
The purchase and target points have also been identified...
Follow capital management.
*Trade safely with us*

TRUMP COIN BUY...Hello friends
Given the price growth we had, the price correction has now managed to make good bottoms, which indicates the strength of the trend, so we can enter the trade.
The purchase and target points have also been identified...
Follow capital management.
*Trade safely with us*

Say hello to the 75-cent Dogecoin!So if you pay attention to the DOGECOIN chart you can see that the price has formed a Ascending FLAG which means it is expected to price move as equal as the measured price movement.( AB=CD )
NOTE: wait for break of the FLAG .
Give me some energy !!
✨We spend hours finding potential opportunities and writing useful ideas, we would be happy if you support us.
Best regards CobraVanguard.💚
_ _ _ _ __ _ _ _ _ _ _ _ _ _ _ _ _ _ _ _ _ _ _ _ _ _ _ _ _ _ _ _
✅Thank you, and for more ideas, hit ❤️Like❤️ and 🌟Follow🌟!
⚠️Things can change...
The markets are always changing and even with all these signals, the market changes tend to be strong and fast!!

TSLA Tesla Options Ahead of EarningsIf you haven`t bought TSLA before the recent rally:
Now analyzing the options chain and the chart patterns of LMT Lockheed Martin Corporation prior to the earnings report this week,
I would consider purchasing the 230usd strike price Puts with
an expiration date of 2025-4-25,
for a premium of approximately $10.70.
If these options prove to be profitable prior to the earnings release, I would sell at least half of them.

APT/USDT:BUYHello friends
Given the good price growth, we see that the price is in an ascending channel and has fallen, we can buy in a stepwise manner in the price decline within the specified ranges and move with it to the specified targets.
Observe capital and risk management.
*Trade safely with us*

TESLA | Monthly Analysis After NASDAQ:TSLA hitting its ATH target, 87% - 90% retracement is next target
start of 2027 = will be a buying signal for tesla unless there's some issues involving with Elon Musk, then tesla could experience under performance
Long term investors - prepare for down side inside buying channel

TESLA | Weekly HTF TargetAfter having a deep retracement ~70% tesla looks ready to reach Higher Highs...
New High target: $490+

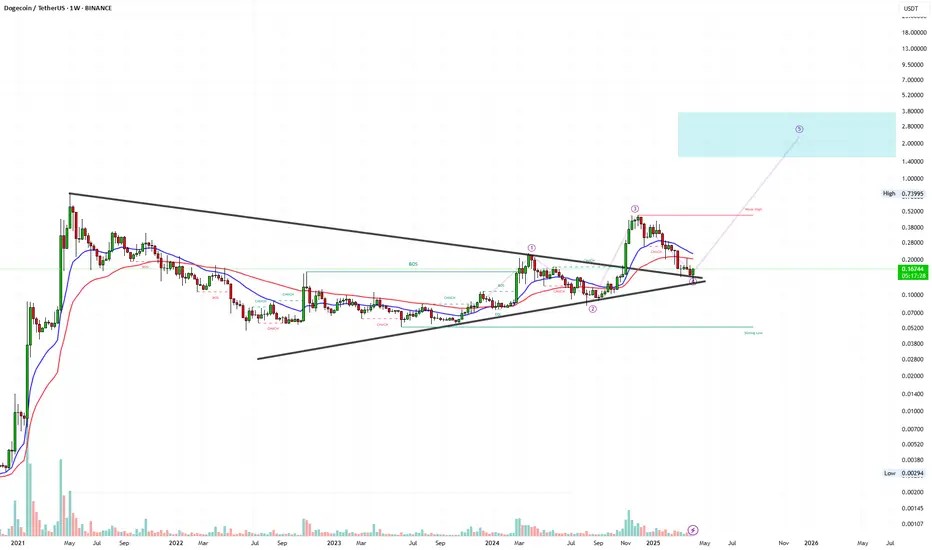
Dogecoin (DOGE) - 1WOn the weekly timeframe, Dogecoin (DOGE) formed a Symmetric Triangle and broke out bullish in November 2024. The breakout level, now support, was retested in April 2025. If this support holds, DOGE is likely to rally to a new all-time high, driven by community hype and market momentum. Failure to hold support could invalidate the breakout, risking a decline. Monitor the support zone and manage risks due to DOGE’s volatility.
DOGE/USDTHello friends
Due to the price drop, we reached a good support area where good buyers supported the price.
Now we can buy in steps and with capital management in the specified areas and move to the specified targets.
Always buy in fear and sell in greed.
*Trade safely with us*

Tesla Taps the Golden Zone – Is the Launch Sequence Engaged?Tesla (TSLA) has shown textbook precision by respecting the golden zone after a significant sweep of previous highs. Rather than violating the last HTF low—which would’ve hinted at deeper downside—price instead retraced cleanly into the OTE (Optimal Trade Entry) range and reacted with strong bullish intent.
This move indicates a healthy retracement rather than weakness, suggesting a continuation to the upside. Confirmation of this potential bullish leg would be a sustained close above the 272–300 level, which aligns with previous buyside liquidity zones and Fibonacci confluence.
Key Observations:
- Golden Zone respected: Price bounced cleanly between the 62–79% fib levels.
- HTF low protected: No violation of higher timeframe bullish structure.
- Volume spike supports the reversal move.
Targets:
- Short-term: 300.61
- Mid-term: 416.67
- Long-term swing: 861.17 (over 255% potential gain)
Conclusion:
Tesla looks set for lift-off 🚀. The reaction at the golden zone and the preservation of structure give high confluence for a potential explosive move higher. Wait for confirmation via price continuation and structure integrity.
As always — DYOR (Do Your Own Research).

Tesla Stock Drops 9%+ After Q1 Deliveries Drop to Three-Year LowTesla (Nasdaq: NASDAQ:TSLA ) is trading at $242.52 as of 1:04 PM EDT on April 4th, down 9.26%. The stock fell $24.76 after reporting weak Q1 2025 results. This came two days after Tesla closed its worst quarter since 2022, shedding 36% in market value. The company delivered 336,681 vehicles in Q1, missing analysts’ expectations of 360,000 to 377,590. This marked a 13% drop compared to Q1 2024, when it delivered 386,810 units. Production also fell to 362,615 vehicles from 433,371 in the prior year.
Tesla produced 345,454 units of its Model 3 and Model Y. Deliveries for those models stood at 323,800. Other models, including the Cybertruck, accounted for 12,881 deliveries. The quarter saw partial factory shutdowns to upgrade lines for a redesigned Model Y.
CEO Elon Musk said this model could again be the world’s best-selling car in 2025. But now the question is, will it?
Looking at it, Tesla faces several challenges, including increased EV competition and reputational damage tied to Musk’s political involvement. Of late, the CEO’s position in Trump’s Department of Government Efficiency (DOGE) has drawn backlash.
Protests, boycotts and vandalism against Tesla facilities and vehicles spread across the U.S and Europe. In Germany, Tesla’s EV market share dropped from 16% to 4%. Across 15 European countries, market share fell to 9.3% from 17.9%.
China also posed challenges. Tesla sold 78,828 EVs in March, an 11.5% year-on-year decline as domestic competitors like BYD increased their market presence. In Canada, Tesla claimed 8,653 EV sales during a January weekend to qualify for subsidies. The transportation ministry froze the payments and launched a probe into the claim.
Technical Analysis: Price Approaches Key Support Zone
Tesla’s price has declined sharply since hitting an all-time high of $488 in late December 2024. Since January, the stock has been in a downtrend, respecting a descending trendline. In early February, it broke a key support level at $290 and retested the level in late March before continuing downward.
Currently, the stock is approaching support at $190, a critical level for short-term price action. If it holds, the stock could attempt to break the descending trendline and move toward the $290 resistance.
If Tesla's bearish bias persists and breaks below $190, the next support sits at $140. This aligns with the head of a previously completed head-and-shoulder pattern. Breaking this level could trigger further losses.
The next few weeks will determine if it rebounds or slides deeper, with earnings report expected on Apr 22nd, 2025.

DOGE/USDT:BUY...Hello dear friends
Given the price drop we had in the specified support range, considering the price growth indicates the entry of buyers.
Now, given the good support of buyers for the price, we can buy in steps with capital and risk management and move towards the specified goals.
*Trade safely with us*

Tesla - There Is Hope For Bulls!Tesla ( NASDAQ:TSLA ) is just crashing recently:
Click chart above to see the detailed analysis👆🏻
After Tesla perfectly retested the previous all time high just a couple of weeks ago, we now witnessed a quite expected rejection of about -50%. However market structure remains still bullish and if we see some bullish confirmation, a substantial move higher will follow soon.
Levels to watch: $260, $400
Keep your long term vision!
Philip (BasicTrading)

$TON Price Surge: Can Grok AI Drive the Next Breakout?Elon Musk’s confirmation of Grok AI’s integration into Telegram is a game-changer for Toncoin, enhancing the utility of projects built on the CRYPTOCAP:TON blockchain. This news coincides with TON’s recent breakout from a falling wedge, signaling potential bullish momentum as it approaches the critical $4 resistance level. A decisive break above this mark could push the price toward $5.55.
Market sentiment remains optimistic, with Toncoin’s Open Interest reaching $176.23 million. However, liquidation data reveals more long positions being wiped out than shorts, indicating volatility and potential corrections. While bullish sentiment prevails, traders should watch for sustained support above $4 to confirm TON’s continued rally.

DOGECOINHello friends
Due to the price falling in the specified support area, the price has been well supported. Now, due to the good price support by buyers, we can buy in steps within the specified purchase ranges, with capital and risk management, and move towards the specified goals.
*Trade safely with us*

Tesla on the Path to New Highs: Correction Before a Major high?hello guys.
let's have a comprehensive analysis of Tesla
__________________________
Technical Analysis
Price Structure & Trend:
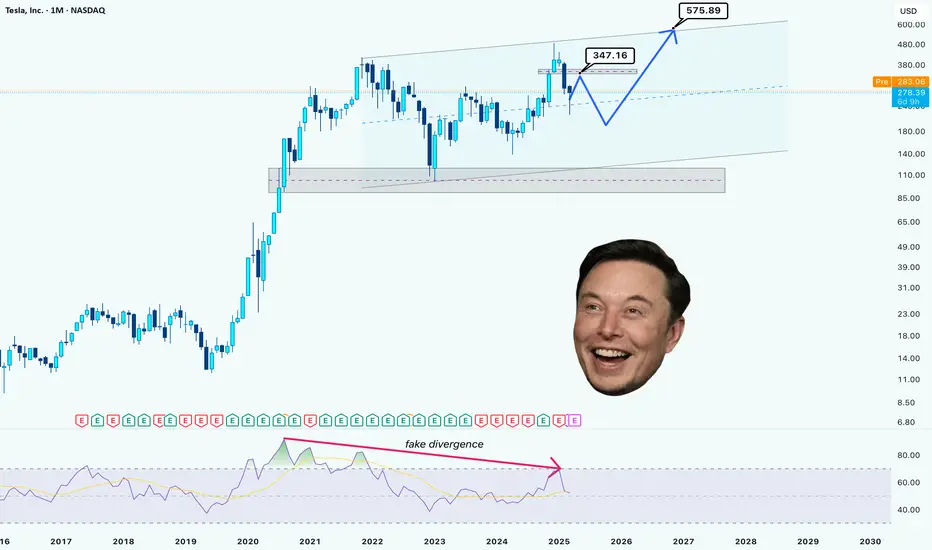
The monthly chart indicates a long-term uptrend within a broad ascending channel.
Tesla has recently faced resistance around $300 and is now in a corrective phase.
The expected correction may bring the price down to around $220-$250, where it could find strong support before continuing its bullish move. or it is possible to start an upward movement and form an ATH!
RSI & Divergence:
The RSI indicator previously showed a fake bearish divergence, meaning the price action remains strong despite earlier weakness signals.
Potential Higher Levels
If Tesla successfully follows the projected movement, a break above $575 could open the door to $700-$750, based on the channel extension and historical breakout patterns.
__________________________
Fundamental Analysis
Earnings & Growth:
Tesla's revenue growth remains strong despite market headwinds.
New factory expansions (Giga Texas, Giga Berlin) and production efficiency improvements contribute to long-term profitability.
The Cybertruck ramp-up and expansion in AI-driven automation could drive future stock value.
EV Market Outlook:
Tesla maintains a dominant position, but increasing competition from Chinese EV manufacturers and legacy automakers remains a challenge.
Recent price cuts have impacted margins but helped sustain high sales volume.
Macroeconomic Factors:
Interest rate decisions by the Federal Reserve could impact growth stocks like Tesla.
If rates stabilize or decrease in 2025, Tesla could see renewed investor interest, pushing the stock to new highs.
_________________________
Conclusion
The mid-term bearish retracement toward $250 aligns with healthy correction levels.
If Tesla holds above support and breaks $350, your $575 target is highly probable.
A break above $575 could lead to $700+ in the longer term, assuming positive earnings growth and stable macroeconomic conditions.
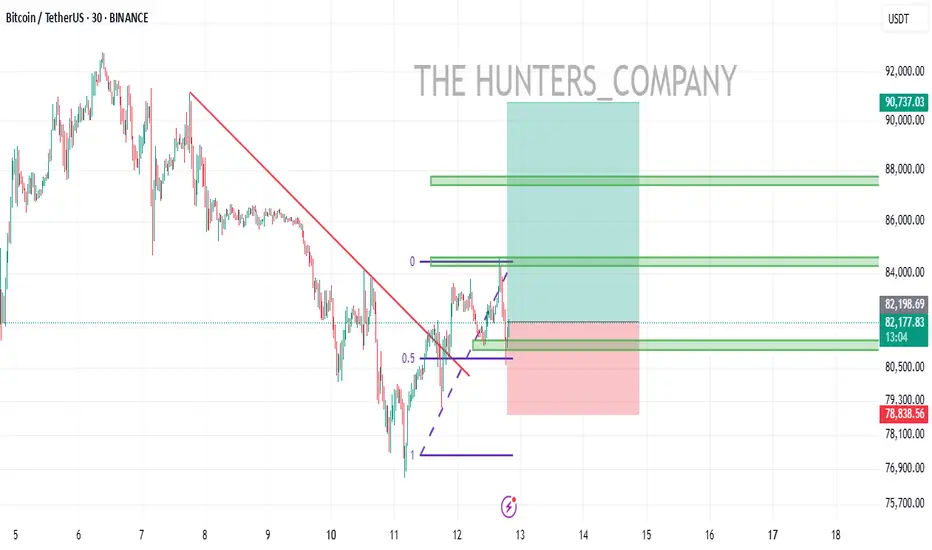
BTC/USDTHello friends
After a heavy fall, now with the trend line broken and the ceiling and floor higher after creating a pullback, you can enter the capital with capital management.
*Trade safely with us*
POPCAT...Hello friends
Given the good price growth and the arrival of buyers, you can enter into a transaction during the price correction with capital and risk management.
*Trade safely with us*
