TWTR Musk Walks Out On $44 Billion BuyoutWhat i really believe is happening is Elon Musk wants a better price for Twitter, in the $44-45 area instead of the initial $54.50.
And he will get it. The earnings won`t be strong, we could even see revisions.
My buy area is between $31 and $34 and the buyout price $44.
i think you can win both ways if you play an option strangle with 6 months expiration date.
Looking forward to read your opinion about it.
Elonmusk

Dogecoin DOGE Bear Market RallyFriday the S&P hit a new 52 week low, being oversold right now.
I expect a bounce in the stock market next week, which will determine a bear market rally in the crypto space too!
Hedera HBAR is one of the cryptocurrencies that have a lot of potential for a bull run.
DOGE/USDT
Entry Range: $0.059 - 0.063
Take Profit 1: $0.077
Take Profit 2: $0.10
Take Profit 3: $0.135
Stop Loss: $0.049

certified Bitcoin node(Qti) license,Original Bitcoin Wallet and node with documented proof of satoshi nakamoto, sha384 encrypted telemetric engine supporting . Satoshi is an algorithmic theory, Using the Root certificate, The original licensed Bitcoin node traces the entire merkle root identifying where the original hash-root originated from. It had been specifically calculated to to continuously show, proof of work (Not mining) removing all third party services ensuring the bitcoin had come from inherrited X64 operating system, device ID dating back to 2007, prior to.... this is for you elon

TESLA Ahead of the first 1D Golden Cross since August 2021.Tesla (TSLA) confirmed the Bull Flag from our last analysis one month ago and broke out of it while holding twice the Higher Lows trend-line from the June 16 Low:
The last touch was three days ago and naturally that is giving the stock a short-term (at least) boost. The price completed the 1D MA50/ MA100 Bullish Cross last month but now is ahead of the critical Golden Cross formation (when the 1D MA50 (blue trend-line) crosses above the 1D MA200 (orange trend-line)). If completed, it will be the first occurrence since August 2021. Technically that should be a strong bullish signal but the Higher Lows trend-line plays an equally important role. If broken the uptrend may turn into the (green) Rectangle pattern that has kept the price from breaking above 315.00 three times.
This is approximately where the 0.618 Fibonacci retracement level is and if broken we can finally see the bullish rally completing a new Lower High at the top of the long-term Channel Down. A break below the Rectangle, can test the 0.236 Fibonacci as the next Support level. Keep an eye on the MACD (1W time-frame). It is still on a Bullish Cross but a new Bearish Cross could mean a new round of medium-term selling towards the bottom of the Channel Down, much like the Jan 05 and April 28 Bearish Crosses.
-------------------------------------------------------------------------------
** Please LIKE 👍, SUBSCRIBE ✅, SHARE 🙌 and COMMENT ✍ if you enjoy this idea! Also share your ideas and charts in the comments section below! This is best way to keep it relevant, support me, keep the content here free and allow the idea to reach as many people as possible. **
-------------------------------------------------------------------------------
You may also TELL ME 🙋♀️🙋♂️ in the comments section which symbol you want me to analyze next and on which time-frame. The one with the most posts will be published tomorrow! 👏🎁
-------------------------------------------------------------------------------
👇 👇 👇 👇 👇 👇
💸💸💸💸💸💸
👇 👇 👇 👇 👇 👇

30% SHIBA INU UPCOMING CRASHShiba is in a bullish pull back of a bearish market structure, after reaching the resistance block where it will be touching the resistance line of a correction for the third time meaning within the structure...the will be a high probability that shiba will be selling

BTC 20% CRASH PREDICTIONWe are still expecting a 20% short/crash after the Major bullish pullback, after the crash thats when we will maybe look for buying opportunities @Support level

$QOM.X Shiba Predator entry PTs 0.0000000279-0.00000003QOM Price Today
Shiba Predator price today is $0.000000034240 with a 24-hour trading volume of $777,897. QOM price is down -3.3% in the last 24 hours. It has a circulating supply of 600 Trillion QOM coins and a total supply of 600 Trillion. If you are looking to buy or sell Shiba Predator, LBank is currently the most active exchange.
What was the highest price for Shiba Predator?
Shiba Predator hit an all time high of $0.000000380671 on Apr 03, 2022 (6 months).
What was the lowest price for Shiba Predator?
Shiba Predator had an all time low of $0.000000028138 on Jun 14, 2022 (3 months).
What was the 24 hour trading volume of Shiba Predator?
The 24 hour trading volume of Shiba Predator is $777,897.
Where can Shiba Predator be traded?
You can trade Shiba Predator on LBank, Uniswap (v2), and BKEX. Popular trading pairs for Shiba Predator in the market includes QOM/USD, QOM/CAD, QOM/AUD, QOM/GBP, QOM/INR, and QOM/PHP.
QOM is the Shiba Predator, it is a community token whose function is to flip the Shiba Market cap.

Tesla in Accumulation Zone(Flag Formation)Important Fibonacci Levels:
-35,6
-180
-230
-270
-300
-327
-363
-417

TSLA is very promisingTESLA has been in a trading range since the beginning of January 2022 after a massive uptrend started at the beginning of 2020.
inside this trading range, TSLA stock has been a small rectangle for the last few weeks.
a breakthrough that range will signal a potential long position taking for investors.

CADCHF buy MatrixVUnderbought Indicator, OP FIB TP Zone got hitten, wait for reversal (Breakout, Retest in special FIB Zones)
GG EZ MATRIXVENOM

TESLA DESTINYLet's face the truth : everyone know Elon Musk mastered the ancient art of market manipulation and leverage on people greed.
All this was done by #Bitcoin #Dogcoin #Tesla and much more post. A lot of fun for Elon, who doesn't care about is health or character. It only cares about "how to trigger money rising thru greed".
And now is the time to face reality.
EV cars market doesn't work as planned.
China blocked Tesla.
Germany factory doesn't produce as planned.
How can be planned a 22bln revenue and 1bln earnings for 19 October? Near impossibile (even if all Bitcoin was sold)
In the past Elon manipulated market with a stock split. This time will not work because "split market" is necessary to pump retail on buy cheaper stocks. Not during high inflations and recessions. There are also a lot of shortages everywhere...
EV Car companies cannot sell cars with lower prices.
So I expect a full retrace about half way for Tesla ... and than let's see what will be next.

dogecoin in the buying stage 🔥I see a strong buying wave coming. Because we have a large volume with the hammer candle and this indicates the reversal of the bullish trend ,With the appearance of a good signal in RSI
This is what I see and believe

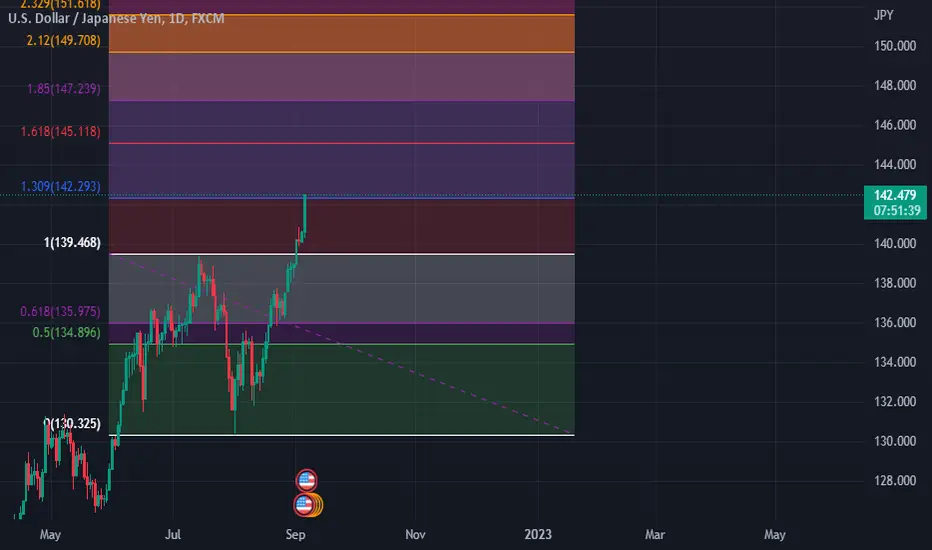
USDJPY buy MatrixV SMCUSDJPY buy. Price hit the OP Fibonacci Zone between the 0.786 POI and inside of it the golden 0.618 FIB Zone.
//spawn key ("Der Schlüssel");
GG Ez MatrixV

TESLA Stock Long To 325$ With High Probability!Hello ladies and gentlemen, according to my graphical analysis of Tesla , I recommend for the moment to keep Tesla Stock in your portfolio because there is a great probability of reaching 325$ in the next few weeks inshallah.

Tesla Gets TestyOver the past few years, not many companies have seen the hype that Tesla has when it comes to its stock performance.
Starting at $1.10 in 2010 and pushing up to the range of $1200 near a decade later (before the stock split), early investors have enjoyed monumentally unfettered growth in profits.
A side-effect of this historical growth has been undeniable euphoria. There is no better drug for a trader to experience. Even after Elon Musk sold large amounts of his shares, euphoria is what kept many retail investors loyally invested. The only reward to come was a loss of peak gains.
Although Tesla has more juice in the battery pack and could easily extend its value towards $520 in the months ahead, the pending correction will be monstrous and one that any investor should want to protect themselves against.
See related ideas below:
Tesla Prepares for Major Dip... (before a stock split was actualized, the waves showed that a return below $500 was very likely to come).
Tesla Returns to $50... (a supremely immature call. The current position of the pattern was also incorrect however, the retest level below $50 is very likely to manifest beyond 2023).

AUDJPY buy swingtrade MatrixV Price makes a consolidation, indicator is underbought, breaks through trendline, EMA crossover,
Price breaks last resistance
Wait for retest and entry pattern in lower timeframe
AUDJPY Target is 100.00
GG Ez MatrixV

USDJPY take over the world MatrixVJapanese guys are back with their contracts with the russians. We had a little correction at our last resistance zone, after this the markets went bullish again. We will have again A VERYYYYYYY BIG bullrun at USDJPY. So write down in your tradingmind
USDJPY BUY - EURUSD sell.
All european people are life threating by the incompetence of the EZB.
GG Ez MatrixV the only G

USDJPY smart money concepts MatrixVIt was easy predictible that USDJPY is bullish again, but you have to get a good risk managment. SMC has the best concepts with Risk Managment, where you have a 2-20 RR. The most important thing is to protect your money from the banks by your stopploss and takeprofit.
If you have a profitable 10 RR you can lose 10 trades and regain it with 1 trade.
Explanation= Yellow SMC Traders, Red Retail/Patterntraders. NOTICE!! Patterns are useful, but you have to know how every marketparticipant is trading: Patterntraders, Indicatortraders, SMC Traders, Orderflow Traders, Volume Traders, Banks
1. € = Liquidty in SMC Trading, Trend in Retailtrading, shows where price is going
2. CHOC (Change of Character): Market change its direction and brokes last supportzone = Sign of Market Reversal
3. Yellow Fibonacci: SMC Traders take the last candle of Support/Resistance and take the 0.5 Zone as their TP/ENTRY/STOPPLOSS
They try to knock out Retail Traders, who wait for breakout in 1minute Chart = Fakeout = Entry of SMC Traders
SMC Trading is based on risk managment, its the most important thing.
4. Entry Pattern Traders: Pattern Traders see a bullflag, they take the bearish trend, copy it, and wait for trendhit. Their stopploss is mostly the golden 1.618 Zone, Takeprofit, is close to the other trendline. They often have a 1:2 RR;
5. Entry SMC Traders: 0.5 or 0.618 FIB Zone of last resistance or support zone (ITS A "LAW"), which they take to draw their stopploss/entry
We have a bearish CHOC, so there are still short positions, which push the price down.
You have to practice your style of entry/stopploss/takeprofit. Your goal with SMC is to place trades with a high RR (5+)
Combine it with other retail strategys like patterns or indicators. the more confirmations the better
6. TP of SMC Traders: The last bull consolidation zone (CZ), before the the price did the bigger bullcandle.
SMC Traders take the 0.5 FIB Zone of the low and high of the CZ as their takeprofit. There is also the CHOC Zone, which is also a confirmation
This TP can also be an entry for a longposition.
7. BOS (Break of structure): Market broke through last resistance, closed the body of the candle above the zone. retest, BOS
8. 2nd SMC Entry: Retail Traders will go long instantly, but your goal is to buy as low as possible to take your RR high.
2nd SMC Entry is the BOS Zone, Stopploss the 1st supportline, Takeprofit is your choice
Follow for more. Normally my posts are very short, but this time I thought I have to explain my TrAdInGvIeW
GG Ez MatrixV Ruler Of The Market

TESLA Shorts - US Stocks FallingTSLA W1
Much higher timeframe analysis here, but looking at a few top US stocks comprised int he 500 to try and marry up some relevant support lows from the next likely bear cycle we are due to expect.
This could take us in to the new year, or maybe sooner, speculative analysis, but worth indicating zones, regardless the DCA principle will apply to the long term investment positioning.

Teslaheres my tesla chart for the next few weeks hoping we reach 300-400.00 to 500.00 dollars in the next few months of work---which would make tesla and elon musk happy.

TESLA STOCK ANALYSISTesla Mid term analysis, Disclaimer: Have your own money management and risk system

#TSLA After Close In Daily Frame Under #MA 200 And Close Under #MA 50 In 4H Hour Frame We Can See A Good Opportunitie For Selling But i prefer To Wait Until I See A closing Under 280.42 Then I Will Think To Sell Othertwise You Can Sell Also Now But With Small Lot Of Course....You Can Put Your Target in 251.07 Then We wait To See The Reaction Will Happend In The Trend I Draw Break It Confirm More Selling
#GOOD LUCK
