WAVESBTC long easy 20% RR=3.1This is an easy trade.
Take a look at the WavesUSD chart too. It wants to pop up 20% like this here.
Undervalued, ready to pop, I take it. No financial advice, just my trade.
When btc is stable around 8800, it will pop in usd and when btc drops, waves will hold usd and get btc value. When btc rises, it will hold btc and get usd value in my opinion.
WAVESBTC long easy 20% RR=3.1
Exponential Moving Average (EMA)

Structural Resistance| Volume| Trend Change?Hello Traders!
Today’s chart update will be on LTCUSDT where a key structural level is being tested, a break will confirm a trend change.
Points to consider,
- Higher high probable
- Structural resistance in confluence with .236 Fibonacci
- EMA’s cross bullish
- RSI trading in overbought
- Stochastics in upper regions
- Volume increasing
LTCUSDT has a higher high projection which will negate the bearish structure of lower lows. Resistance which is in confluence with the .236 Fibonacci is a strong level for bulls to break to confirm the structural change.
EMA’s have crossed bullish, needs to hold LTC support when key levels are broken to maintain a bullish bias.
RSI is currently overbought; hitting its resistance, a return to neutral territory is quite probable. The stochastics is currently trading in the upper regions, can stay here for an extended period of time, however lots of stored momentum to the downside.
Volume has increase, healthy for LTC’s trend change, this needs to sustain for follow through otherwise a fake out will be imminent.
Overall, in my opinion, LTCUSDT trend change will come to fruition when key structural resistance is broken with a close above. We need to see convincing bull volume which will help with follow though.
What are your thoughts?
Please leave a like and comment,
And remember,
“Win, loss whatever emerges in the short-term, place and manage your next trades untouched, unattached... always keeping your eyes on the long-term picture.”
― Yvan Byeajee

IIPR Adam & Eve Pattern| Bull Flag| Bull Volume Needed!Hello Traders!
Today’s chart update will be on IIPR which has a potential bullish pattern playing out – an Adam and Ever reversal formation that will be confirmed by a break of structural resistance.
Points to consider,
- Bullish pattern coming to fruition
- Structural resistance to break
- EMA’s supporting price
- Stochastics in upper region
- RSI trending up
- Bull volume required
IIPR’s Adam and Eve will be confirmed by a break and a close above current structural resistance, price is now consolidating near this resistance in a potential bull flag, a hold of this level will mean a confirmed S/R flip.
EMA’s currently supporting price, needs to hold true when key levels are broken for a continued bullish bias.
Stochastics is trading in the upper regions, can stay here for an extended period of time, however lots of stored momentum to the downside. RSI as of now is respecting its uptrend, a break of its line will cool it off to neutral levels.
Bull volume needs to come true in this current bull flag otherwise this whole set up will be negated, we have notable bear volume as of now.
Overall, in my opinion, that chart will be confirmed bullish once structural resistance is broken with confirmed bull volume. IIPR does have bullish formations but are not confirmed as of yet.
What are your thoughts?
Please leave a like and comment,
And remember,
“Ultimately, consistent profitability comes down to choosing between the discomforts you feel when you follow your plan and the urge to let yourself be captures ( and ruled) by your emotions.”
― Yvan Byeajee,

CRON Key Level Broken| Increase In volume| EMA Cross Quick update on CRON, which has broken a key resistance level, now potential support upon retest
Points to consider,
- Trend change with Higher High
- Structural resistance broken
- RSI diverging
- Stochastics in upper regions
- EMA’s support
- Volume increasing
Higher high has come to fruition; this is the first time in CRON’s bear trend, signalling a potential reversal.
Structural resistance broken, now support upon a confirmed S/R flip retest. Stochastics in upper regions can stay here for an extended period of time, however lots of stored momentum to the downside.
RSI diverging, confirming a bullish divergence as CRON puts in lower lows. EMA’s cross bullish, first time this has happened in the downtrend for CRON.
Volume is visibly increasing confirming a technical level is being tested, this needs to sustain for a bullish continuation.
Overall, in my opinion, CRON has healthy volume coming at key resistance now potential support. A continuation is probable, confirming the macro trend change.
What are your thoughts?
Please leave a like and comment,
And remember
“There is a huge amount of freedom that is derived from not fighting the market.”
― Yvan Byeajee,

Bullish Divergence| Equilibrium|Resistance| ALT Season? Hello Traders,
Today’s chart update will be on XRPBTC with a probable bullish divergence coming to fruition if local resistance is broken.
Points to consider
- Trend testing key levels
- Local resistance to break
- EMA’s currently support
- Stochastics neutral
- RSI respecting trend
- Increase in volume
Trend is testing technical levels and holding, an evident bullish divergence is diverting XRP to change the current down trend. Local resistance is yet to break, a close above will confirm the bullish divergence.
EMA’s currently support, must hold true when local resistance is broken, worthy to note that it has been weak as of late.
Stochastics is currently neutral; a fall in any direction is probable. The RSI is respecting its trend, diverging from price by putting in higher lows whilst XRP puts in lower lows.
An Increase in volume needs to sustain when a break comes to fruition, this will increase the probabilities of a continuation.
Overall, in my opinion, XRPBTC is trading between two levels where equilibrium may come to fruition from this bullish divergence. Local resistance is a very key level to break as of now.
What are your thoughts?
Please leave a like and comment,
And remember,
“You have power over how you'll respond to uncertainty.”
― Yvan Byeajee,

Inverse Head and Shoulders| Key Resistance| Trend Change Hello Traders!
Today’s chart update will be on APHA which is forming an inverse head and shoulders, close to breaking its neckline.
Points to consider,
- Trend change attempt
- Structural Resistance/ Neckline being tested
- EMA’s acting as support
- Stochastics in upper regions
- RSI at resistance
- Volume increase
APHA is attempting to change its trend by testing a critical technical level that has rejected it multiple times; a break will establish a higher high.
Structural resistance, in confluence with neckline is being tested; a break of this level will confirm the inverse head and shoulders pattern, a bullish reversal pattern.
EMA’s acting as support, bull cross has come to fruition, must hold true when key neckline, resistance breaks for APHA.
Stochastics in upper regions can stay trading here for an extended period of time, however lots of stored momentum to the downside. RSI is at its resistance, key level being tested, must break for bullish bias.
Volume clearly increased, healthy volume that must sustain when trend change comes to fruition for follow through.
Overall, in my opinion, a break of the inverse head and shoulders neckline will confirm a trend change, a higher high will be establish, initiating a new trend.
What are your thoughts?
Please leave a like and comment,
And remember,
“Confidence is not "I will profit on this trade." Confidence is "I will be fine if I don't profit from this trade.”
― Yvan Byeajee,

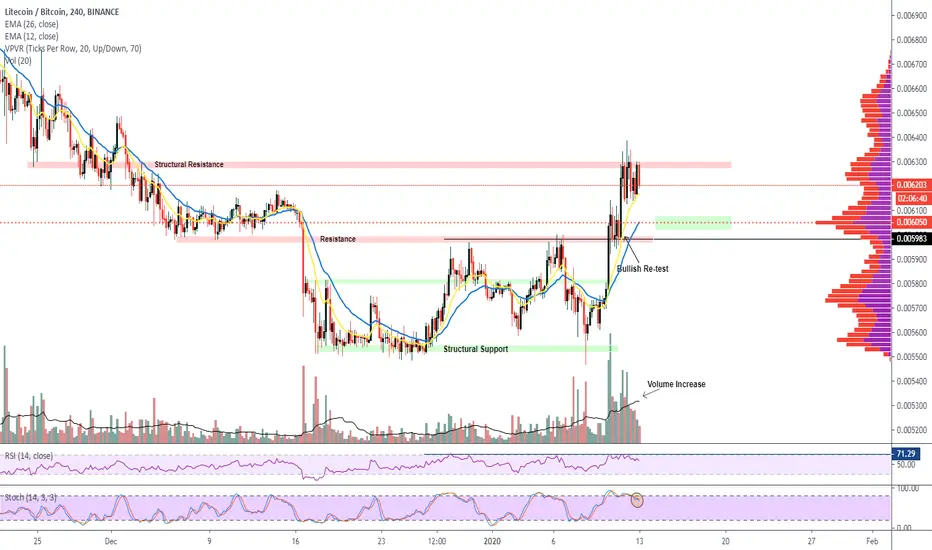
Structural Resistance|Market Structure Change|Volume Increase Hello Traders!
Welcome to another update,
Today’s chart will be on LTCBTC which has broken key levels negating the market structure. LTC is probable to reach higher levels before a bullish confirmation of the POC.
Points to consider,
- Trend change in fruition
- Major resistance broken
- EMA’s holding price
- Stochastics in upper regions
- RSI hitting resistance
- Volume increase
- POC bullish retest
LTCBTC trend change is coming to fruition as a new higher high is being established from local lows. Major resistance has been broken, a much staunched level that was confirmed with a bullish re-test.
EMA’s holding price as support must hold true for a continued bullish bias upon retests of key levels. RSI is trading at resistance; a return to neutral territory is probable in the near future.
Volume has increased visibly, confirming breaks of key structural levels; LTCBTC needs to sustain such volume for continuation in trend.
Overall, in my opinion, LTCBTC has clear levels to watch and break. A retest of the POC will be healthy as it will cool of indicators such as the RSI and Stochastics before another leg up.
What are your thoughts?
Please leave a like and comment,
And remember,
“You become fearful the moment you identify with fear. But once you begin seeing it as an impersonal changing phenomenon, you become free.” ― Yvan Byeajee,
Double Bottom| Key Resistance Confluence Hello Traders!
Today’s chart update will be on SILVER, which is approaching key resistance levels, that if broken, well change the overall market structure.
Points to consider,
- Trend considered bearish
- Structural Resistance being tested
- EMA’s support
- Stochastics in upper regions
- RSI currently overbought
Silver is considered to be in a bearish trend, it must break the lower high projection to change market structure, it has been putting in consecutive lower highs.
Structural resistance is being tested, very staunched level dating back to 2008, a break will be very volatile.
The EMA’s are currently support, must continue to hold Silver as it approaches key levels for a bullish bias.
Stochastics is currently in the upper regions, can stay here for an extended period of time, however lots of stored momentum to the downside. The RSI is currently in overbought regions, a return back to neutral territory is probable to cool of the RSI.
Overall, in my opinion, SILVER is at a very key level with resistance confluences. A break will change the overall market structure, it is however probable for Silver to have a slight retrace before making a bullish attempt.
What are your thoughts?
Please leave a like and comment,
And Remember,
“Markets are never wrong, but opinions often are.”

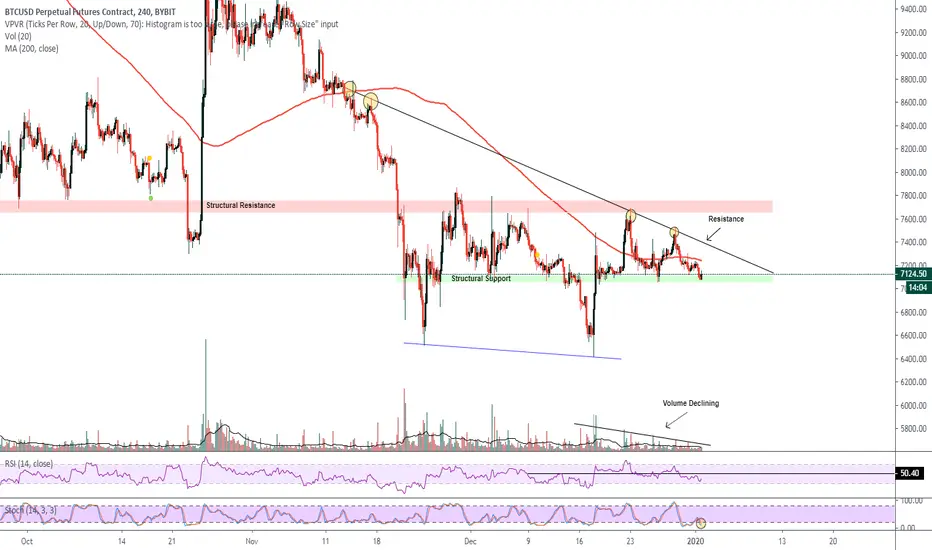
BTCUSD Consecutive Lower Highs | Key Structural Support Hello Traders!
Today’s update will be on BTCUSD which is in a defined down trend; Key levels needs to be watched for the direction of the overall trend.
Points to consider
- Trend bearish; Consecutive Lower Highs
- Structural Support holding
- Key resistance to break
- Stochastics in lower regions
- RSI neutral
- 200 MA to break
- Volume Declining
BTCUSD trend is clearly putting in consecutive lower highs signalling that sellers are in control. Structural support is holding, must hold for a bullish bias otherwise lower lows are probable. Key structural resistance to break, this will be bullish as it will change the structure of the trend.
Stochastics are in lower regions, can stay here for an extended period of time, however lots of stored momentum to the upside. The RSI is neutral, hitting its ceiling, must break otherwise bearish.
200 MA to break, currently is giving BTC resistance as it goes sideways. Volume is clearly declining; an influx of volume is imminent and will come to fruition very shortly.
Overall, in my opinion, BTC needs to break resistance to change the market structure, currently the trend is in full control by bears.
What are your thoughts?
Please leave a like and comment,
And remember
“There is a huge difference between a good trade and good trading.” – Steve Burns
$MDU Consolidation Before BreakoutTo wrap up the year I'm going to leave you all with one more idea I have my eyes on. In this situation, we're looking at $MDU.
MDU Resources Group is a stock that we have seen consolidate into two different patterns over the course of the last nine years. Both respective patterns have yielded excellent results as both have reached their respective targets. Now it is almost time for our third pattern to breakout.
This time we are seeing price consolidate into a three and a half year long rectangle.
I'm looking for a clear break (1W candle close) above the price of $30 (dotted purple line.) After we get a clear breakout above that level, I'm looking to enter a long position targeting the price of $36.20 for a gain of ~22%.
To further support the idea of a bullish breakout, we can see the 200 EMA resting below the breakout level, which adds to my conviction that we will see a breakout to the upside.
If you would like to see more of these ideas on a regular basis, follow me as I will be posting many more exciting chances to earn on chart pattern breakouts this upcoming year!
Drop a like or comment if you found this idea informational or helpful in any way. I wish everyone a happy and healthy new year!
Cheers

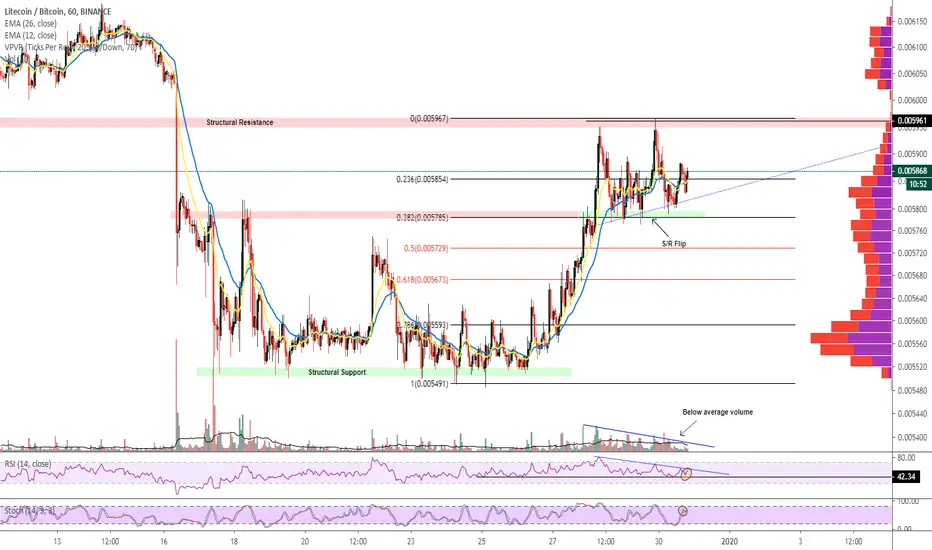
LTC/BTC S/R Flip | Key Technical Level Broken| Trend Change ?Hello Traders!
Last Day of the decade! Bring on 2020!
Today’s chart update will be on LTCBTC which has broken a key technical level and has consolidated- S/R Flip.
A confirmed trend change will come to fruition when structural resistance is broken,
Points to consider,
- S/R flip
- Strong structural support
- Strong Resistance to break
- RSI respecting support
- Stochastics trading in upper regions
- EMA’s close to support
- Below average volume
LTCBTC has broken a key level convincingly; it needs to consolidate as it confirms the S/R flip. Strong structural support indicates high buy pressure, wicks evidently signals accumulation in the local lows.
Structural resistance needs to break next; this will confirm a trend change as market structure will put in a new higher high after consolidation.
The RSI is respecting its support, in neutral territory but is coming close to its apex, a break will be imminent. The stochastics is currently trading in the upper region, can stay there for an extended period of time, however lots of stored momentum to the down side.
EMAs close to supporting price, it must hold price when testing structural resistance for a bullish bias. Volume is well below average, this signals an influx of volume is likely when testing key levels.
Overall, in my opinion, LTCBTC has broken a key technical level confirming the S/R flip. Higher lows need to continue to break key structural resistance, which will confirm the trend change, putting in a new higher high on the pull back.
What are your thoughts?
Please leave a like and comment,
And Remember
Timing, perseverance, and ten years of trying will eventually make you look like an overnight success. – Biz Stone
Happy New Year’s
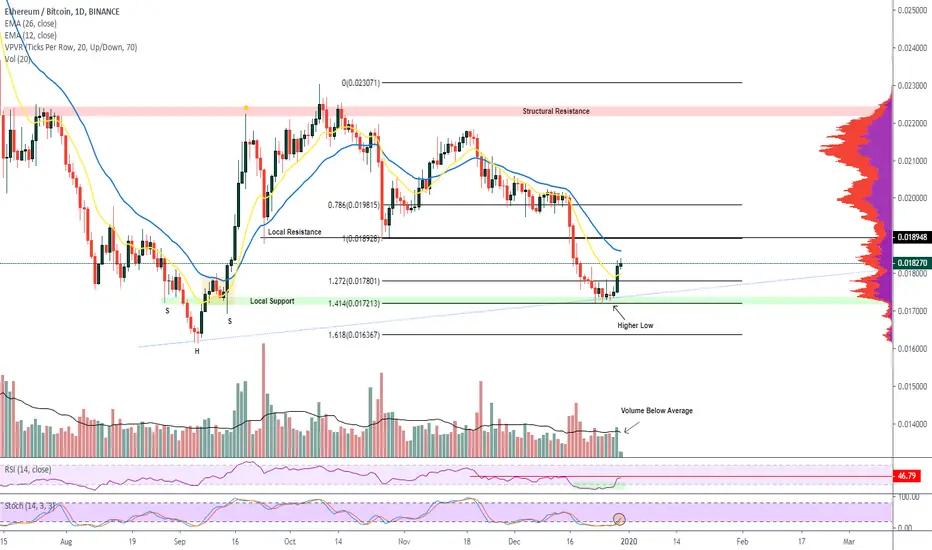
ETHBTC New Higher Low? | Volume Follow Through Needed!Hello Traders!
Welcome to another update,
Today’s chart update will be on ETHBTC which has put in a potential new higher low, possibly changing the overall bearish trend.
Points to consider,
- Probable trend change coming to fruition
- Local support respected
- Local resistance yet to break
- Stochastics in lower regions
- RSI hitting resistance
- EMA’s to cross bullish
- Volume below average
ETHBTC is attempting to change the trend by putting in a probable new higher lower which will be confirmed after initial consolidation. Local support was held and respected; buyers are strong in this area, a key level not to be broken.
Local resistance is the next key level, a break and consolidation above this level will confirm the trend change on the daily.
The stochastics is currently in the lower regions, can stay here for an extended period of time, however lots of stored momentum to the upside. EMA’s are giving price resistance at current given time, a bull cross will increase the probabilities of breaking local resistance.
Volume is well below average, a key indicator to watch, bulls need momentum with follow through otherwise a break to lower lows is probable.
Overall, in my opinion, ETHBTC needs to consolidate at current level; a potential bull flag is likely before another leg up. It is important to keep an eye on volume which will dictate the overall direction of ETHBTC.
What are your thoughts?
Please leave a like and comment,
And remember,
Timing, perseverance, and ten years of trying will eventually make you look like an overnight success. – Biz Stone
BTC Key Level| Oversold Bounce?Hello Traders,
Quick Update
Today’s chart we be on BTCUSDwhich is testing a critical support level
Points to consider,
- Trend bearish
- Major support being tested
- Stochastics in lower regions
- RSI approaching oversold
- EMA’s giving price resistance
- Volume needs to increase
BTC has put in consecutive lower highs with no clear sign in trend change on the shorter time frame. Major support is being tested that must hold for a bullish bias, a break will continue with the bearish momentum.
Stochastics is currently in the lower regions, can stay here for an extended period of time, however lots of stored momentum to the upside. RSI is hitting oversold conditions; a return back to neutral territory is probable, an oversold bounce.
EMA’s are currently giving price resistance, this will push BTC down if support does not hold true. Volume is well below average, an increase in volume in either direction will determine the trend direction.
Overall, in my opinion, BTC is in a critical point where a break in either direction will determine the overall trend. A bullish break will confirm a higher low and a bear break will increase the probabilities of further lower lows.
What are your thoughts?
Please leave a like and comment
And remember
“Hope is bogus emotion that only costs you money.” – Jim Cramer

OH Bullish Divergence|Local Resistance|EMA Cross| Higher LowHello Traders – Merry Christmas!
Today’s chart update will be on CANNAROYALTY CORP OH where a valid bullish divergence has come to fruition.
Will OH have enough momentum to break local resistance and put in a new higher low?
Points to consider,
- Trend bearish
- Local resistance at 4.950
- Local support provided by EMA’s
- Stochastics in upper regions
- RSI diverged, Respecting trend line
- Volume above average
OH is currently in control by the bears, consecutive lower highs have been in place, a clear trend change will require a daily higher low.
Resistance is found at $4.950, a key level for the bulls to break as this will put in a new higher low, negating the bearish trend structure. Support comes from the EMA’s as they cross bullish at resistance. This needs to maintain for a bull break of the key local resistance level.
The stochastics in currently in the upper region, it can stay here for an extended period of time, however lots of stored momentum to the downside. RSI has diverged from price, needs to maintain its trend line for a bullish bias.
Volume is above average, OH needs continued bull volume follow through if it is to break local resistance.
Overall, in my opinion, OH needs to break local resistance convincingly with follow through. This will change the overall market structure, putting in a new higher low. An entry will be valid on the bullish S/R flip re-test of the local resistance.
What are your thoughts?
Please leave a like and comment,
And remember,
A streak of winning trades can boost your ego and self-confidence to such an extent that you start believing that you’re invincible. If that is the case, try to take a break from trading to calm your emotions down.

BTCUSD Break of Support or Resistance?| Key $7800 level!Hello Traders!
Welcome to another update today, this time on BTCUSD daily timeframe
On the daily chart we have very clear levels that need to be watched in terms of support and or resistance.
Bitcoins next move will equate to either break of support or a break of local resistance - $7800, a very key level.
Points to consider,
- Trend bearish
- Local resistance at $7800
- Support at .618 Fibonacci
- Stochastics in upper regions
- RSI Diverging from price
- Volume below average
- EMA’s crossing
BTCUSD trend is currently in control by the bears as we have consecutive lower highs on the chart.
Local resistance is found at the $7,800 mark, a key level for the bulls to break in order to negate the overall market structure. Local support in confluence with the .618 Fibonacci level, must hold price. This needs to maintain in order to put in a new higher low in the trend.
The stochastics are currently in the upper region, can stay here for an extended period of time, however lots of stored momentum to the downside. The RSI has diverged from price, causing a bullish divergence. It must respect its now established trend line to hold a bullish bias.
Volume is below average, an influx of volume is required with convincing follow through in either direction to avoid false break.
Overall, in my opinion, BTCUSD is at a critical point where a break in either direction will dictate the fate of the trend. A bearish break of a key Fibonacci level will increase the probabilities of further lower lows. A bullish break of local resistance, $7800, will negate the bearish structure and put in a new probable higher low.
What are your thoughts?
Please leave a like and comment
,
And remember,
“It’s OK to be wrong; it’s unforgivable to stay wrong.” -Martin Zweig

BNBBTC Long Term Trend Line| Key Support Hello Traders!
Today’s chart update will be on BNBBTC, testing a strong structural support which is in confluence with its long term trend line.
Will BNBBTC respect this technical level?
Points to consider,
- Trend Bearish
- Structural support being tested
- Structural resistance needs to break
- Stochastics in lower regions
- RSI oversold
- EMA’s giving price resistance
- Volume declining
BNB’s trend is currently controlled by the bears, putting in consecutive lower highs as it comes close to very key levels.
Structural support is being tested, which is in confluence with the longer term trend line that must hold for a bullish bias. Resistance is yet to break; bulls have a lot of work to do to reach it. A break of resistance will put in a new higher high in the trend, changing the overall structure.
Stochastics is currently in the lower regions, can stay here for an extended period of time, however lots of stored momentum to the upside. RSI is oversold; a bounce back to neutral territory is highly probable.
EMA’s are currently giving price resistance, will continue to push BNBBTC down until a bounce in price comes true from support levels. Volume is declining, indicating an influx of volume is due in either direction.
Overall, in my opinion, BNBBTC is probable to bounce from current levels due to confluences from technical indicators. An influx of bull volume is required to push BNB further up from these levels.
What are your thoughts?
Please leave a like and comment,
And remember
In trading, everything works sometimes and nothing works always.”

New Open CME Futures Gap| BTC Resistance .618 Fibonacci Level Hello traders!,
Today’s chart update will be on BTC CME Futures chart which has just put in a new gap that will most probably fill sooner rather than later.
Points to consider,
- Trend hitting resistance, .618 Fibonacci
- .382 Fibonacci is local support
- RSI in overbought territory
- Stochastics in upper region
- EMA’s yet to meet price
- Volume below average
Local resistance, the .618 Fibonacci; is a key level for BTC to break to maintain a bullish bias, this will help create higher highs in the overall trend. Support is found at the .382 Fibonacci level, below the futures gap, bulls have a lot of room to work with in order to establish a new higher low whilst filling the gap.
RSI is resting on overbought territory; a return back to support is highly probable, this will help cool of the indicator. Stochastics itself is also in the upper regions, can stay here for an extended period of time, however lots of stored momentum to the downside.
EMA’s are yet to meet price, must hold BTC as support as the EMA’s have already crossed bullish. Volume is below average, an influx of bull volume is needed to keep BTC above support when and if it comes down to fill the open gap.
Overall, in my opinion, gaps tend to get filled sooner rather than later. BTC is highly probable to retrace back to at least $7255 level before another impulse move either up and or down.
What are your thoughts?
Please leave a like and comment,
And remember,
“Accepting losses is the most important single investment device to insure safety of capital.” – Gerald M. Loeb

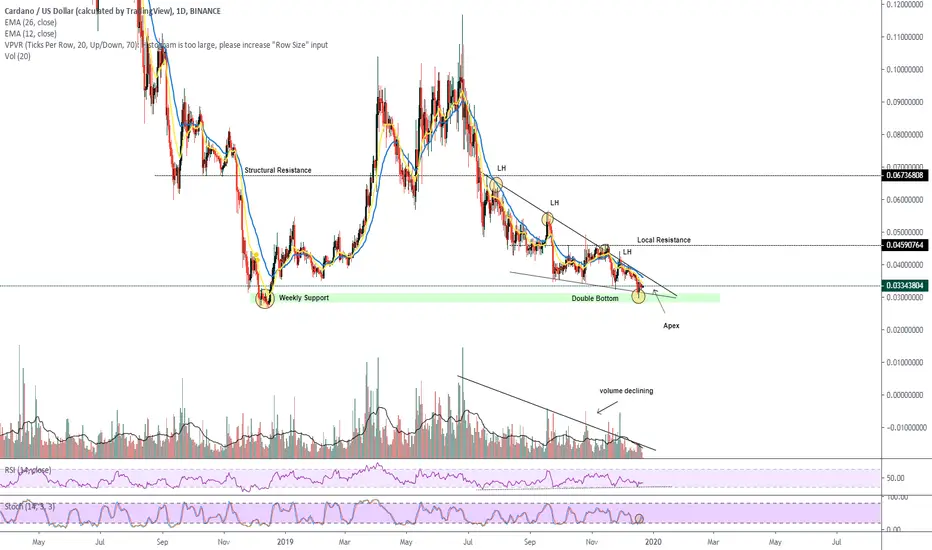
ADA|USD Key Weekly Support| Double Bottom| Lower HighsHello Traders!
Today’s update will be on ADAUSD, testing a critical level as it comes close to its apex, a move is imminent.
Points to consider,
- Bearish Trend
- Major weekly support being tested
- Local resistance to break
- Stochastics in lower regions
- RSI respecting trend line
- Volume declining
- EMA’s giving price resistance
ADAUSD has been in an establish bear trend with consecutive lower highs; it is testing a critical weekly support area that must hold as the lower high structure converges.
If weekly support holds true, ADAUSD will confirm a double bottom, which is a major reversal pattern. Local resistance will be the first target to break as this will put in a new higher high in the trend, confirming a trend change.
The stochastics is currently in lower regions, can stay here for an extended period of time, however lots of stored momentum to the upside. RSI is respecting its trend line, must hold for a bullish bias, a break will likely also mean a break in weekly support, which will be very bearish.
Volume is declining rapidly, signalling that a move is imminent as price comes closer to its apex. EMA’s itself is currently giving price resistance, a bullish cross will help negate the bearish trend.
Overall, in my opinion, this weekly support is probable to hold, ADAUSD is likely to break bullish from its apex, and an entry would only be valid if ADAUSD breaks local resistance with a bullish retest.
What are your thoughts?
Please leave a like and comment,
And remember,
“If you can’t take a small loss, sooner or later you will take the mother of all losses.” – Ed Seykota
STRATBTC Keys Resistance Broken| New Higher High!Hello Traders!
Welcome to another chart update,
Today’s chart will be on Stratis which has broken a key structural resistance level, now potentially support upon a retest.
Will Stratis continue with this bullish bias?
Points to consider,
- Daily trend change
- Key structural resistance broken
- Stochastics trading in upper region
- RSI in upper region
- EMA’s cross bullish
- Increase in volume
- VPVR decreasing in transactions
STRATBTC has confirmed a daily trend change by breaking a key resistance level and putting a new higher high. A retest of the key structural resistance will confirm an S/R flip; this is likely as we do have a small bearish divergence coming to fruition.
The stochastics is currently in the upper region, can stay here for an extended period of time, however lots of stored momentum to the downside. RSI is travelling in overbought regions; a retest of its support is highly probable.
EMA’s have crossed bullish, a strong indicator for a trend change, must hold true for Stratis if it starts to test upper regions.
Volume has clearly increased, this is very healthy and must sustain for follow though in price. The VPVR itself is decreasing in transactions, this signals that resistance is low for when Stratis when testing upper levels in terms of volume of transactions.
Overall, in my opinion, STRATBTC is likely to retest the now structural support to confirm a bullish re-test before making moves higher.
What are your thoughts?
Please leave a like and comment,
And remember,
“Once you find the system that works for your style/personality and confidence is gained, wash, rinse, repeat over and over again.” – Sunrisetrader

GBPCAD 1D MA-X STRATEGY
Tim's MA=X trade mgmt
Standard Trade Management Rules
1) If, after entry, the candle closes back on the opposite side of the 20EMA, close for a loss
2) Full Size Position if Vol >= 100% vol avg
1/2-Size Position if Vol >= 75% vol avg
3) Stop-Loss = 1.5 X ATR
1st Target = 1 X ATR
4) 1/2 off at 1st Target for profit - move Stop-Loss to break-even on remainder

MATICBTC KISS| Lower Highs| Key Resistance To BreakHello Traders!
Today we will keep our TA KISS = Keep it Simple Stupid, as we have a look at MATIC after a huge dump. It has manage to keep its higher low projection in place as it comes closer to structural resistance
Points to consider,
- Strong higher lows
- Major structural resistance to break
- Stochastics in upper region
- RSI bounced from oversold
- Increase in bull volume
- EMA crossing bullish
MATIC has established a strong trend line by putting in consecutive higher lows; it needs to hold this structure to keep a bullish bias. Major structural resistance is yet to break, an important level to break as this will put in a new higher high.
Stochastics is currently in the upper regions, can stay here for an extended period of time, however lots of stored momentum to the downside. The RSI has bounced strong from oversold conditions, currently in neutral area; a retest of support is probable.
Bull volume has increased slightly, needs to maintain as MATIC tests structural resistance otherwise a false breakout may come to fruition. The EMA’s are crossing bullish, it needs to hold price support as price tests and breaks structural resistance.
Overall, in my opinion, MATIC must break structural resistance with convincing bull volume. A break of this established trend will be extremely bearish, lower lows will be more probable in that case as the market structure will have then changed.
What are your thoughts?
Please leave a like and comment
And remember,
“The obvious rarely happens, the unexpected constantly occurs.” – Jesse Livermore

BTCUSD Strong Pump but Trend still Bearish Hello Traders!
Today’s chart update will be on BTC after its pump, which has put in yet another lower high in the trend.
Will this S/R flip hold BTC and break key resistance line?
Points to consider,
- Bear trend still intact
- S/R flip coming to fruition
- Key resistance line to break
- Stochastics in upper regions
- RSI in upper region
- EMA’s turning bullish
- Volume follow through required
Bitcoins consecutive lower highs have established a key trend line that needs to break for a bullish bias. This current S/R flip needs to hold BTC, and consolidate, as this will increase the probability of a trend change. Staunched resistance line needs to break as this will negate the lower high structure – a new higher lower will come to fruition.
The stochastics is currently in the upper regions, can stay here for an extended period of time, however lots of stored momentum to the down side. RSI is also in the upper region, a return back to support level is probable to cool it off.
EMA’s are crossing bullish; it needs to hold price support for a bullish bias. Volume itself is currently below average at current give time. BTC needs strong bull volume with follow through to break resistance and change overall structure.
Overall, in my opinion, BTC needs to break the staunched downwards sloping resistance line to negate the lower high structure. This needs volume follow thought to help avoid the chances of a false break. BTC is resting above support zone at current given time; this is a good sign for the bulls as it is confirming the S/R flip.
What are your thoughts?
Please leave a like and comment,
And remember
“Dangers of watching every tick are twofold: overtrading and increased chances of prematurely liquidating good positions” – Jack Schwager
**Please follow me on twitter for daily updates on fundamental news in the MJ and Crypto Speace ! :) Twitter handle in profile link

Gold SellHey traders, On the lower timeframes gold has formed a channel and i think this channel will break down immediately after testing the top blue line once more. Then the target for the colossal drop is the 0.618 of the most recent large move. 10 RR
