Cosmos(ATOM): Trying To Secure EMAsWhile markets are pushing, Cosmos has also had a nice small push.
With push being active, it is now trying to secure the branch of EMAs that is holding the price as of now. This zone will decide the next major movement for the coin.
Swallow Team
Exponential Moving Average (EMA)

VeChain(VET): Waiting For A Breakdown!Another coin that is looking promising is VeChain, where we are looking for a potential breakdown that would result in a nice downward fall in the market price.
We are going to look for a breakdown as long as we are below that 200EMA, so keep an eye sharp for this one!!
Swallow Team

Dogecoin(DOGE): 2 Potential Scenarios To TradeAs Dogecoin is in a "calm before the storm" situation, we are looking here for two potential trades that can be taken: bullish and bearish scenarios.
For Bullish scenario we need to break at least that 100EMA which would activate two potential long positions where for Bearish sceanrio we need to close price below 200EMA and secure it fully for a potential 22% of marketprice movement!
Swallow Team

CMG - it might be expensive but the value is there LONGCMG on the weekly chart has been uptrending for a year after being rangebound sideways for a
year. It has seen a volume spike and corresponding price action with the current earnings beat
Price rose 60% in the past year and 16% YTD. This is not linear and nor is it parabolic.
The MACD supports the bullish momentum observation in the price action while the RS indicator
shows good strength in both shorter and longer time frames. This is a blue chip megacap for
sure. While it is not technology like the MAg7, the food business is lucrative. the CEO in the
earnings call announced plans to expand to 7000 stores nationally. This is ambitious. Those who
are ambitious investors or traders and are well funded could consider adding some shares
or even a few options of CMG. I am going with a few options OTM at $3000 six months out.
I believe that I will be well rewarded for the risk taken especially given the expansion plans
and the historical track record here.

BTCUSDT.PBased on EMA and Ichimoku on 4H time frame moving on the following path is more likely to happen

ALICEUSDT.Paccording to my strategy, i am looking for the following paths. at first short postion and in the following long position in two level is more probable

ONEUSDT.PIn the 1-hour time frame, the 1-hour order block (OB) hasn't been confirmed yet. Its confirmation depends on the 1-hour break of structure (BOS), which hasn't validly broken the recent low. If a short position is taken with a target set at the 4-hour order block, there might be fluctuations before bouncing from that zone.
On the flip side of this analysis, the 1-hour order block is not confirmed as a take-profit point for a long position.

Uniswap(UNI): Rejected From 200EMAUNI had a nice rejection from 200EMA, where the price turned down sharply!
We are looking here for a potential movement towards that support zone while also looking for a potential re-test of that 200 EMA, which might be our next resistance zone.
Swallow Team

Ripple(XRP): Waiting For EMAsThis was a very easy TA on XRP this time. We are looking for EMAs to be touched and show some rejection, which would be a sweet entry for a potential short position!
We are waiting for the upper zones to be reached!
Swallow Team

Chainlink(LINK): Getting Ready For Another Rejection?LINK coin is another one that caught our attention with a great possibility of downward movement here!
We see that upon reaching that upper line of BB, we are getting rejected multiple times and now we are seeing that last time we had reaction, we had a really nice attempt to move further but we got stopped by 100EMA
We are looking here for a good rejection to happen (another one), and once we get it, we will be looking for a short here!
Swallow Team

Decentraland(MANA): Should We Buy or Sell?MANA has been pushed to the end of a tight gap where the price is nearing a breakout or breakdown soon.
We are looking here more for that downward movement to happen but we might as well see a quick liquidity breakout, which would result in a price movement towards EMAs
Swallow Team

Bitcoin(BTC): Get Ready, We Might See A Fall Soon!As Bitcoin is hunting those upper liquidity zones, we are looking for the price to hover for some time there and eventually move and test that $40K zone.
Currently, after a significant breakout from the $40K zone, we are seeing that volume is slowly fading away, which indicates a potential re-test to happen soon!
Swallow Team

Aave(AAVE): 200 EMA Broken!!!! Now Where? Coin has broken so compliantly that 200EMA is currently re-testing this same EMA.
As long as this re-test holds its zone, we might see some further movement to the lower zones, but if the re-test fails and moves slightly to the upper zone, we might move towards our upper, smaller resistance that we displayed as "orange" zones!
Swallow Team

Hooked Protocol(HOOK): 200EMA Holding Strong!!200EMA has been tested multiple times and has been holding strong! With the bullish movement it has been having, it shows good strength for potential growth here, for sure, but we need to keep an eye on that EMA!
As long as we are above the 200EMA, we are going to go further to the upper zones! Once the 200EMA is broken and secured by sellers, we can see some major corrections for HOOK to come!
Swallow Team

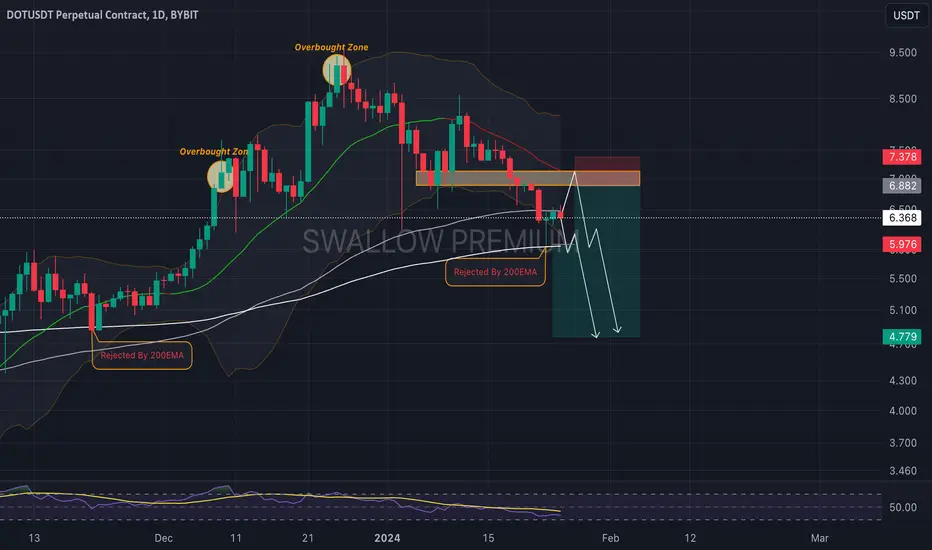
Polkadot(DOT): Looking For Short 👀 DOT is looking for a good entry to move to lower zones, it seems.
After another touch at 200 EMA, the price has bounced back up but remains in between 100 and 200 EMA.
We are monitoring for market price movement here and any potential correction to upper zones or a potential breakdown from 200EMA.
Swallow Team
Bitcoin Cash(BCH): Waiting For BreakdownBCH has been teasing both EMAs for some time now and we see a nice downward movement to happen sooner (after securing that 200EMA)
After that confimational breakdown, we will most likely see a lower support zone being reached there!
Swallow Team

Binance Coin(BNB): Waiting For $335 ZoneBNB has been showing some massive strength here, where prices bounced nicely from 200EMA and 100EMA as well.
$335 zone has been a point of interest for us, and with the current push, we are seeing pretty high price changes heading there!
Once we are there, we will be looking for any potential downward movement or rejection from there!
Swallow Team

EURJPY 30m chart potential Falling wedgeThe the 30m chart the EURJPY is forming a potential falling wedge. On the chart infront, you can discover a bullish market structure
Additional confluences:
- Price has dropped to the support range created from the previous major high
- The price is testing the 0.382 Fib. Have in mind that the 0.5 and the 0.618 levels are also in the support range so it is possible for the price to drop lower. If it does, monitor if it's still in the ranges of the falling wedge. If it goes out of them, then the pattern will be invalidated.
- Price is close to the 200 EMA, Might drop a bit lower to test it before providing a potential breakout of the pattern to the up side

Bitcoin (DailyAnalaysis)Hi.
Bearish divergence is playing out☑️
Now we need to break below the cluster of 50 MA + Dashed S/R Trendline 📉
✅Thank you, and for more ideas, hit ❤️Like❤️ and 🌟Follow🌟!

Gold at a crossroad, 200 USD+ move, massive symmetrical triangleThis is a Daily chart for Gold. On it we can notice that the price has formed a massive symmetrical triangle. As per the deffinition of the pattern, after the price produces a breakout up or down, the potential movement can be equivalent to the distance between the highest and the lowest points in the pattern. This is about 215 USD movement
If the price breaks to the up side, according to the pattern, it can reach levels of about 2250 - 2270. If it breaks down then it can drop close to the 1800 level
Additional confluence:
- On the daily chart, the price has been showing a lot of respect towards the 50 EMA. On the latest drop it hit it and bounced straight up from it. On the 4H chart, the situation is similar with the 200 EMA

Theta(THETA): EMAs Are Holding The Price!Theta has reached the zone of EMAs, which is holding the price back, or is it?
We have displayed here the major resistance and support zones and two possible scenarios to happen upon breaking out or breaking down from those EMAs.
What do you think? Which way will we go?
Swallow Team

Sandbox(SAND): Bounce To Upper Resistance?Sand had a nice breakout from EMAs, securing this zone perfectly!
We are looking here for a potential bullish bounce to the upper zones, which should be a sweet spot for a potential short position!
We are not going to enter currently with a position as it is still a little early (just recently we secured EMAs but still showing a weakness near that zone)
Waiting out for perfect setup and a potential bounce to upper zones here!
Swallow Team

Enjin Coin(ENJ): Waiting For Perfect Entry! ENJ has been on an amazing rally since October, with prices reaching closer and closer to the major resistance zone.
With them being reached, we are going to look for a potential sell position here, where the target would be towards 200 and 100 EMA.
Swallow Team
