atentos posible movimiento alcistaen este caso, el par xrpusdt muestra una tendencia alcista en la temporalidad determinada, sin embargo se han detectado divergencia alcistas, lo que podría indicar un impulso alcista, hasta zona objetivo de ema20 & ema200 fuertes resistencias + resistencias relevantes presentadas, stop limit se considera al romper con gran volumen de negociación el soporte presentado.
Exponential Moving Average (EMA)

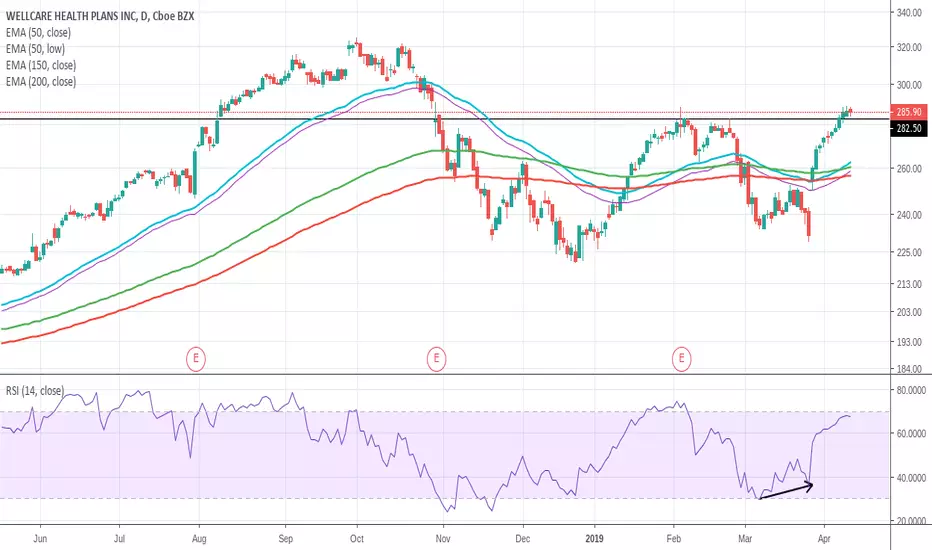
WCG Possible Long Position- Momentum TradeStrength based on RSI.
Could set SL at 276.68, then TRAIL SL to try and take full advantage of potential upside .
Peace & Love
GOLD SLOW STOCH SIGNALToday I introduce you to the slow stoch analysis where we will see that if the arrow part goes above then we have a very strong signal from the bulls but if the bow reaches the bottom the salespeople will try to break another resistance in 1287 and continue with down to 1280.

POSSIBLE LONG POSITION:USD/CAD RANGE.Here you can see my technical analysis on USDCAD for the week ahead, there seems there may be a range forming between a recent high and a resistance that has been tested many times which has given a strong resistance - in this case I believe that it will have turned into a support bouncing off the trend line I have fond on 4H and the support/resistance I have found on all time frames.
in terms of indicators the 8,5 EMA'S I have are soon to cross over on 15m, 30m and 5m which shows a reversal in price instead of a retracement which supports my idea of a range.
additionally, bearish momentum is slowing down and is in oversold territory and it moving averages crossing over - once again indicating a reversal.
I have showed my long position with TP and SL visible
thanks for reading - please leave ideas and feedback

YELLOW METAL Looking TO Complete H & S Pattern On DAILY Chart!
The above snapshot represents the daily chart of the yellow metal. it can be clearly seen that the head and shoulder formation might just be about to completed soon!
The main chart (4hr) shows the channel has been breached with EMA 50 adding further confluence to downward move which could target the potential neckline of the overall H & S formation.
Once the overall pattern is complete, its safe to say that this pair can potentially drop towards to 1267.000 level where the long term weekly ascending trendline lies!.
Looking at the big picture, i am overall LONG on GOLD, however i would only enter LONG once the price hits the 1270.000 area so the better risk to reward ratio is by my side. At the moment i am short on this metal. If you would to take short this yellow metal based on your own comfort and analysis i suggest the following trade entries:
ENTRY LEVEL: CURRENT PRICE 1300.000-1307.000
STOP LOSS: 1330.000 (ABOVE THE RIGHT SHOULDER)
TAKE PROFIT: 1267-1270 LEVELS
PLEASE FOLLOW THE ATTACHED LINK IF YOU WOULD LIKE TO TAKE THIS TRADE. I WILL BE UPDATING ANY CHANGES IN THE LINK ABOVE. cheers

CADJPY, LOONIE Might Break The Channel to Test 84.3000 Vs YEN Once the channel breaks together with the daily 50 EMA, we can expect the price to go north and test the weekly 50 EMA which lies at 84.300 level. the blue line support is derived from the monthly charts and its a concrete support which has been rejected and the price shows it might climb up. For this to happen the channel must break.
This just represents my analysis of the pair, shall there be any updates in the future regarding trade entry i will post them in a new thread. cheers

EURJPY (CROSS) Heading South To 123.400 ! A SHORT Trade setup ENTRY TYPE: IMMEDIATE ENTRY AT AROUND 124.900 LEVEL
STOP LOSS: 126.000
TAKE PROFIT: 123.400
RR: 1:1.55
SHALL THERE BE ANY UPDATES I WILL UPDATE THEM IN THE THREAD AS NEEDED. CHEERS

AUDJPY Looking To Break Range To Target 81.000 level!AUDJPY is currently range trading that is visible by looking at the 4hr and daily timeframes. Looking at the main chart it can be seen that the price is confined in between the blue lines (range). Shall a breakout of the range occur to the upside, the price will look to target the 81.000 area where the weekly EMA 50 is present. Have a look at the snapshot of the weekly charts below:
From the chart above, the price is confined in a descending channel and is currently en-route to testing the dynamic EMA 50. Furthermore, the 78.000 psychological level is a concrete support drawn from the monthly charts which has been rejected on too many occasions notably most recently on the monthly candle and the flash crash that happened last month.
A LONG position is favored only if the range breaks to the upside, in other words the daily candle and NOT the 4hr Candle must close outside of the range on the daily charts. Followed by a slight retracement before we could execute a LONG entry. In the future if the price decisively closes above the weekly 50 EMA we could take this pair LONG towards the descending trendline of the main weekly channel.
RISK ON appetite in the market would make AUD more valuable in comparison to safehaven yen which tends be sold off more together with GOLD AND CHF, therefore if a trade deal is made which is a likely scenario we can expect the AUD to rally against the YEN.
This just represents my analysis for this pair, shall the opportunity arise i will post the entry criteria in a new thread. stay tuned and cheers

A Close Above MONTHLY 50 EMA Could Take NZDJPY Towards 83.500 Price is currently confined in a descending channel or wedge on the weekly charts with multiple tests occurring on both sides of the channel making it more and more potent if a breakout occurs!
The blue lines on the main charts represent the support and resistance levels drawn from the monthly charts and as of few weeks ago the 75.000 level was respected and now the price seems to be heading towards the next resistance that lies in the 83.000 region. For this to take place the channel on the weekly charts must be broken convincingly and most importantly the MONTHLY 50 EMA must be broken to the upside (the monthly price candle must close above the monthly 50 EMA). Have a look at the picture below for further illustrations
Once all these take place and fundamentals starts to align with technical picture, we can take this pair LONG with swing trading chance towards the 83.5000 level.
On the flip side, shall the trendline gets rejected again on the weekly charts, then we can take this pair SHORT (day trading chance) towards the support beneath at 74.5000 level. see the image below for the technical aspects for the SHORT trade
If the wedge is broken, the daily 50 EMA must be broken too in the process for the SHORT trade to be confirmed. Once this all takes place we wait for the price to slightly retrace before making an entry
Shall there be any updates i would provide them in a new thread. this just represents my personal technical analysis behind this pair.

EURJPY Likely To Fall Further! A SHORT trade SetupTRADE TYPE: SELL WHEN THE MARKET OPENS AT AROUND 124.800 LEVEL
STOP LOSS: 126.750
TAKE PROFIT: 123.000
RR: 1:1
TECHNICAL ANALYSIS
With the trendline and channel on daily charts broken convincingly, the cross is aiming to test the next crucial support that lies in the 123.000 level! Price has already given the confirmation and the short trade can be executed once the market opens on monday. There are other crucial technical analysis that are too long too explain behind this trade setup, all in all the analysis is based on weekly charts but the structure on the daily TF has given me enough confirmation to take this trade short
FUNDAMENTAL ANALYSIS
Well what can be said about the EUR! ECB on thursday surprised the markets by its more than expected dovish announcement which sent all the EUR pairs into high selling pressure. The EUR is sentimented to fall further in the coming days.
Shall there be any updates i will provide them here. cheers

BTCUSD H4/D1 charts (3/11/2019)Good morning, traders. Bitcoin attempted to push above $3950 this weekend but could not make it happen. As I have been mentioning, there is strong resistance up toward $4000 and overcoming it won't be a walk in the park. Last night's downward move bounced off the daily 21 EMA, finding support on the HVN. An H1 gap was created around $3888 and RSI just bounced off oversold. H4 price is printing higher lows between March 8th and today while RSI is printing lower lows. This all suggests some temporary bottoming and a move up toward $3900 at the least.
If we take a look at the H4 channels we can see price attempting to push through the horizontal TR's resistance. Price moved up with four touches on the ascending channel's support. Since the Friday high, it has moved within the descending channel inside it, with some sideways actions happening between the resistance levels of the two horizontal channels. If we see price close above $3900 then we should see it target the ascending channel's resistance. With the H4 RSI touching its descending channel support, and price finding support on the HVN/D1 21 EMA as well as bouncing off the D3 support level, it makes more sense for price to move up from here rather than down. We can also see a bullish hammer printing on the H4 TF signifying a likely reversal. Traders should be cautious around the Friday $3950.25 swing high as price needs to close above it before it can target the mid-$4100s/H4 R2 pivot and nearby swing high of $4190.
March 10th saw the daily MACD rejected at the bullish cross. The ascending channel on the D1 chart shows price's possible path toward a double top at the ATH descending resistance. The truth is, there are many paths, down and up, that price can take at this time and many retail traders will lose a lot of money attempting to trade the noise in this area. Lack of patience permeates the retail trading sphere spurred on by emotional get-rich-quick overnight millionaire thoughts. Traders that insist on day trading this level should be much more intent on locking in profits earlier and completing shorter term trades. Those looking to buy in for a longer term run toward $5000 or more are best served by closing the chart once they buy and not looking at it again for a few weeks at least.
Finally, as some of you may be aware by now, Binance has scheduled maintenance planned for tomorrow. I have seen "analysis" suggesting that since price dropped through the $6000 level soon after the November 12th Binance maintenance, that price will drop this time as well. While it's always possible, the glaring difference that immediately occurs to me is that price was sitting on support at that time while it is now sitting at resistance. If the same manipulation storyline is followed, then logically it would suggest a push through resistance not a drop in price.
If further movement to the downside occurs, then I would want to see the February 27th swing low hold at $3658.19. What this means is that I don't want to see a daily close below that. A wick below and close above would print a bullish SFP and signal likely upward price progression once again. Prior to that point, I would want to see the H4 March 8th swing low at $3760.10 hold.
Every day, we have a choice to act positively or negatively, so if you get a chance, do something decent for someone today which could be as simple as sharing a nice word with them. You just might change their day, or even their life.
Remember, you can always click on the "share" button in the lower right hand of the screen, under the chart, and then click on "Make it mine" from the popup menu in order to get a live version of the chart that you can explore on your own.


ETH 20+100 Day EMA Crossing Upwards (again)As referenced in ETH's daily chart, within the past month, the following price fluctuations were observed upon its 20Day EMA crossing with the 100Day EMA:
On February 10th, subsequent to 20/100 Day EMA crossing (upward), ETH price increased approximately 8.31% (or $9.61) within 24hrs;
On March 3rd, subsequent to 20/100 Day EMA crossing (downward), ETH price decreased approximately, an additional (?) 3.76% (or $4.80);
As of the time of this writing, the Daily RSI is currently @ 62 and the 20+100 EMA's appears to be crossing in an upward direction. Whether the EMA's actually crosses and action follows, TBD.
This is not a recommendation, only my observations and for informational reference.

Know Your Sh-- Er, Poop: Bitcoin Testing Its Bullish Status!Hey there, TradingView... long time, no chat! If you're like me, you've been waiting the past two-plus months to find a clear sign that Bitcoin has either: (1) “officially” bottomed already, or (2) pushed itself to another point of capitulation, thus creating a new and (likely) final bottom. In the time since BTC dropped from 6K to 3.1K, it has not closed above 4.2K or below 3.3K. So this waiting game is starting to get tiresome…
Luckily, we’re finally seeing some major developments, and I’ll illustrate WHY THIS IS BIG by pinging off a pair of ideas.
IDEA ONE: Bitcoin may come to test its bottom via the 200-week moving average (by tabsports)
Back in December, I published the idea that I will not buy long-term just yet, because Bitcoin was testing the 200W-MA (around $3178 on Bitstamp at the time of publishing). I then concluded my idea by claiming that BTC will either: (1) fall below the 200W-MA, thus giving us one final bit of capitulation while establishing the long-term bottom, or (2) bounce back from the 200W-MA, only to revisit this moving average to test the “official bottom” of the post-19K bear market. The former situation would’ve established the bottom within weeks, while the latter meant we would need months to see the bottom.
As you can safely conclude, the former has played out. I published the idea in question on December 15. By the time the next weekly candle closed, BTC was up around the 4K range. It peaked at around 4.2K before Christmas, before the price eventually fell back to the 3.3K range at the Jan19-Feb19 turn of the month. At the time of the fallback, the 200W-MA was around at $3298.50 and $3315.57 on Bitstamp for the two weekly candles in that timeframe. ONCE AGAIN, Bitcoin bounced off the moving average, and it pushed back to the 4.2K peak before taking a regression-based tumble on Sunday.
Despite this development, I’m hesitant to call the bottom just yet. I was burned when calling the 6K bottom, despite Bitcoin resisting the bears at 6K about four or five times. Maybe it was too much natural bear pressure that caused the eventual breakdown. Maybe it was the Bitcoin Cash drama. Either way, it destroyed an idea that held up for six months. As a result, I’m going to be more cautious after taking that L.
IDEA TWO: Bitcoin may have established its bottom by breaching the 50-day exponential moving average (by MagicPoopCannon)
Here’s where I give somebody else props, because his idea gave me some inspiration. While MPC was calling a 3K bottom (or worse) back in April (or earlier), I was focused on short gains that were bouncing off a 6K bottom. That initial idea worked for me, taking Bitcoin from 6.8K on Coinbase at the time of publishing to 9.9K about one month later. However, that was merely a short-term triumph.
Now, it’s clear that 3K bottom was reached... or worse. If you sold at the dump below 6K, you didn’t suffer much. But if you held, odds are you are still hoping for a major recovery to help your gains. Luckily, MPC recently pointed out that Bitcoin has surpassed its 50D-EMA , and this is a bullish sign. (Seriously, go give a read to his ideas related to this focal point of analysis. He deserves credit for the insight.)
Using this idea as inspiration, I show in this chart a comparison between the 50D-EMA (amber) and the 5-day volume-weight moving average (dark grey). As you can see, the 50D-EMA is greater than the 5D-VWMA on Coinbase for the first time since the Aug18-Sep18 turn of the month. Indeed, this is a short-term bullish sign. However, now we must consider that $400 drop on Sunday. At the time, the daily RSI was overbought, and I personally stay away from buying. Sunday’s dump was pretty hasty and nasty, but it did the important thing of holding up at the 50D-EMA. It has even bounced back a bit in the past day. This is a potentially great sign that both the active Bitcoin price and 5D-VWMA will stay above the 50D-EMA for the upcoming days and/or weeks.
Keep an eye on how these two developments play out. Monitor the 200W-MA (Bitstamp), 50D-EMA (Coinbase) and 5D-VWMA (Coinbase). If the 5D-VWMA resists at 50D-EMA, it means the bulls have a chance to truly get this run going. If it fails and goes back to the 200W-MA, it means we’re left to speculate the Bitcoin bottom once again. And finally, if it breaks below 200W-MA, it would likely mean once final bit of capitulation. (The good news in the last case is that there’s a juicy buy and perhaps the much-desired arrival of the crypto winter solstice. Seriously, enough waiting... I'm eagerly awaiting the next crypto spring!)
So, to conclude, know your poop about these Bitcoin developments! THIS IS NOT ADVICE TO BUY OR SELL, but rather a call for further research on how Bitcoin is establishing/testing both its long-term bottom and short-term bull status. Once we see how these developments play out, we’ll know when and how to take some real action.
Until then, happy trading!

4 Point Payout! 95% accurate NKCKWhen the WMA crosses up over the two EMA bands expect the trend to continue up, you should also wait to see it flip on the Awesome Oscillator. And expect the opposite for a sell. For quick results use this on the 1 min candle stick.

A Close Above Daily EMA 50 Might Take EURNZD To 1.69000 level !1.65000 level represents the concrete support level drawn from the Monthly charts, which has been clearly rejected and the price now aims at breaking the channel that it is confined in and close above the daily 50 EMA!
A convincing close above daily 50 EMA needs to take place, thereby giving further confluence that the price is headed towards the 1.69000 level!
1.69000 level is the area where the weekly 50 EMA is present and can often act as a dynamic support and resistance and therefore our target would be that level. In the future if the price breaks the weekly 50 EMA we can opt to take this pair further LONG to the next resistance (THE RED LINES ON THE CHART)
On the fundamental aspects the AUD and NZD are both set to depreciate this year with the reason being they are too overvalued at the time. I feel a drop in NZD against the USD will likely happen soon and this will inturn have great impact on the EURNZD too. It remains to be seen if the technical aspects meet in the coming days.
shall there be any trade entries i will post them in a new thread. this just represents my analysis and outlook of this pair. cheers

Happy Fibonacci Friday ... staying Long $BTCBullish signals coming from the RSI and the ADX, but the only thing lacking is volume.
Cautiously optimistic, but staying long.
Have a good weekend!

My BTC forecast (NOT Professional)Once upon a time,
Based on my hypothetical assessment, this chart reflects the "starting point" of the triangle to be June 4, 2018 "DEATH CROSS". In light of the 200 Day EMA's current trajectory, and established LOW, it appears to support the few rejections aligning the top of the triangle nicely as noted by the yellow circles. As such, IF all things stay equal, my BTC forecast for the next few months are as follows:
+Best case scenario, BTC makes a significant trend change on/around April 20th;
+Worst case scenario, BTC makes a significant trend change on/around May 20th;
+Doomsday scenario, BTC breaks below 3,100 (YOU pick a day)
*The green lines are reasonable representations of the price channel BTC will bounce around-in, with "slight" deviations above/below it of course, until the significant trend change occurs (i.e. "GOLDEN CROSS").
The End.

WHAT IS YOUR DEFINITION WHAT MAKES A TRENDThis defines a trend in such in clear terms that it applies to any time frame, any symbol, any market, any time of day.
Here are some definitions I have heard what is a trend
A trend demonstrates higher highs, or lower lows. Really? how many bars of "higher highs" or "lower lows" are required to define a trend?
The trend is your friend until it ends," because most people don't even know when it started! Let alone when it's about to end, or reverse and run up a margin call.
What do you use to determine "The Trend?"

Bitcoin Daily Update (day 334)Disclaimer: If you are primarily interested in copying other people’s trades then this is not for you. However, if you are willing to put in the work that it takes to learn how to trade for yourself then you have found the right place! Nevertheless please be advised that you can give 10 people a profitable trading strategy and only 1-2 of them will be able to succeed long term. If you fall into the majority that tries and fails then I assume no responsibility for your losses. What you do with your $ is your business, what I do with my $ is my business.
Click here for my Comprehensive Trading Strategy | Click here for my Comprehensive Trading Process | Click here to learn about the 2 BTC' to 20 BTC' Trading Challenge
Consensio: P > S EMA > M EMA > L EMA (rolling up) = fully bullish
Patterns: Phase 7 Hyperwave | A&E
Horizontals: R: $4,259 | Will $4,113 become support?
Trendline: at $4,500
Parabolic SAR: $3,656
Futures Curve: Spot < March > June
BTCUSDSHORTS: New local low. Next support at 17,000. If that breaks down target would be 10,000
Funding Rates: Longs pay shorts 0.0008%
TD’ Sequential: G8 | TDST = $4,275
Ichimoku Cloud: Just got bullish kumo twist. Very interesting how that happened at ~ the same time as the 50 EMA rolling up.
Relative Strength Index: 77
Average Directional Index: Weekly is getting close to turning bullish. 3D just did it.
Price Action: 24h: +5% | 2w: +13.5% | 1m: +16.8%
Bollinger Bands: 3D closed above top band. Love the Daily getting stuck to the top band.
Stochastic Oscillator: Bullish recross > 80.
Summary: Now is the time to be very careful. If you went long over the past week then now is the time to adjust stop losses, if you haven’t already. I have moved my stop losses on ETH and BTC well into the profit and that is a very good feeling.
If you did not long over the past couple weeks and want to now then ask yourself why? Are you getting a great setup to enter or are you feeling emotional / FOMO?
The 200 W EMA is rolling over and is currently being tested for resistance. It has held strong since November of 2018. Even if we do get through that area then there is a bear TL and 200 D EMA waiting directly above. If we can get through those areas then the volume profile indicates a high probability of returning to $6,000.
If not in a position then I would not be entering long now. We are overbought, on a green 8 at major resistance. If it were me then I would stay on the sidelines and look for signs of exhaustion and be ready to enter shorts. I do think this bounce still could have some room to go but there is no way I would feel comfortable entering a swing trade now.

Bitcoin Daily Update (day 333)Disclaimer: If you are primarily interested in copying other people’s trades then this is not for you. However, if you are willing to put in the work that it takes to learn how to trade for yourself then you have found the right place! Nevertheless please be advised that you can give 10 people a profitable trading strategy and only 1-2 of them will be able to succeed long term. If you fall into the majority that tries and fails then I assume no responsibility for your losses. What you do with your $ is your business, what I do with my $ is my business.
Click here for my Comprehensive Trading Strategy | Click here for my Comprehensive Trading Process | Click here to learn about the 2 BTC' to 20 BTC' Trading Challenge
Consensio: P > S MA > M MA > L MA
Patterns: Phase 7 Hyperwave | A&E
Horizontals: R: $3,992 | S: $3,859
Trendline: At $4,536
Parabolic SAR: $3,539
Futures Curve: Contango
BTCUSDSHORTS: Watching for it to take out the local low at 18,970
Funding Rates: Longs pay shorts 0.0065%
TD’ Sequential: G6
Ichimoku Cloud: Very surprised that we haven’t seen a bullish kumo twist
Relative Strength Index: Testing 70
Average Directional Index: Bull trend on daily. +DI is starting to approach -DI on the weekly.
Price Action: 24h: -0.4% | 2w: +16.3% | 1m: +10.5%
Bollinger Bands: Weekly is very bearish and the MA is in confluence with the TL
Stochastic Oscillator: Sell signal
Summary: I was hoping to see some more follow through out these last 24 - 48 hours. The volume was there on both breakouts (Feb 8th & 18th) however we have petered out at $4,000 horizontal resistance.
The fact that we continue to consolidate above the 4 EMA is a very strong sign as far as I am concerned. We didn’t smash right through resistance and that left us with two options. Get rejected hard and retrace the full rally from $3,600 or see support move up and consolidate.
The longer we continue to support above the 4 EMA the more likely I think we are to pop through it hard and fast. If that happens then my targets are the bear TL and the 200 day EMA.
If not in a position then I would shy away from BTC due to the resistance that is stacked from here to $5,000. However, there are some other options that appear to have less resistance and better risk:reward ratios.
XRP and BCH look ready for a big rally that might lead the rest of the market through this current area of resistance. Both recently had an ABC correction that pulled the price into a golden cross with the 50 & 200 EMA’s on the 4h chart.

PT.Wijaya Karya (PERSERO),Tbk - Short The Bounce,Long The TrendHello Guys,
i'm back again,i'll describe you guys about the $WIKA indonesian stock movement in further days. as you can see in above chart, i make a possibility movement using moving average expotentional (EMA) indicators setup. in recent days,a lot of red candles there & if you see that red & purple EMA was crossing too which basically tell us if there will much possibility more bearish movement in the further days. but today candle marked with 2,36% gain was a good sign for a little bounce (bounced at 100-EMA support) toward previous resistance,so i'm gonna short it!.
if we can hold & marching from 0.236 resistance,then there is a big chance we can test the rally again to Rp. 1971 area. but if that bounce that i'm shorting is just a 'dead cat bounce' (bigger possibility in my assumption), then we gonna fall again to the next support that i draw on the chart in 0.618 fibonacci retracement golden ratio line which is refer to below around 30 Rsi area too.
even the EMA 200 below & was crossing the 100-EMA (a trend reversal),i don't expect we can continue the rally because the Rsi was too fckin oversold & drown below 40 level.
tab like button if you guys like this analysis :)
follow me too for more market analysis updates :)

SAFEHAVEN YEN Aiming to Test the Lower Trendline Of the Channel Looking at the main chart it can be seen that the price is confined in a channel which is in a current uptrend! However a small pause is likely to occur before the long term price finds the right direction to trend again.
Looking at the above 4hr charts, there is a rough head and shoulders pattern that is present and a break of the neckline which also happens to be at the level of 4hr 50 EMA could signal a slight correction towards the ascending trendline of the channel. If a break does occur i will potentially wait for the price to breach both 4hr and daily 50 EMA before going short on this pair.
i shall provide any update for entry criteria shall the technical and fundamental picture meet. cheers
