GBPUSD great price action for short trade GAP on daily chart stopped bullish movement and accent it with very nice bearish candle. We can clearly see head and shoulders formation(black ticks). This pair is in bearish trend since brexit votes. Price action like this suggest continuation of bearish trend. Respected GAP head and shoulders big bearish candles and pair is trading below 200 ema. It seems like that 1.3000 was significant psychological level which stopped all the bullish movement.
Exponential Moving Average (EMA)

ETCBTC interesting formation and important level to observe I was on long holidays so that’s why there is a gap in my activity on the tradingview.
ETC like most of the crypto made strong push towards north. ETC is in consolidation for almost month. There are few important levels to watch. 0.0005300 which is close to the psychological level 0.000500 and it is highest high from the 1st of May. I marked with dotted lines range in which pair should stay for some time. I’m waiting potently for the pair to reach 200 Ema and form some kind of candle which will suggest rebound to reach 0.0001000 level which for me is very possible.
I wouldn't enter market right now as it is quite possible that the pair will form some kind of different pattern and it can go way lower after 0.0005000 will be pierced.
I will keep you updated.
If you will look at the Daily chart big caffeine candle from 24th of May is the sign which is suggesting further bullish move.

For curiosity, what do you think about EMA, SMA, etc?Nothing seems to move up or down (yet) in Bitcoin world, so in the mean time, would you kindly share with me what you think about EMA, SMA etc?
Are they rather old? Any use? If you are utilizing them, which MA, which parameter do you choose and why?
Personally I used EMA 10, 20, and 50 back when I traded Gold, but now my friends seems to ignore MA altogether, haha.

$CTRV Continues to trend upwards Amid Bio Conferences$CTRV announced today in addition to the 2017 Marcum MicroCap Conference 15-16 in New York, they will also be presenting at the San Diego Bio conference on June 19-22.
Let's think about this hypothetically. If there was no news to present or bad news they wouldn't have more than one conference, I mean one conference would be more than enough to tell everything in either of those two cases also who wants to put themselves through the embarrassment of a second conference if there wasn't something good down the line. Only time will tell but it is looking good in the right direction.
Also the techs are beyond bullish EMA / SMA crossover, PARSAR flip, resistance breaks support rebounds higher highs higher lows. All around very good.
pbs.twimg.com


My God ETHEREUM!!! 1st Published Idea-Woot Woot!!!ETH is really blowing through an ascending trend and blasting past the 9 period EMA and there's still room for growth on the Stochastic RSI. I'm definitely very Long on ETH... Expect a retracement maybe back to around $290-$300 during the week... Hope it hits $500 soon :-)

XEM-BTC analysisI fast analysis from NEM crypto-currency (XEMBTC) mainly based on Pitchfork trend, where Pitchfork is all about to respect the zones blue and green, and lines such as median line, bottom and top blue lines and their intersection between the blue and green region. So, bases on 4hrs time-frame it is possible to see that we have a interesting trend.
Until it is possible to notice, the market is about to test the region where is located the Exponential Moving Average (EMA) 50 periods. Then, in case this EMA 50 hold the the price, it is possible to make a entry in this asset; nevertheless, a short time-frame analysis in necessary to refine the entry.
However, it is still necessary (in my opinion) wait for a reversal signal based on MACD . Even though MACD and RSI do not show divergence, it is clear that at least MACD did not show a change in its signal line, which means that the price will keep falling/testing EMA 50.
Bollinger Bands show us the price bellow its base/median line, which means a possible continuation of bearish movement.
To interact with this chart, please click below in RELATED IDEAS
For analysis based on Ichimoku Cloud , please click on the reference link below RELATED IDEAS.

Looks Like a Good 5th Wave FormingPair: USD/JPY 4h
Trend: DOWN. Price is under Ichimoku Cloud, 21EMA is slopping downward, 100EMA crossed below 200EMA with price below them both. MACD and Stoch. concur.
Fibonacci: There is an overlap in Fib retracements at 110.083 indicating a strong resistance. Price hit this but did not develop a candle above it. But because the price touched 0.382, I would keep an eye out for a reversal.
E Wave: The 4th wave has fully formed so we want to ride the 5th wave (impulse). Because the 1st and 3rd are similar in length, the 5th wave will likely surge.
M Pivot: Today’s price could possibly range between 109.672 and 110.682 (right above entry).
Abandon Trade: I would consider abandoning trade is a candle forms above 110.083 resistance. A confirmation of reversal would be a break of 110.682.
Summary
Entry: 0.618 level or SHORT at 109.723
TP: 1.618 level or 108.151 (157 pips)
SL: 30 pips or 10 pips above 0.382 level or 110.180 (-45)
Risk/Reward: 3.46

AUDCHF SHORT term (Trendline breakout)EMA rejectionAUDCHF SHORT term (Trendline breakout)EMA rejection

AUDCAD Short term (Trendline &support breakout) EMA rejectionAUDCAD Short term (Trendline &support breakout) EMA rejection


Primecoin interesting levels to watchI marked on the chart two important GAP's on weekly chart which are playing important role during price movement. The blue one seems like is respected by the market since may of 2015. Every attempt to go below or above this level is met with strong resistance. The green is the one which I will be observing as this one should act as support for further gains. I would set TP just below very important psychological number which is 5000 combined with three solid gaps(marked with yellowish colour). If the blue GAP will be pierced with solid bullish candle and it will sustains gains above for some time it will be opinion very bullish signal.


PPCBTC important support/resistance level to observePeercoin made some nice move towards north lately. It seems like that peercoin lose some value against bitcoin after BTC made some new highest highs. I marked area very close to the psychological round number which is 0.00100000. Blue rectangle includes all the GAP based on weekly chart. I assume that if the pair will come closer to this level some interesting price action will take place. It is hard to say what will happen after. I think there are two possible outcomes. Market will respect this level and stop losses or pair will consolidate. When look at my previous idea about this pair you will see that last round number bring some nice gains and worked perfectly as the support area. Bold black line is in the place where pair found resistance in 2016 creating false double bottom signal.
I suspect that this is first wave of the bullish trend. If the price will be stopped by combined GAP's and eventually lows from 2016 it should go north and reach next important level which is 0.00220000,

AUDUSD RetracementAUD has strengthened over the last 40hours. However, Commodities are still down and the fundamental have not changed. AUDUSD is at a resistant level, a pivot point, the 75EMA, and has retraced tot he .786 level. I'm looking a move further down. I've put a smaller S/L at only 20pips since if it breaks above that level than I suspect it will strengthen more.

Golem vs Ethereum very solid support on Daily chartIt is very interesting chart. There is a very visible GAP on Daily chart which was respected by market recently. I would say this solid support should sustain the pair above this level and I would look for ABCD pattern where AB=CD. I'm not sure if correction will hit 50% again but even with this value we have good risk/reward ratio. I would set SL just below GAP and TP close to D point.
Support like this is rare and combination of 50% retracement with GAP making it very reliable also market seems to respect this level.

Bitcoin - Long-Term on Kraken's ViewShowing firstly a new trend provided by Pitchfork . Summarize little bit, Pitchfork is all about to respect these zones (blue, green) and lines (median line, intersection between blue and green, and the extremity). So, if the market respect the trend given by this tool, this Pitchfork will be a great way to be followed. Notice that the price touches specially the median line (red), which is a line where the price continually attempt to return to this diagonal and test this region. Looking previously it is possible to see that with this configuration the median line is touched several times, which make this Pitchfork very reliable for the present moment.
Bollinger Bands shows price within optimistic region. Moreover, it is showing a Bollinger Band strategy called Riding On The Band where basically this strategy will keep working until the next candle close completely inside of the band. When it happens this strategy will no longer be validated.
Based on the trend made by the pointed yellow line it is possible to trace a Trend-Based Fibonacci Extension . So that, it is possible to estimate a target for those whom are already on a long-entry in this asset. A preliminary estimated target is the region where there is a Pivot , which indicate a possible resistance zone.
Exponential Moving Average of 50 and 200 periods show super bullish trend and the markers R.S.I. and M.A.C.D. are not showing any signal of divergence until the present moment. However, it is possible to notice from R.S.I. that the price is in an overbought region, which is a clear indicative that the buying pressure is about to decrease and a correction is about to come. Nevertheless, M.A.C.D. still showing that there is more space for higher prices, and what show this is the fact that fast length (blue line) is a little bit spaced from slow length (orange line).
To interact with the chart above, please click below on RELATED IDEAS.
Looking-up it is visible that Ichimoku Cloud still showing that Bitcoin is in a bullish momentum, and as described above the Pivot R3 and R4, which represente support and resistance respectively, match pretty much with Trend-Based Fibonacci Extension that is given by the pointed yellow line.

Clam gap respected and potential for further gainsThere are 4 GAP's marked on the chart. These are based on the weekly candle chart. There one on the bottom has been respected by the market for quite some time(orange ticks). Double bottom is market with black ticks. It is around level 0.00055.
Gains from last week were stopped at round number which was 0.0050000.
I'm looking forward to see what kind of price action we will see when pair will reach another GAP.

BCNBTC Bytecoin chance to catch bullish movementFor the last few days Bytecoin is trading between 30 and 40. It is quite possible that the pair will move higher and 200 ema should help here. This range trade can take a while. Interesting is that every time BTC is making new highs this pair is holding strong position above 30 which suggest strong buying power.

CADUSD 4HIn short term price of CAD will move down however, in long term will re-bounce to touch EMA.

Lets watch the power of the EMA-20 vs XBTLooking at the EMA-20 and the number of days above it are reaching 1 month (31 days). That cant hold anymore.

Break of rising wedge on 15m and 1hr EURUSD SHORTPotential short opportunity here. The candles have broken through the rising wedge pattern, waiting for price to cross below the major resistance (dotted line) and the 13 EMA (purple line). If price breaks these two lines then would expect price to retrace around the 200 EMA (red line).

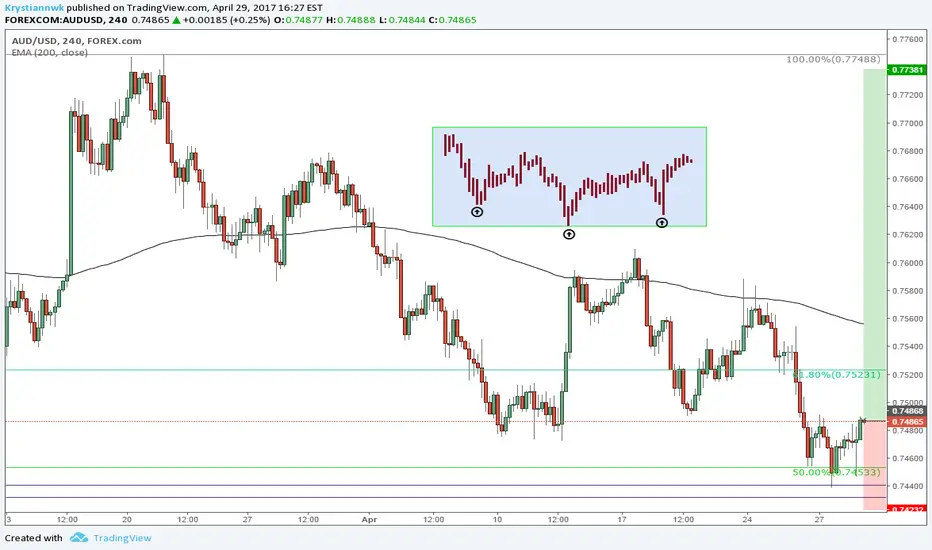
Aussie strong signals suggesting bullish movement Fibonacci retracement 50% is a very good place to enter the market with low risk and high reward possibility (see link) . I found many interesting patterns on this chart.
Blue rectangle is showing head and shoulders formation on 1H chart.
Engulfing candle on 4H chart
There is Doji candle suggesting strong buying power at the 50% level
There is also GAP from Daily chart down below 50% marked with two blueish parallel lines.
All these patterns mentioned above are strong indicator that the pair will move towards TP area.