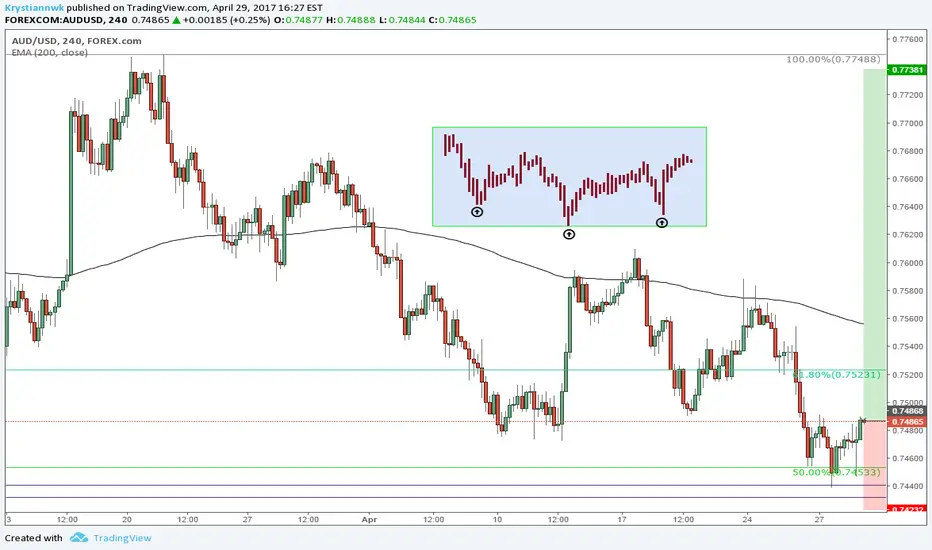
Aussie strong signals suggesting bullish movement Fibonacci retracement 50% is a very good place to enter the market with low risk and high reward possibility (see link) . I found many interesting patterns on this chart.
Blue rectangle is showing head and shoulders formation on 1H chart.
Engulfing candle on 4H chart
There is Doji candle suggesting strong buying power at the 50% level
There is also GAP from Daily chart down below 50% marked with two blueish parallel lines.
All these patterns mentioned above are strong indicator that the pair will move towards TP area.
Exponential Moving Average (EMA)
LBCBTC update chance for Re-enter once againBig bullish candle marked on chart created very strong support which is nicely respected by market. In my opinion pair is going towards psychological round number which in this case is 10k.
It is very common that big bullish or bearish candles are creating support/resistance level at :
1. top of body
2. bottom of body
3. 50% of retracement from top to bottom of the body.
I think market created very good opportunity to re-enter with relative low risk.

OMNIBTC chart packed with all sorts of patterns and formations There are many interesting formations on this chart. First of all is double bottom where pair reached 0.00100000 in March this year and October 2015. It is clearly visible on weekly chart. We have upside down head and shoulders formation created from doji candles (it’s look better on hourly chart) . Rounded bottom (marked with blue curved line) . Pair is trading above 200 Ema which is bullish sign. This pair also established support level around 0.0020000 which is marked with bold black line.
I marked with black parallel lines most of the GAP above the 0.0020000 area so you can see how market is reacting to them (GAP’s are treated as the solid support to push higher which is suggesting strong bullish potential) .
This pair with all the mentioned formation looks very bullish to me and I’m pretty sure that this pair will reach 0.0150000 or maybe 0.020000 in future.

Nautiluscoin Re-ent with nice Cup and handle formation It is update for the previous idea regards this pair. I was expecting that the pair will do strong move up so that's why I set tight SL. Pair is trading below solid support/resistance area. I would re-enter at the market with new SL an TP. Cup and candle formation is used to determine the best place to set SL. This pair is very bullish in my opinion. It would be perfect to enter the market if the pair will trade above the GAP but you will have lower risk/reward ratio.

Aussie Update I was checking this pair after I opened long position. Monday opening was interesting(GAP). I'm aware that correlation with EURUSD had big role here. Honestly I was expecting that the pair will go down to test GAP and will go straight to reach my TP. Between 7530 and 7555 there are combined two GAPS as well which should hold losses plus 7500 as the strong psychological number.
Based on the price action from the last week I'm much more in favour of short position with TP around 7173. This pair broke series of strong support/resistance areas with ease.

A LONG opportunity for Wave E completion, then to a Big SHORT !It seems that as some other players in the Lodgement / Hospitality industry, ACCOR is not immune to market sentiment and investor scrutiny... where currently a LONG position with a reasonable entry is a good trade, but only until what seems to be a completion of a triangle wave E, where if my analysis is correct, there should be a massive SHORT opportunity to trade an Impulse a significant way down.
EMAs all show the start of the Upward bullish trend together with TDI suggesting we have already had the Shark fin with blood in the water at Wave D point, which confirms the upward trend.
Hopefully market sentiment will not punish ACCOR too much for lagging behind market expectations and performance. It seems some upper management 'proverbials' need kicking, very hard and very soon, in order for better performance to progress faster, in order to avoid a negative market sentiment which would be expressed in an Impulse wave downward, wiping off significant value from this stock.
----------------------------------------------------------------------------------------------------------------------------------------------------------
DISCLAIMER: This chart is for sharing and educational purposes only and is not intended to be a signal service or similar.
This chart analysis is only provided as my own opinion, based on my own analysis and comes with absolutely no warranty that this analysis is correct, whatsoever. Do not trade this chart if you do not have your own strategy. Trade only with your own strategy at your own risk.
Plan your trade and trade your plan... and IF in doubt, stay out.
.....::::: If you like this chart, please click on the THUMBS UP ! :::::.....
----------------------------------------------------------------------------------------------------------------------------------------------------------

High Probability LONG until top trendline, before massive SHORTBased on the current Daily chart/pattern, there is a possibility to enter a LONG until the top of the channel trendline, before a substantial SHORT to the bottom of the triangle's channel trendline.
IF the bottom trendline is broken, after consolidation and crossing the Blueberry EMA, we should be able to have confirmation of a significant Impulse wave downwards for a full bearish trend, which could confirm hard times ahead for the IHG (Intercontinental Hotels Group).
TDI seems to suggest a LONG is still valid until the overbought position is reached which should then signal a great SHORT entry at least to the bottom of the channel trendline/Blueberry EMA.
Once we reach the Blueberry EMA, price action and structure should provide more information before a decision to exit the trade or continue SHORT for an Impulse.
----------------------------------------------------------------------------------------------------------------------------------------------------------
DISCLAIMER: This chart is for sharing and educational purposes only and is not intended to be a signal service or similar.
This chart analysis is only provided as my own opinion, based on my own analysis and comes with absolutely no warranty that this analysis is correct, whatsoever. Do not trade this chart if you do not have your own strategy. Trade only with your own strategy at your own risk.
Plan your trade and trade your plan... and IF in doubt, stay out.
.....::::: If you like this chart, please click on the THUMBS UP ! :::::.....
----------------------------------------------------------------------------------------------------------------------------------------------------------

BTC update This is update to my previous Idea regards BTC. Based on this chart I assume that 1000$ mark was defended and strong bullish trend should continue for some more time. BTC is making new highest highs while I'm posting this Idea(well at least on this chart). I strongly believe that the BTC will hit 1700 1800$ mark some time in the future. I also believe that 3000$ is very probable as well but I'm not sure when it will happen. I marked strong support/resistance close to 1300$(blue rectangle). This area should be tested and then BTC should move north. Recent informations regarding BTC future didn't change strong bullish trend that much.
Please don't take it as a trading advice it is just my thought.

AUDNZD Pending Sell OptionAUDNZD long term - we have a clear bearish trend.
Short-term correction phase near FIBO 50%
We might have a stall phase. placing an order to sell the break of fibo level.
Technical indicator RSI+MA turning around OB zone, Once RSI will pickup a bearish momentum which will confirm the projected movement for a new short position.
TG and SL on the chart!

Factom: chance to enter the bullish trendPair recently tested psychological round number which is 5k. I marked with three orange ticks something similar to triple bottom. I believe that after third attempt has been rejected by market there is good chance that pair will continue bullish trend and will try to reach another significant level which is 0.007400.

USDJPY part 2 - tunnel is still activeUSD moved down as I have predicted in my previous plot - see below.
Now is time to move up and touch EMA (2h plot) - this week and beginning of next one
After that we will see more downward move - since next week.
Tunnel is still active however, slightly changed as wasn't accurately drawn first time.
My previous plot on USDJPY:

Nautiluscoin tight SL with nice Risk/Reward ratioThere was strong movement at the end of January. Fibonacci retracement was reached at 14.60% which is actually important level. Pair created triple bottom and then moved up again.
GAP created on October 2016 stopped all gains twice (purple ticks) which is telling us that market recognized this level as the strong support/resistance area. Recently pair managed to go thru this GAP and market is testing this area once more. I marked with two parallel black lines recent GAP. There is something similar to double bottom (orange ticks) near this area.
I would open long position with tight SL.
SL is set just below recent GAP.
Next level which I consider as the resistance would be around 0.0002600 and I would put TP just slightly below 161.8%.

Counterparty / Bitcoin trading close to major supportTriple bottom marked (three orange ticks) combined with GAPS (black parallel lines) above psychological level created very solid support. In my opinion it is good idea to wait for the pair to go close to the 0.0020000. I would look for 0.0062000 area as the good TP but there is a chance that 0.0050000 will most likely bring some interesting price action.
I would wait for some kind of confirmation that price will go north (hammer, engulfing candle, etc.)

RADSBTC range price action09th of March pair finally moved north after third rejection of strong support (three orange ticks) . Support is based on the Gap from beginning of June 2016. Pair is moving in range between 0.001500 and 0.0090000. I marked with two black parallel lines GAP which should hold further losses. This place is also very good entry point with SL set just below 0.008500 and TP at 0.00190000. I would risk and wait for 0.0025000 area to be hit. It is highest high from 22nd of March 2016.

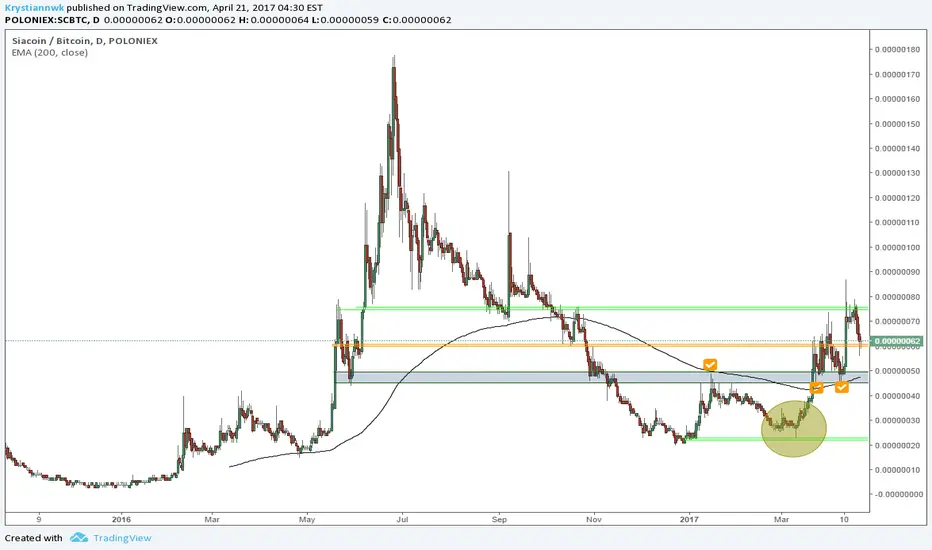
SiaCoin interesting price action23 we can see nice GAP combined with nice doji candle holds losses and pushed pair higher. Major support/resistance area with psychological number 50 (range between 50 and 44) was respected by market for a very long time. It was eventually broken by pair and tested twice during last three weeks with negative results (good bullish signal) . 12th of April pair moved up very quickly and it was stopped by another GAP.
This pair is respecting Gap’s and market is treating these as support/resistance areas. There is another GAP marked with orange rectangle (60) which should hold losses, the pair should go higher and try to break 70.
I would set SL just below 44
TP levels:
1. 0.00000098 which is pretty reasonable
2. 0.000000123 which is probable but more risky
3. 0.000000166 It is possible
Decred above solid support chance to go higher This Idea is related to the previous one which is linked.
Pair managed to go above psychological level and established nice support there ( doji candle marked with orange tick). I placed on the chart trend line (red) and brown where pair will find strong resistance. In My opinion next level is 0.01776000 and then probably 0.020000.
200 Ema should help ascend. There is still a small chance that the pair will go beyond the psychological level 10k just to go back on track.

Aussie long position opportunity detailed information 4HThis is zoomed idea which revealed three soldiers formation triple bottom and 7500 level which stopped all attempts to go lower.
Losses were stopped by strong support mentioned in previous Idea, at 7500 which also created irregular head and shoulders pattern or triple bottom. This configuration of signals combined with three soldiers pattern on 4H chart makes it quite nice opportunity to enter the market. I marked double bottom from May last year and January this year. What we can see here that when the pair reached 7200 area it moved north very quickly. This price action is suggesting that the bulls have very strong buying power.
I would open position at current price with nice 3.5 Risk/Reward ratio.
I think it is worth the risk.

Aussie long position opportunity big pictureLosses were stopped by strong support mentioned in previous Idea, at 7500 which also created irregular head and shoulders pattern or triple bottom. This configuration of signals combined with three soldiers pattern on 4H chart makes it quite nice opportunity to enter the market. I marked double bottom from May last year and January this year. What we can see here that when the pair reached 7200 area it moved north very quickly. This price action is suggesting that the bulls have very strong buying power.
I would open position at current price with nice 3.5 Risk/Reward ratio.
I will post another idea with detailed information.

LTC good chance to beat higher high from 5th of AprilIt is quick review of recent LTC price movement. It seems to me that LTC created very nice not perfect but still upside-down head and shoulders formation on 4H chart. What is important here this formation is combined with significant round number which is 10$. I marked with orange tick big bullish candle which is good signal for further gains. When big bullish candle like this appear on the chart its lower part of body is treated as support which is here somewhere around 9.90$. Price could go below it for short period of time but there is good chance that 200 ema will push it back on track and price will reach new highest high. If the price will go lower I would wait for hammer with long shadow.

Ripple interesting price action 4H chart Bitcoin is on the rise when I'm posting this idea. Orange ticks marked double bottom formation which is holding pair above this level. As you can see important Fibonacci level 38.2% (combined with round number 3K) was rejected 13th of April. Pair is in consolidation for few weeks. Market is respecting support at 2600 which could be use as the Stop Loss area. It is seems to me that pair is trying to leave triangle which is suggesting bullish movement. Theses days shorts on any crypto are not really good idea in my opinion. There is more chance that pair will go north or consolidate then will go down. The 38.20% area is important here and if broken it will increase chance that pair will hit 61.80%.
I see three possible outcomes here :
(I'm think that first two are much more possible than the last one)
1.Pair will break 2600 and go down to meet 200 ema and or 2000 level just to bounce back
2.Pair will never touch the support again and will go north towards 61.80% level
3.Pair will go down break the support 200 ema 2000 level and will try to reach 1k.

Bear Trendbeen shorting since 122 levels short again @117.833 predicting breakout on 4h . SL@118.195 tp@116.146

CADCHF Inverse H&SPotential Inverse Head And Shoulder on the 1D and 4H timeframe, waiting for more of a confirmation of the H&S to continue playing out before taking a position to attack previous high of 0.77245, BANK HOLIDAY Monday so no positions will be taken.

BCNBTC I see here potential for big returnsWhen I'm looking on chart I see big potential for big movement some time in future. Pair established solid support between 4 and 6. I would like to see round number like 5 but it is not case here. This support area holds losses for almost 6 months. I don't see any candle formation or any other known to me pattern which I could apply here.
I see here potential to double triple or quadruple of stake.
Risk is that pair could go down to 1 that's why I wouldn't put stop loss because I strongly believe that there are pending orders just below 6 which will give boost to rise again.
Look at the huge doji candle from 31st of may. This pair has potential to rise up for fourth time in my opinion.
If you would like to take my advise and trade it I would suggest to invest only stake you are comfortable with and don't expect returns in short time. Just invest and wait till it will reach your desired level. I put in chart some levels I believe pair will hit in future. Pair is testing round number 10 for time being.
1. Green I'm pretty sure (this one is based on highest high from 2015)
2. Orange It is probable ( round number )
3. Yellow there is a small chance based on Fibonacci projections
4. Blue maybe based on Fibonacci projections
5. 361.80% who knows
