BNBUSDT — Golden cross with a target at 804- 850BNB has broken the descending trendline and formed a clear reversal structure.
A golden cross (EMA 50 crossing EMA 200 from below) confirms bullish intentions. The price is now holding above 783 -a key level that aligns with the 0.618 Fibonacci retracement. A retest of the 778–768 area is expected, followed by a potential rally to 808–810.
If momentum continues, the 860 zone (Fib 3.618) becomes the next target. The uptrend remains intact. RSI supports the move, MACD is in positive territory, and volume remains stable.
On the fundamental side, BNB remains a central token in the Binance ecosystem. With no regulatory pressure in the short term and ongoing development of the platform, institutional and retail interest remains strong. General optimism across the altcoin space also provides momentum.
Holding the 768–778 area is key for further growth. A drop below could test 760 support, but the bullish structure remains valid.
Emacrossover

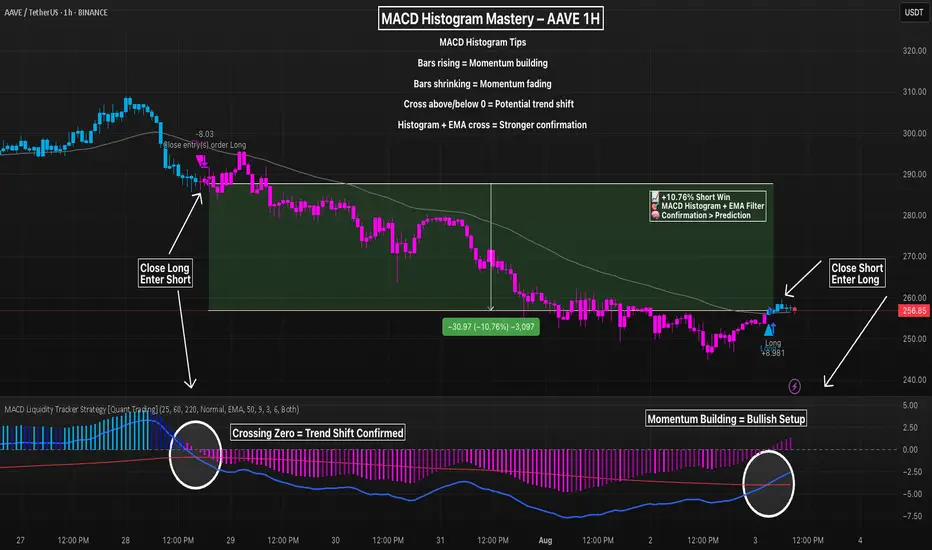
Master MACD Histogram + EMA Filter To Filter Out NoiseThe MACD histogram isn’t just noise — it’s a leading signal for momentum shifts when interpreted correctly. On this AAVE 1H chart, a textbook transition plays out:
– Rising histogram fades → crosses below 0
– EMA filter confirms trend shift
– Strategy flips short at the peak, locks in a +10.76% move
The recent long trigger occurs only after the histogram begins rising, crosses above zero, and price breaks back above the 50/9/3 EMA filter.
💡 Histogram Tips:
– Rising bars = bullish momentum building
– Shrinking bars = momentum weakening
– Crossing the zero line = potential trend reversal
– Best results come when histogram + EMAs align
⚙️ Settings Used:
MACD: 25 / 60 / 220
EMA Filter: 50 / 9 / 3
Entry Mode: Both (Histogram + Crossover Confluence)
📈 Use histogram transitions as an early signal — but always confirm with trend filters to avoid fakeouts.
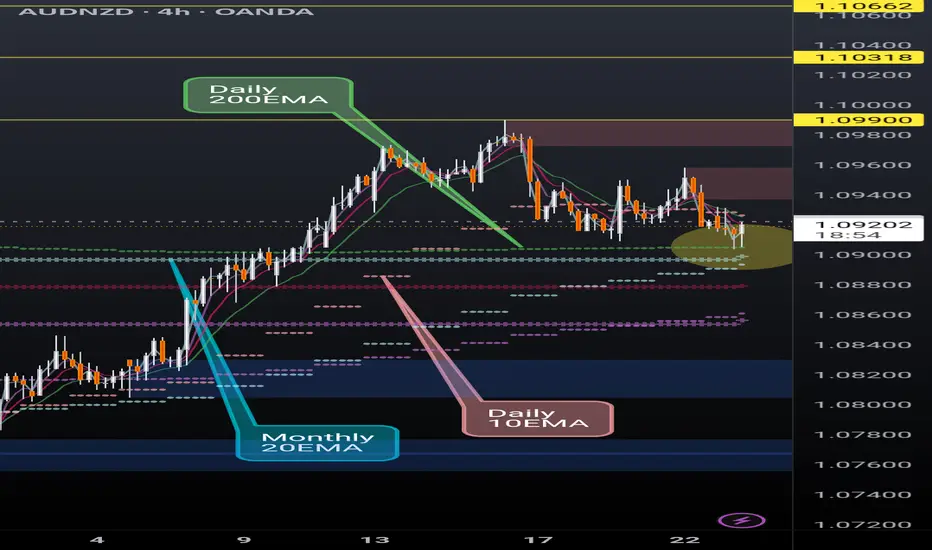
AUDNZD finding support on critical EMAsAUDNZD is finding support at the daily 200EMA (overlayed on 4H chart) and, more significantly, above the monthly 20EMA (overlayed). Break and hold the daily 10EMA (overlayed) will be key.
If the momentum continues we could see a continuation of the ongoing rally however recent AUD monetary policy meeting minutes seemed to lean dovish.
I'm a cat not a financial advisor.
CADJPY daily 20EMA bounceSimple idea here, CADJPY is testing the daily 20EMA (overlayed on this 4H chart) and recently broke above the monthly 20EMA (overlayed)... if price reclaims the daily 10EMA (overlayer) could be a nice move up.
Very simple trade, tight SL if entering.

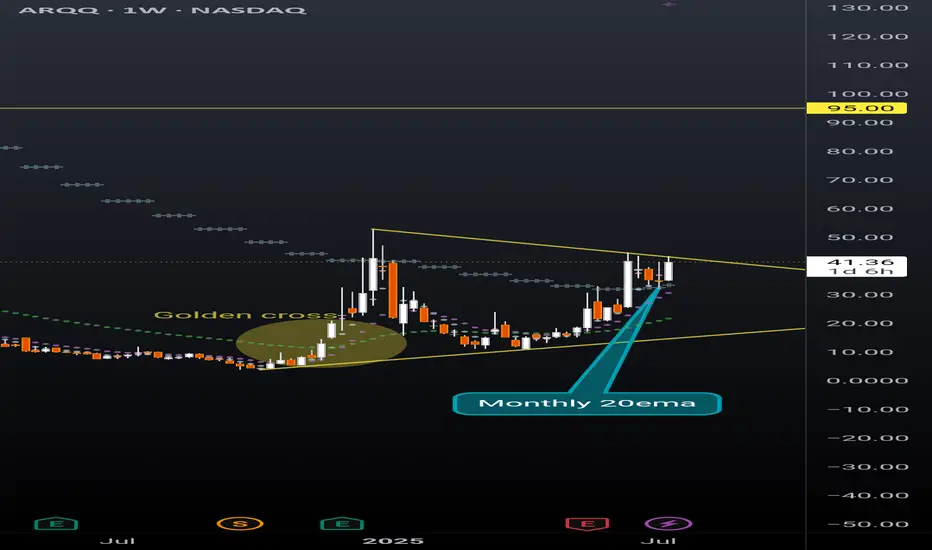
ARQQ weekly pennantBeautiful weekly pennant on ARQQ weekly timeframe. This chart is coiling nicely for a continuation. Still early in the process of reaching breakout but given the recent momentum in this sector a premature break to the upside can happen at any moment.
The ticker is currently sitting above the monthly 20ema (overlayed on this weekly chart), and just had a strong bounce off the daily 20ema (overlayed on this weekly chart). Golden cross is also highlighted that occurred in December 2024 with the daily 50ema retracing back to the daily 200ema and then continuing the uptrend earlier this spring.
CSBBANK at Best Support !!This is the Daily Chart of CSBBANK.
CSBBANK is currently showing momentum while taking support from the EMA and SMA at 380 and 368 range.
If this level is sustain , then We may see higher prices in CSBBANK
Thank You !!

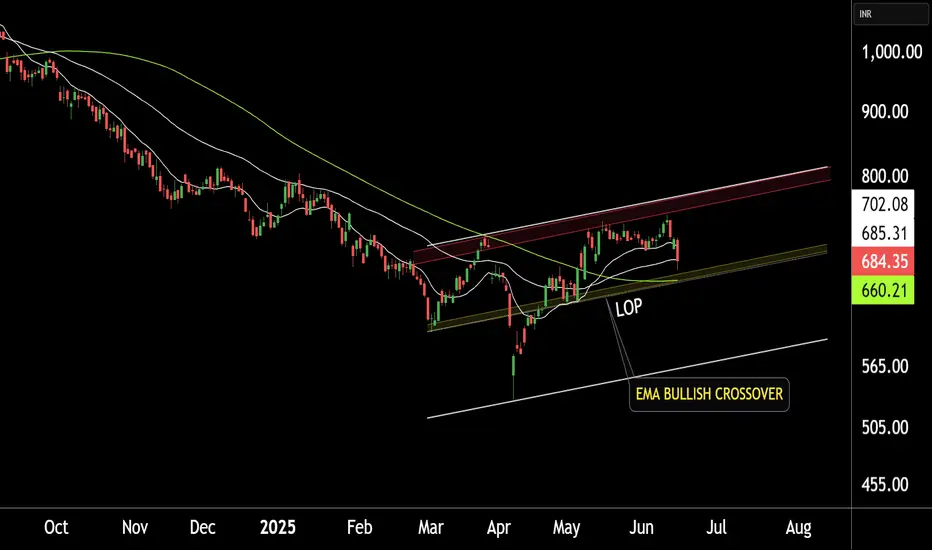
TATA MOTORS LTD at BEST SUPPORT !!This is the Daily chart of TATA MOTORS LTD.
TATA MOTORS having good law of polarity at 660 range.
TATAMOTORS has given a positive EMA crossover, with its support range lying around 660-680.
If this level is sustain , then We may see higher price in TATAMOTORS.
Thank you !!
BERGEPAINT at Best Support !!This is the Daily Chart of BERGEPAINT .
BERGEPAINT having good law of polarity at 540-545 range.
EMA is also providing support for the stock around the 545 range.
If this level is sustain the , We may see higher price in BERGEPAINT.
Thank You !!

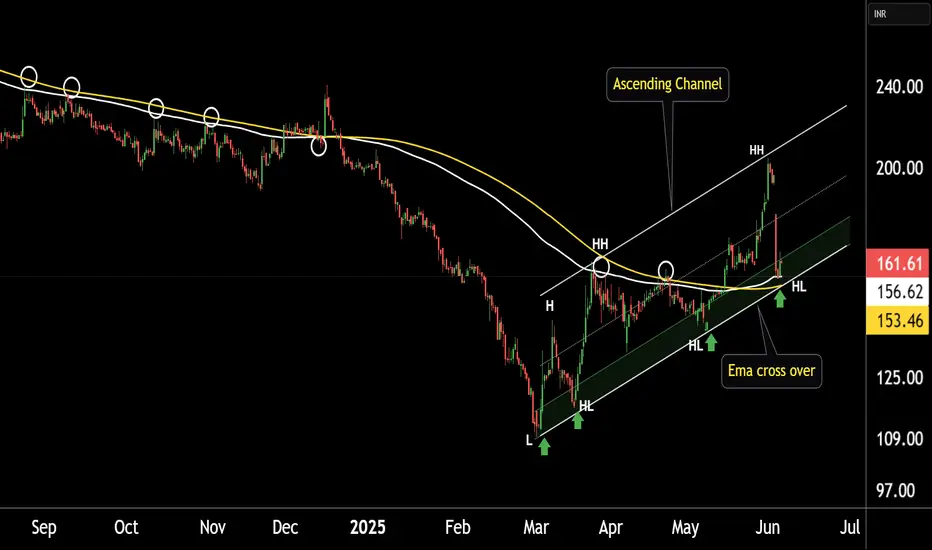
SPARC This is the 4 hour chart of SPARC.
SPARC is currently trading near the support boundary of an ascending channel at 150-155 range.
SPARC has given a positive EMA crossover at price 152-156 range
If this level sustain, we may see higher price in the SPARC.
Thank You !!
XAU/USD Bounces Off Strong Support Zone – Bullish MomentumGold (XAU/USD) has shown a strong bounce from the clearly defined support zone around the 3280–3290 level on the 1-hour timeframe. This zone has held multiple times in the past, confirming its significance. Additionally, the 200 EMA (red) is aligned with this horizontal support, creating a strong confluence area. Price action has respected this level, forming a bullish reversal candle setup, indicating potential for upside movement.
Based on this structure, a long (buy) trade can be considered around the 3300–3305 range, ideally after a bullish confirmation candle or price holding above the EMAs. This entry provides an opportunity to ride the next wave upward while maintaining a favorable risk-to-reward ratio.
The stop loss for this trade should be placed just below the support zone—around 3275 USD. Placing the stop slightly below this area protects against fakeouts while still maintaining good risk control. This is a logical level where the setup would be invalidated if breached.
For targets, the first potential resistance and partial profit booking zone is near 3335–3340 USD. This zone acted as resistance during previous price swings. If momentum sustains, the second target zone is around 3360–3370 USD, which marks a previous swing high and a likely destination for bullish continuation. For extended upside potential, traders can aim for 3385+ USD, especially if the price action is supported by volume and broader market sentiment.
This setup offers a clean technical play with a risk-reward ratio of approximately 1:2.5 or higher. Traders can also trail their stop-loss once the price crosses above the first target to protect gains while riding further upside.
=================================================================
Disclosure: I am part of Trade Nation's Influencer program and receive a monthly fee for using their TradingView charts in my analysis.

Is There the Best Moving Average For Swing Trading?Is There the Best Moving Average For Swing Trading?
In swing trading, moving averages are widely used to analyse market trends and identify potential turning points. In this article, we’ll dive into the most commonly used MAs, their unique characteristics, and how they can be applied in swing trading strategies.
What Are Moving Averages?
You definitely know what moving averages are. However, we need to start our article with a brief introduction to this market analysis tool.
A moving average (MA) is a fundamental tool in technical analysis that helps traders understand the direction of a market trend by smoothing out price fluctuations, often touted among the best indicators for swing trading. Instead of focusing on the volatile ups and downs, MAs calculate an average of prices over a specific period, such as 20, 50, or 200 periods. This gives traders a clearer picture of the overall trend by filtering out short-term volatility.
There are different types of moving averages, but they all work on the same principle: tracking the average price over time to highlight the market's trajectory. For example, a 20-period MA shows the average (usually closing price but a trader can choose highs, lows, and opens) over the past 20 periods, updating as new prices come in. This rolling calculation creates a line on the chart, making it easy to identify whether the market is trending upwards, downwards, or moving sideways.
Types of Moving Averages
Moving averages come in various forms, each with unique characteristics that cater to different trading styles and strategies.
Simple Moving Average (SMA)
The simple moving average (SMA) is the most straightforward type, calculated by averaging the closing prices (but a trader can choose any price type) over a set number of periods. For example, a 20-period SMA adds up the last 20 closing prices and divides by 20. It’s popular among traders who want a broader view of price trends without overreacting to short-term fluctuations, making it a contender for one of the best moving averages for swing trading. However, SMAs can lag behind price action, as they give equal weight to all prices in the calculation.
Hull Moving Average (HMA)
The hull moving average (HMA) is designed to reduce lag while maintaining a smooth line. By combining weighted averages with additional smoothing techniques, the HMA offers a balance of speed and clarity, making it an underrated moving average for swing trading.
Exponential Moving Average (EMA)
The exponential moving average (EMA) prioritises recent prices, giving them more weight in the calculation. This makes it more responsive to price changes compared to the SMA. Swing traders often use EMAs in faster-moving markets, where quick adjustments to trend shifts are crucial, with 8- and 21-period EMAs considered by some traders as two of the best EMAs for swing trading. For instance, a 20-period EMA reacts faster to sudden price movements than a 20-period SMA, helping traders spot potential reversals sooner.
Weighted Moving Average (WMA)
Similar to the EMA, the weighted moving average (WMA) also gives more importance to recent prices but does so with a linear weighting system. This means the most recent price has the greatest impact, gradually decreasing with older data. WMAs are less common but useful when traders want a more precise reflection of recent price action.
How to Use Moving Averages in Swing Analysis and Trading
Moving averages are versatile tools that can provide valuable insights for swing traders. Beyond highlighting trends, they can help identify potential turning points and dynamic support or resistance levels. Here’s how they’re commonly used in swing trading:
1. Identifying Trends
MAs are widely used to assess the direction of a trend. For instance, if the price consistently stays above a rising moving average, it suggests an upward trend. Conversely, when prices remain below a declining moving average, the market could be trending downward. Swing traders often rely on shorter moving averages, like the 20-period, for identifying trends that align with their trading horizon.
2. Spotting Reversals with Crossovers
Crossovers happen when two MAs intersect. A common example is a shorter MA crossing above a longer one, which may indicate a shift towards bullish momentum and vice versa.
3. Dynamic Support and Resistance
MAs act as floating support and resistance levels. MAs serve as a support level in an uptrend, with the price bouncing off it repeatedly. In a downtrend, the same moving average might act as resistance, limiting upward moves.
4. Filtering Market Noise
In choppy markets, MAs can smooth out minor fluctuations, making it easier to focus on the bigger picture. Swing traders often use longer MAs, such as the 50-day or 200-day, to filter out irrelevant short-term movements.
5. Timing Entry and Exit Zones
Many traders use crossovers to time their entries and exits, though it’s worth noting their lagging nature means they can result in untimely trades. They can also provide context. For example, if the price approaches a key moving average after a strong move, it might indicate a consolidation phase or a potential reversal, allowing traders to adapt their analysis.
Common Moving Averages for Swing Trading: The 20, 50, and 200 MAs
Swing traders often turn to the 20-, 50-, and 200-period moving averages as their go-to tools for analysing market trends. Each serves a specific purpose, helping traders gauge short-, medium-, and long-term price movements. These moving averages are often used together.
20-Period Moving Average
The 20-period MA is a favourite for short-term trend analysis. It reacts quickly to price changes; therefore, traders use it to identify recent momentum or potential trend shifts. Traders frequently watch for price “bounces” off the 20-period MA as potential indications of continuation in the current trend.
50-Period Moving Average
The 50-period MA provides a medium-term perspective, offering a smoother look at price trends. It’s slower to react than the 20-period MA but avoids being overly lagging. This balance makes it useful for identifying sustained trends while filtering out minor price noise. When prices interact with the 50-period MA, it often acts as a dynamic support or resistance level.
200-Period Moving Average
The 200-period MA is the benchmark for long-term trend analysis. It’s often used to determine the overall market direction. This MA is also a widely followed indicator for institutional traders, adding weight to its significance. Interactions with the 200-period MA often mark key turning points or areas of consolidation.
Traders also monitor crossovers between the 50- and 200-period MAs, recognised by some as the best moving average crossover for swing trading. For instance:
- Golden Cross: When the 50-period MA crosses above the 200-period MA, it suggests potential bullish momentum.
- Death Cross: When the 50-period MA drops below the 200-period MA, it signals a possible bearish shift.
Using Them Together
Using the 20-, 50-, and 200-period MAs together offers a comprehensive approach to identifying the best moving average crossover setups, allowing traders to see the bigger picture while still tracking short-term shifts. For instance, when the price breaks above the 200-period MA while the 20-period MA crosses above the 50-period MA, it may signal the beginning of a broader bullish trend. Meanwhile, a price drop below all three MAs could suggest broader bearish momentum.
Other Moving Average Combinations for Swing Trading
While the 20, 50, and 200-period MAs are staples in swing trading, exploring other combinations can offer nuanced insights tailored to specific trading strategies. Some alternative moving average setups that traders often employ include:
8-Period and 21-Period Exponential Moving Averages (EMAs)
This pairing is favoured by traders seeking to capture short-term price movements with greater sensitivity. They call this the best EMA crossover strategy. The 8-period EMA responds swiftly to recent price changes, while the 21-period EMA provides a slightly broader perspective.
10-Period and 50-Period Simple Moving Averages (SMAs)
Combining the 10- and 50-period SMAs offers a balance between short-term agility and medium-term trend identification. This combination helps traders filter out minor price fluctuations and focus on more sustained movements.
28-Period and 50-Period HMAs
For traders focused on short-to-medium-term trends, the 28- and 50-period HMAs offer a balanced approach. The 28-period HMA reacts quickly to price changes, while the 50-period HMA provides a steadier view of the broader trend. Crossovers between the two can signal potential bullish or bearish momentum shifts, benefiting from the HMA’s reduced lag.
13-Period and 34-Period WMAs
Rooted in Fibonacci sequences, the 13- and 34-period WMAs are employed by traders who believe in the natural rhythm of the markets. A 55-period WMA can also be included for a longer-term perspective. Crossovers between these WMAs can highlight potential trend reversals or continuations, with the WMA adapting more quickly than other MAs due to its weighted calculation.
Implementing These Combinations
When applying these moving average combinations, it's crucial to consider the following:
- Market Conditions: These combinations often perform better in trending markets versus ranging markets. Moreover, shorter MAs might be more effective in capturing quick price movements during high volatility.
- Timeframes: Traders align MAs with their trading horizon. Shorter periods like the 5-period or 8-period MAs are usually used by traders focusing on brief swings, while longer periods like the 50-period MA cater to those looking at extended trends.
- Confirmation with Other Indicators: Relying solely on moving averages can lead to false signals. Traders corroborate these signals with other technical indicators, such as Bollinger Bands or the Relative Strength Index (RSI).
What Moving Averages Should You Use for Swing Trading?
There is no best moving average for swing trading. The choice of MAs ultimately depends on a trader's strategy and preferences. The combinations discussed provide a framework, but experimenting with different setups can help identify what aligns with individual trading styles and objectives.
The Bottom Line
Moving averages are powerful tools for swing trading, offering insights into trends and potential market turning points. Whatever your unique preference for different types and lengths, understanding their application can refine your strategy.
FAQ
Which Moving Average Is Good for Swing Trading?
The 20-period, 50-period, and 200-period moving averages are widely used in swing trading. However, different combinations, like the 8- and 21-period or 13- and 34-period MAs can offer equally valuable insights; it ultimately comes down to the trader’s preference.
What Is the Most Popular Moving Average to Use?
The most popular moving average depends on a trader’s trading style and goals. Shorter MAs, like the 20-day MA, are popular for quick trend identification, while longer ones, such as the 200-day MA, provide a bigger picture. Many traders combine MAs to cover different timeframes.
Is 200 EMA Good for Swing Trading?
The 200-period EMA is useful for swing traders seeking to understand long-term trends. It reacts faster than the 200-period SMA, making it suitable for traders looking to incorporate a responsive indicator in their analysis.
Which Indicator Is Most Popular for Swing Trading?
There isn’t a single best indicator for swing trading. Moving averages, RSI, MACD, and volume indicators are commonly used. Combining these can provide a more comprehensive analysis.
Which Volume Indicator Is Popular for Swing Trading?
The On-Balance Volume (OBV) and Volume Weighted Average Price (VWAP) are popular volume indicators for swing traders, helping assess market momentum.
Which RSI Indicator Is Popular for Swing Trading?
The standard 14-period RSI is widely used. Swing traders often adjust it to shorter periods (e.g., 7) for faster signals or longer periods (e.g., 21) for smoother trends.
This article represents the opinion of the Companies operating under the FXOpen brand only. It is not to be construed as an offer, solicitation, or recommendation with respect to products and services provided by the Companies operating under the FXOpen brand, nor is it to be considered financial advice.

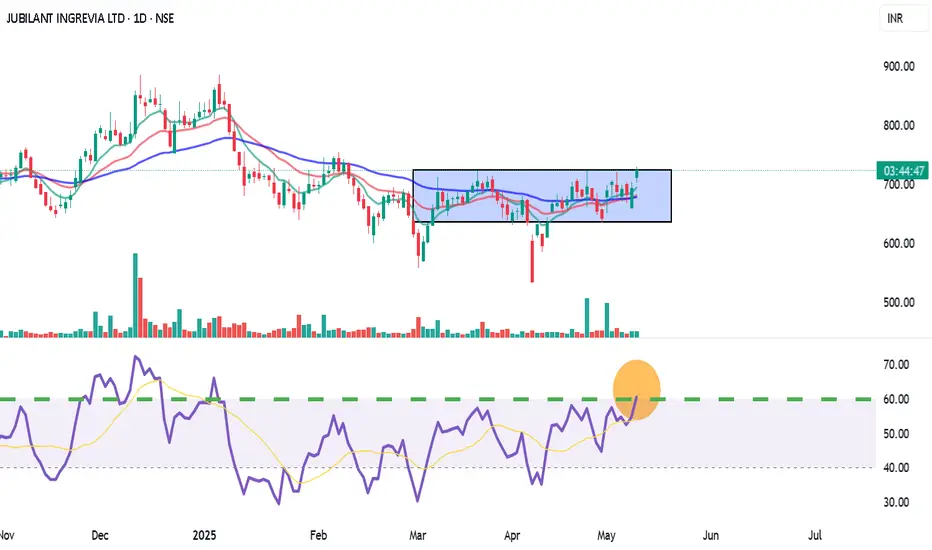
Jubilant Ingrevia (JUBLINGREA) – Short-Term Breakout Trade LTP: ₹726.30 | Recommended Entry: ₹722.00 – ₹723.00
Type: Short-Term Swing / Intraday MTF Trade
✅ Trade Setup:
Breakout above horizontal resistance near ₹725.75
9 EMA has crossed 26 EMA (bullish momentum)
RSI at 60.84 – strong trend, room for upside
BB %B: 0.96 – price pushing upper band = momentum buying
Good volume breakout on daily TF confirms buying interest
🟢 Buy Zone: ₹722 – ₹723
🔁 On retest or 15-min candle close above ₹725.75 with volume
🎯 Targets:
T1: ₹738
T2: ₹750 (supply zone / fib level)
T3: ₹765+ (if breakout sustains in 1H)
🛑 Stop Loss:
Conservative SL: ₹707 (below support + 9EMA)
Aggressive SL: ₹712 (tight SL for intraday)
For Education Purposes Only
Equity Research Update – Paras Defence and Space Technologies CMP: ₹1,143 | Upside Potential: High
Paras Defence has broken out of a strong resistance zone (~₹1,120–₹1,160), confirmed by significant volume and bullish momentum. The RSI shows strength above 70, indicating buyer dominance. Historical resistance, marked by previous rejections, may now act as strong support. If sustained, this breakout could lead to a fresh uptrend. Investors may consider accumulating on dips with a medium-term target of ₹1,300–₹1,350, keeping a stop-loss below ₹1,080.
Recommendation: BUY on Breakout Confirmation
For Education Purpose only

Time to "ZOOM" back to winnings ways?On Thursday afternoon, the King Trading Momentum Strategy triggered alongside eleven other alerts, followed by five more on Friday. This flurry of signals doesn’t exactly indicate a “bearish” sentiment, but as always, the market has its unpredictable ways! With markets approaching all-time highs, I’ve been cautious, limiting my positions to just a few with low allocations in TNA, ADBE, PYPL, and XYZ.
When I analyzed Zoom (ZM), I noticed that it experienced a strong rally from July through the end of the year, gaining over 50%. Now, the key question is: has it finished consolidating, or is there more downside ahead?
Looking back to July, ZM’s performance suggests a classic bull flag pattern. It’s retraced to the 38% Fibonacci level, and during a two-hour window when the signal fired, the impressive “wick” formed caught my attention. Now, after a short-term pump, it’s retracing again, and I’m eyeing the 50% Fibonacci level as a potential entry point.
Unless Monday brings a major selloff due to concerns over the Fed meeting on Wednesday or the PCE data on Friday, I’ll likely use the usual morning volatility to position myself in this trade. Let’s see how this one unfolds!
The King Trading Momentum Strategy employs a robust combination of indicators: the 5 EMA crossing above the 13 EMA, RSI strength, favorable momentum measured by ADX+, and MACD confirmation. ZM, along with over 100 other equities, is integrated into this script with optimized backtested take-profit and stop-loss levels. Activating these parameters is as simple as checking a box (they’re off by default), making this strategy both powerful and user-friendly.

Alvotech breaking out towards 16-18 levelAfter price broke out of the bearish line before and after making a hammer, it started a retracement.
My assumption is it will eventually retest the Weekly EMA 10 levels, which will serve as support.
Going long there (with the SL below the EMA 10) is a conservative way to enter the bullish trend.
We have measure the long wick/shadow of hammer to calculate the target price (12.57-9.15=3.42).
TP1 = 16 (3.42+12.6) handle and TP2 = 18 (old supply zone).
In terms of trade management, when TP1 is hit I would take profit on half of my position and roll my stop loss to breakeven, enjoying a risk free trade towards TP2.
There are 5.5 pips to be made (if this pair follows the script) and the trade has a reward – risk ratio of 9!

Technical Analysis Report: Balmer Lawrie & Co. Ltd.Overview:
Balmer Lawrie & Co. Ltd. is showing key technical setups, offering potential trading opportunities. Here's a concise breakdown based on the daily chart analysis.
Key Observations:
1.Fibonacci Retracement:
The stock retraced to the 0.5 level at INR 225.00 and rebounded from the 0.382 level (INR 202.40).
2.Chart Patterns:
An inverse head-and-shoulders pattern signals potential reversal, with a target of INR 263.45 if INR 249.54 is breached.
3.Moving Averages:
Near-term support: 20-day EMA (INR 232.30) and 50-day EMA (INR 238.84).
Resistance: 200-day EMA (INR 245.56), aligning with the pattern neckline.
4.RSI Momentum:
RSI at 58.36 suggests mild bullish momentum, with room for upside.
Key Levels to Watch:
Resistance: INR 249.54, INR 263.45, INR 279.95.
Support: INR 238.00, INR 225.00, INR 202.40.
Potential Scenarios:
Bullish: A breakout above INR 249.54 could lead to INR 263.45 and potentially INR 279.95.
Bearish: A rejection near INR 249.54 may push prices back to INR 238.00 or lower.
Volume Analysis:
Rising volume indicates renewed buying interest, supporting a bullish outlook.
Conclusion:
Balmer Lawrie & Co. Ltd. is poised for a potential breakout above INR 249.54. Traders should monitor key levels closely and manage risk accordingly.
Disclaimer:
This analysis is for educational purposes only and not financial advice. Conduct your own research before investing.

Pfizer Ltd. - Short Position AnalysisChart Overview:
The chart indicates that the stock is in a clear downtrend, following a descending channel pattern. The price is nearing a key horizontal support level (marked in black), and a breakdown below this level may present a shorting opportunity.
Trade Setup for Short Position:
1.Entry Trigger: Below ₹5,028 on a daily closing basis.
2.Targets:
Target 1: ₹4,885 (first demand zone).
Target 2: ₹4,760 (strong support and lower boundary of the descending channel).
3.Stop Loss: Above ₹5,187 (recent swing high and red-dotted resistance level).
4.Risk-Reward Ratio: Ensure a favorable ratio of at least 1:2.
Alternate Scenario:
If ₹5,028 holds as support, the stock might see a pullback toward ₹5,187, where selling pressure could resume.

Polycab India Ltd. - Short Position SetupAnalysis for Short Position Condition:
1.Key Breakdown Level:
₹7,282 is a critical horizontal support level. A decisive breakdown below this level could trigger a bearish move.
2.Volume Profile Analysis:
Below ₹7,282, the volume profile shows limited buying interest until ₹6,997, suggesting a potential drop to this level.
Further weakness could see the stock test ₹6,746, where significant buying activity has previously occurred.
3.Trendline Breakdown:
The stock is trading within an ascending channel. A breakdown below ₹7,282 will confirm the failure of this channel, indicating a trend reversal.
4.Moving Averages:
The 20-day EMA is currently acting as dynamic support near ₹7,282. A breakdown will likely push the stock toward the 50-day EMA around ₹6,997.
The 200-day EMA near ₹6,746 is a long-term support level to monitor.
5.RSI (Relative Strength Index):
RSI is neutral but could head toward oversold levels if the breakdown occurs, strengthening the bearish view.
6.Volume Confirmation:
Watch for an increase in sell-side volume during the breakdown for confirmation.
Trade Plan for Short Positions:
Entry Trigger: Below ₹7,282.
Targets:
Target 1: ₹6,997
Target 2: ₹6,746
Stop Loss: Above ₹7,438 (previous high near resistance).
Risk-Reward Ratio: Ensure an ideal ratio of at least 1:2 for the trade.
Alternate Scenario:
If ₹7,282 holds and the stock bounces, the immediate upside resistance is ₹7,654, above which the stock may resume its bullish trend.

SBI Life Insurance Co. Ltd. - Technical Analysis UpdateSupport and Resistance Zones:
1.Key Support Zone: ₹1,385-₹1,463
This zone aligns with the Fibonacci 0.236 retracement level and the recent reversal point, making it a strong support.
2.Immediate Resistance Levels:
₹1,555 (Fibonacci 0.382 retracement).
₹1,630 (Fibonacci 0.5 retracement).
₹1,705 (Fibonacci 0.618 retracement), a crucial level to watch.
3.Fibonacci Retracement Levels:
The stock has retraced sharply from its high of ₹1,943 and is showing signs of reversal near the 0.236 Fibonacci level. A breakout above ₹1,500 could confirm bullish momentum toward higher Fibonacci levels.
4.Volume Analysis:
Volume appears to be increasing near the support zone, indicating buying interest from market participants.
The Volume Profile indicates strong accumulation between ₹1,400-₹1,500.
5.Moving Averages:
The stock is attempting to reclaim the 20-day EMA as a dynamic support.
A crossover above the 50-day EMA could signal further bullish strength.
6.RSI (Relative Strength Index):
RSI is recovering from oversold levels, indicating a possible trend reversal. A move above 50 would strengthen the bullish case.
7.Projection:
If the stock sustains above ₹1,463, it could aim for ₹1,555 in the short term and ₹1,705 in the medium term.
A break below ₹1,385 would invalidate this view and could lead to further downside.
Conclusion:
SBI Life Insurance is poised for a potential bounce-back. Traders can consider entries near the ₹1,450-₹1,470 range, targeting ₹1,555 and ₹1,705 with appropriate stop losses below ₹1,385.

PFC: Bullish Breakout with Raghanseda Project Development 1.Chart Pattern:
The stock has broken out of a downward-sloping trendline after a prolonged consolidation phase within a rectangle pattern (yellow box).
This breakout is supported by higher volumes, signaling strong buying interest.
2.Fundamental Trigger:
Power Finance Corporation has incorporated an SPV for the Raghanseda Transmission Project, enhancing its growth outlook.
3.Technical Levels:
Current Price: ₹512.20
Immediate Support: ₹499.95 (near breakout zone).
Critical Stop-Loss: ₹472.95 (below previous support).
Upside Targets: ₹527.45 (minor resistance) and ₹556.00 (major target, ~11% upside potential).
4.Indicators:
RSI is trending upwards, indicating positive momentum but not overbought.
Moving averages are aligning for a bullish crossover, supporting further upside.
5.Projection:
If the price sustains above ₹500, we could witness a rally towards ₹556 in the near term.
Traders may consider entering on pullbacks near ₹500 with a stop-loss at ₹472.95.
Risk Disclaimer: This is for educational purposes only. Conduct your own research before making any trading decisions.

ICICI Lombard GIC Ltd. - Technical AnalysisPrice Action:
The stock recently took support near the 0.5 Fibonacci retracement level around ₹1,892, bouncing back with strong momentum. This aligns with a visible bullish RSI divergence as the price formed lower lows while the RSI made higher lows, signaling a potential reversal.
Key Levels (from Fibonacci):
Resistance 1: ₹1,987 (61.8% Fibonacci level)
Resistance 2: ₹2,127 (78.6% Fibonacci level)
Final Target: ₹2,299 (Fibonacci extension, previous high)
Support 1: ₹1,892 (0.5 Fibonacci level, current support)
Support 2: ₹1,796 (38.2% Fibonacci level)
Support 3: ₹1,677 (23.6% Fibonacci level)
Entry, Stop Loss, and Targets:
Entry: Around ₹1,940-₹1,950 (post breakout confirmation above ₹1,950).
Stop Loss: ₹1,875 (below the 0.5 Fibonacci level and near recent support).
Targets:
Target 1: ₹1,987 (61.8% Fibonacci level)
Target 2: ₹2,127 (78.6% Fibonacci level)
Target 3: ₹2,299 (previous swing high)
Volume and RSI Observations:
The volume profile shows increased participation near ₹1,900 levels, confirming accumulation.
RSI is recovering from oversold levels and shows divergence, supporting a potential bullish continuation.
Conclusion:
If the stock holds above ₹1,892, the bullish trend might continue toward ₹1,987 and higher targets. Maintain discipline with the stop-loss to manage risk effectively.

Zydus Lifesciences (NSE:ZYDUSLIFE)Overview: Zydus Lifesciences is currently at an interesting juncture, with signs of a potential reversal from recent lows. The price action suggests a possible recovery towards higher resistance levels, supported by technical indicators and market sentiment. Nomura's revised price target of ₹1,030, while maintaining a Neutral rating, aligns with this view.
Key Levels to Watch:
Current Price: ₹966.65
Immediate Support (SL): ₹902.55
Key Resistance Zones: ₹1,008.35, ₹1,041.45, and ₹1,102.15
Technical Analysis:
Volume Profile: The visible range volume profile shows significant accumulation near ₹1,000, which could act as a strong magnet for the price.
Moving Averages: The stock has started reclaiming its short-term moving averages. A breakout above the 200-day MA would confirm bullish momentum.
RSI (Relative Strength Index): The RSI is trending upwards, indicating improving bullish momentum. Divergence suggests a potential reversal.
Price Action: The formation of higher lows near ₹949 reinforces the possibility of a short-term recovery.
Trading Strategy:
Entry Zone: Between ₹950 and ₹970, as the stock shows stability near support levels.
Stop-Loss: Strict stop-loss at ₹902.55 to limit downside risk.
Targets:
Target 1: ₹1,008.35
Target 2: ₹1,041.45
Extended Target: ₹1,102.15
Risk Management:
Position size will depend on risk tolerance, ensuring a Risk-Reward ratio of at least 1:2.
Avoid chasing the price above ₹970 if momentum wanes.
Final Thoughts: Zydus Lifesciences presents a favorable risk-reward scenario with clear technical signals for a rebound. However, macroeconomic factors and sector performance will play a critical role in sustaining the move. Traders should monitor price action near the resistance zones closely for signs of continuation or rejection.

Analysis of Moving average stock for intraday (28/Nov/2024)Analysis of Moving average stock (28/Nov/2024)
follow for more updates and information
