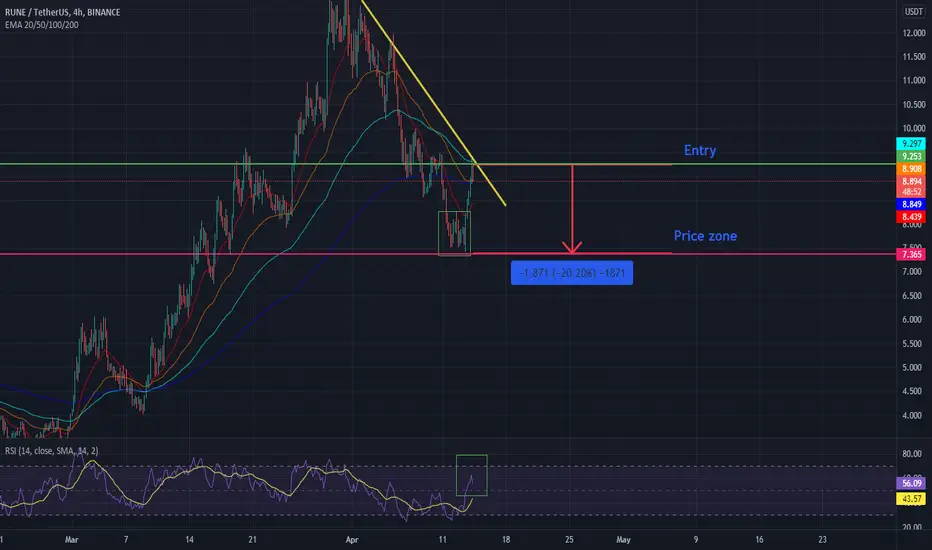
RUNE/USDT double top playing out The RUNE/USDT has showed a double top pattern on the 4H chart and is likely to play out on the longer time frames.
This follows a likely price drop from 9.29 USDT to 7.38 USDT. A drop in 20%.
This also follows a rejection from the EMA lines and the RSI shows signs of being overbought.
Here has the analysis showed sign of playing out on the daily time frame.
No financial advice.
Emacrossover
2022-04-07 OPULUSDT Finding a Bottom & Looking to LongSome thoughts on OPULUSDT:
Daily: showing signs of a change in fortune. 10/20 EMA cradle has turned bullish.
12hr: looking very positive as well. Broken through the 100EMA and is retesting the 10/20EMA for a new support level.
4hr: Couple of shots of the 4hr showing possible targets if the $1 boundary (black line) is broken.
1hr: Showing signs of needing a bit of a cool off on the lower timeframes. I've marked areas of interest for taking a long entry.

Economic Bubbles and EMA 100/200Here is an BTC analysis of the current price drop, and based on the Theory of Financial Bubbles can we spot three bubble ish formations in the past years.
The three points in time this analysis sees are the bubbles in 2018 when the price drop followed by a pump to the upside, not as high as the previous high but this was followed by a drastic drop
The market followed the economic bubble theory with a peak which followed by a price drop, by the time the price started to stabilize itself did investors take profit and the price crashed into a panic sell off.
The second point in time this happened was the start of the Covid pandemic which caused the price to follow this same movement to its low.
Now in 2022 can we see this similar movement where the price has started to drop which will continue downwards and after this initial downtrend will the price pump slightly upwards where investors take profit and after this pump will the price crash. Following the Financial Bubble Theory.
Something we trader also need to take into account which may confirm this analysis is the movement in in EMA 100 which during these three points in time crossed down below the EMA 200.
Entry Price: 3200 USD
Target Price 1: 2500 USD
Target Price 2: 2100 USD
Target Price 3: 1700 USD
When taking this position do we need to focus on the initial drop and when the price pumps upwards do need to take into account for the downwards sloping resistance line, if the price breaks the trend line to the upside is the trend likely to reverse and do a final longer push.
This assumption is less likely to happen, as the general price trend is a take profit zone before the price hits the panic zone and its final drop off.
This pump from the initial low may have already happened in the case of BTC, which we did not see in ETH yet. Meaning that the price now touched the downwards sloping resistance before continuing downwards.
Together with a negative price strength, an EMA 100 below the EMA 200 and the price doing its second pump into the take profit zone before the drastic drop can we build a theory which looks negative.
This is not financial advice.

Economic Bubbles and EMA 100/200Here is an ETH analysis of the current price drop, and based on the Theory of Financial Bubbles can we spot three bubble ish formations in the past years.
The three points in time this analysis sees are the bubbles in 2018 when the price drop followed by a pump to the upside, not as high as the previous high but this was followed by a drastic drop
The market followed the economic bubble theory with a peak which followed by a price drop, by the time the price started to stabilize itself did investors take profit and the price crashed into a panic sell off.
The second point in time this happened was the start of the Covid pandemic which caused the price to follow this same movement to its low.
Now in 2022 can we see this similar movement where the price has started to drop which will continue downwards and after this initial downtrend will the price pump slightly upwards where investors take profit and after this pump will the price crash. Following the Financial Bubble Theory.
Something we trader also need to take into account which may confirm this analysis is the movement in in EMA 100 which during these three points in time crossed down below the EMA 200.
Entry Price: 3200 USD
Target Price 1: 2500 USD
Target Price 2: 2100 USD
Target Price 3: 1700 USD
When taking this position do we need to focus on the initial drop and when the price pumps upwards do need to take into account for the downwards sloping resistance line, if the price breaks the trend line to the upside is the trend likely to reverse and do a final longer push.
This assumption is less likely to happen, as the general price trend is a take profit zone before the price hits the panic zone and its final drop off.
This is not financial advice.

$SOL Swing Long Breaks Through Downward Wedge (TP Targets)Congrats to those who did enter Solana as it nearly retraced exactly to the 0.5 fib level.
This breakout has the potential to go move back up to the $250 zones. With the 20 EMA close to crossing over the 50 EMA and 200 EMA, Solana can potentially range between $500 to $1000 In the next upcoming months or year.
Those who entered around the 0.5 level, maybe slightly higher, or even on the break out are now over 60% in profits.
Targets for $SOL: 111.10 - 125.26 - 143.83 - 171.48 - 208.23 +
SL: Move your stop losses to 97.5
We could potentially see a move down to the 100 - 110 area however if the daily closes above the 200 days EMA, expect SOL to continue moving up even higher than its current price.

SPX EMA Buying IndicationSPX has seen 6 instances since 2003 where the 100 EMA has crossed below the 200 EMA.
With the majority of these identifying an optimal buy/entry point, with the strategy to look consider the depth of retracement and to scale into positions for optimal ROI once the market recovers.
The only major time where this was not close to the lowest retracement point was follwoing the housing market bubble which saw the 100 EMA remain below the 200 EMA for approx. 600 days with the optimal buy zone occurring 2/3 of the way through around 190 days before the 100 EMA crossed above.
#1. 20% Oct-Dec 2018, 100 EMA below 200 EMA approx 80 days from mid-Dec 2018 to mid-Mar 2019
#2. -35% Feb to Mar 2020, 100 EMA below 200 EMA approx 80 days late-Mar 2020 to mid-June
#3. -58% Oct 2007 to Mar 2009, 100 EMA below 200 EMA approx 600 days from Jan 2008 to Sep 2009. Lowest point was approx 190 days from 100 EMA crossing back above 200 EMA
Other periods to consider where 100 EMA crossed below 200 EMA:
Jan to Apr 2016
Sep to Nov 2015
Sep 2011 to Jan 2012
NOTE:
- THE CURRENT MACRO ENVIRONMENT REFLECTS A DEEP RECESSION IS LIKELY BASED ON COMMODITIES AS WELL AS THE BREADTH OF ASSETS & EQUITIES WITH VALUATIONS AT OR NEAR ATH'S.
- Correction likely to be similar if not deeper than what was realized when the housing market collapsed in 2008 given the more widespread high prices driven by absurd amounts of excess money supply with rates at/near zero.

Ford seems to be finding a bottomFord Motor Company F
Areas of interest:
Consolidation:
1) $19-20.50
2) 17.52-18.59
Breakup at $21.50
Breakdown at $16.49
Recent overhead gap between $18.46-19.89
Reversal candles seem to be appearing in the lower consolidation zone (2) on the 3 day chart - almost looking like an inverted hammer but not enough wick to truly label them as such.
Indicators show us on the 3 DAY chart:
Currently trading below the 12 and 26 EMA
The 12 is above the 26 but appear to be attempting to cross soon if bears take control and push the stock price below consolidation 2 (listed above)
Currently trading above the 50 MA
The 50 MA recently has acted as support and seems to have help stabilize the stocks price into consolidation for the past 1.5 weeks of trading
Observations from a bull and bear side:
As a bull, I (obviously) want to see the 50 MA hold and to see divergence of the 12 and 26 EMA (to the upside) to shake any fears of a potential cross under (12 under 26). Recapturing $19 would be my first target. A break and hold of this level will signify an attempt by the buyers to send the price of Ford back to its consolidation zone. This is needed in order for Ford to breakout and create NEW structure. The previous attempt was rejected as the price moved too fast to levels not seen in 20 years. Remember, there is such thing as a 20 year bag holder. Employees, insiders, investors, retail, shorts, etc. A blue chip company like this needs to gradually climb, in stairstep manor, creating small consolidation periods where the market accepts small movements one at a time. That said, I would love to see Ford make use of its previous consolidation zone to prep for the next level. In my opinion, this would be $21.50-22.50.
As a bear, a break below the 50 MA while considering the breakdown level of $16.73 should be watched. A break below 16.49 would potentially send Ford down to it's PREVIOUS structure between $12.38-16.49. I want to highlight this only to prep for the potential this could happen -imo it is unlikely unless the entire market continues to slide further into a true recession/crash. For this fact alone, either selling covered calls at this breakdown level or buying puts would be a good way for Ford longs to fight against this scenario.
Most recent news - I will makes this as UNBIASED as possible:
1. (RUMOR) - "Ford is considering separating its electric vehicle business from its legacy operations, Bloomberg reported Friday."
www.thestreet.com
2. (Heavy Bullish Opinion Piece) - "The legacy automaker has copied from its great rival a method which makes it possible to have updated cars regularly and to reduce costs."
www.thestreet.com
3. (Bearish Facts, sorry Bulls) - "New Broncos Are Reportedly Sitting Undelivered Due to Chip Shortage"
www.roadandtrack.com
4. (Interesting way to approach safety) - "Ford’s latest road safety idea? In-car sounds of pedestrians and bike bells"
road.cc
5. (Counter to #1) - "“We have no plans to spin off our battery electric-vehicle business or our traditional ICE business.”
www.barrons.com
6. (Consumer Report top EV pick awarded to Ford) "Ford Mustang Mach-E Is Consumer Reports' EV Top Pick. The Tesla Model 3 won the award for the last two consecutive years."
insideevs.com
7. (DON'T count out NASCAR, man) www.nascar.com
8. (New turbocharged inline-4 SUV) - www.motorauthority.com
9. (Not sure how this will play out, probably BAD PR tbh) - "Ford says it's working with unvaccinated salaried employees before rolling out unpaid leave plan"
www.wxyz.com
10. (Ford building new plants) -
www.autonews.com
11. (Fords push to EV and battery solutions) - "Ford, Volvo join Redwood in EV battery recycling push in California" www.reuters.com

SHIB reaching breakout levelsBINANCEUS:SHIBUSDT
SHIB seems to be throwing me a buy signal on the Hiekin Ashi chart using the 12/26 EMA crossover
Using the daily chart only as a starting point to reduce the view down to the 1 and 4 hr chart
You can see on the daily that the EMA cross has happened (as long as this daily candle holds bullish)
A daily bullish candle close at current levels would be the 3rd day in a row of bullish candles above previous resistance - a cup and handle pattern will not be looked for imo
Going down to the 1 and 4 hr chart:
We can see a crossover on the 4th of Feb
There is also a crossover on the 1 hr on the 9th of Feb
All crossover proceeded by bullish candles
All bearish candles respecting the 12 EMA and bouncing
There are 3 patterns I see being formed and respected, all wedges: a wedge within a wedge within a wedge
IMO it is too early to tell if the smaller(more micro/local) wedges will assist in breaking resistance of the macro wedge
It is possible that the larger wedge may need more time before an official break

STM - is it about to start a new EW pattern and breakout?EURONEXT:STM
Might be a potential swing here. Currently trading at 4x its ATR and 4x its relative volume in the past 30min. Chart looks promising for bulls IMO. Support is the 200 MA on the daily so stop loss is TIGHT right now but the upside would be 52 if $46 is broken and held. I would look to NVDA and AMD though to see how the market is going to react to the semiconductor industry for context. Also a possible corrective wave C just ended and we are about to begin a new EW pattern.

BBIG on a breakout? Testing 200 MA?Wedge 1, retracement after run up, break out of pattern using underlying support, bounce off 200 MA, 12/26 EMA crossover, run up
Wedge 2, retracement after run up, breakout of pattern using underlying support, bounce off 200 MA, 12/26 EMA crossover, run up
Wedge 3, retracement after run up, breakout of pattern using underlying support, 12/26 EMA cross over possibly coming, this time trading under 200 MA
200 MA major resistance but a break above is BULLISH to me - look for golden cross if bulls maintain control.

BTC Head and Shoulders in unison with EMA death crossBTC has just broken the neckline of the head and shoulders pattern that has been forming since July. This break in the neckline happened in unison with the EMA death cross and I think we could see price fall all the way down to the low 30,000's.

STLA about to get some love? Breakout on the HorizonMIL:STLA
A basic look at STLA is showing the MACD green and strengthening
The 12 EMA just crossed over the 26 EMA
Resistance:
20.53
20.80
21.29
21.99
Support:
18.81
18.83
17.59
17.13
Breakup Zone: 20.80-21
Breakdown Zone: 18.83-18.50
Currently at 20.29

Cipla 1HR Time Frame EMA with Support and Resistance !This is a Simple Strategy with only use of EMA
1. Add 50 and 200 EMA
2. Set Time Frame to 1hr or Your Comfort
3. if 50 EMA Cross above 200 means its a Buy trade !
4. Similarly if 50 Cross Below 200 EMA Means its a Sell Trade !
5. Take Profit is previous support or Resistance or you can use 50 EMA Crossing as a Take Profit also

IBIO head and shoulders with bearish EMA crossover.IBIO price is currently touching neckline of the Head and shoulders pattern. In addition to this we can see a bearish EMA crossover has recently occurred. I expect to see a break in the neckline followed by a significant drop in price.


BUY BTCBTC just broke 100 ema that was acting as resistance from a long time, now acting as support. Coupled with forming a cup and handle platform. Looks really good for a long.
DAILY TIME FRAME AND 4HR TF SHOWING BULLISH DIVERGENCE AS WELL.
We have 3 Factors combined to increase probability.


DeFi aggregator Troy lifting off NOW. ($TROY)DeFi play TROY is a Smart Hybrid Asset Management System offering yield farming, fixed savings, a liquidity aggregator (for Binance, Huobi, OKex, Uniswap, Curve, Balancer), provider of arbitrage opportunities, etc.
EMA is in a healthy spot with MACD and other important indicators ready to bounce up for the next big jump. TROY softened a little on the last BTC drop but not nearly as much as others like DENT, HOLO, etc., which points to some serious momentum up. This coin hasn't had the massive jump yet that other microcaps have and it's a 10 billion coin circulation not 100 billion like HOLO and others which means a much higher target price .
A few sources say whales have been accumulating. Trust the charts, not the "crowd wisdom" on this one and take your positions now...
Buying information for a very accessable exchange as well as financial disclaimer in the signature.
Good luck.

SNX Potential Buy Opportunity 80%+ Gain NEW ATH Chart UpdateSNX on its way back to the upside, strong bullish sentiment with the 13 EMA crossing UP 50 SMA, Buy signal triggered by script...HODL positions 25% Gain to ATH from current price level. New ATH high insight at $32.87.

PG 8/21 EMA cross8 EMA crossed the 21 multiple times in the past week. If the 50 comes below the 8/21 I think we can expect a full bull play from the pennant forming.

NUUSD - EMA Cross & Increased Volume.Hello Traders,
NUUSD looks to be building a strong pattern for an increase. I'm targeting $.22 for 16% gains.
Volume has increased over the last few hours. EMA 9:26 Day is about to cross. Broke the downward trendline. If it can continue to build momentum, this should be one of the stragglers to join the crowd and blast off.
Good luck!

AAVE Coming w/ The Pre-Holiday DipMy Fellow Crypto Traders,
Appreciate you taking the time to view my analysis which I hope you may find beneficial. Please be sure to “LIKE” if you indeed find my analysis useful and/or find my analysis intriguing.
Cheers & Happy Trading!
--------------------------------------------------------------------------------------------------------------------------------------
Analysis:
AAVE 9EMA is looking to cross the downside, forming an EMA-Crossover. This narrative is supported by the RSI Making lower highs, in comparison with price action. Therefore, expect a dip to previous support levels.

UNI Gearing UP for Higher Highs?My Fellow Crypto Traders,
Appreciate you taking the time to view my analysis which I hope you may find beneficial. Please be sure to “LIKE” if you indeed find my analysis useful and/or find my analysis intriguing.
Cheers & Happy Trading!
--------------------------------------------------------------------------------------------------------------------------------------------
UNI is on the hunt for a 9EMA crossover, where a possible 200EMA resistance test is in play. Therefore, should see a swing to the upside. If the developing parallel channel holds true, target would be around 6.92 somewhere around Christmas.
