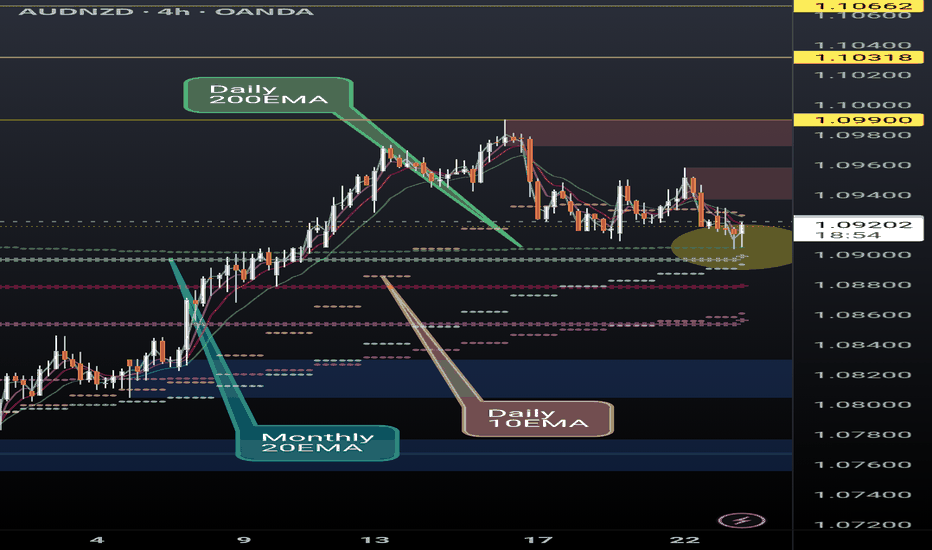
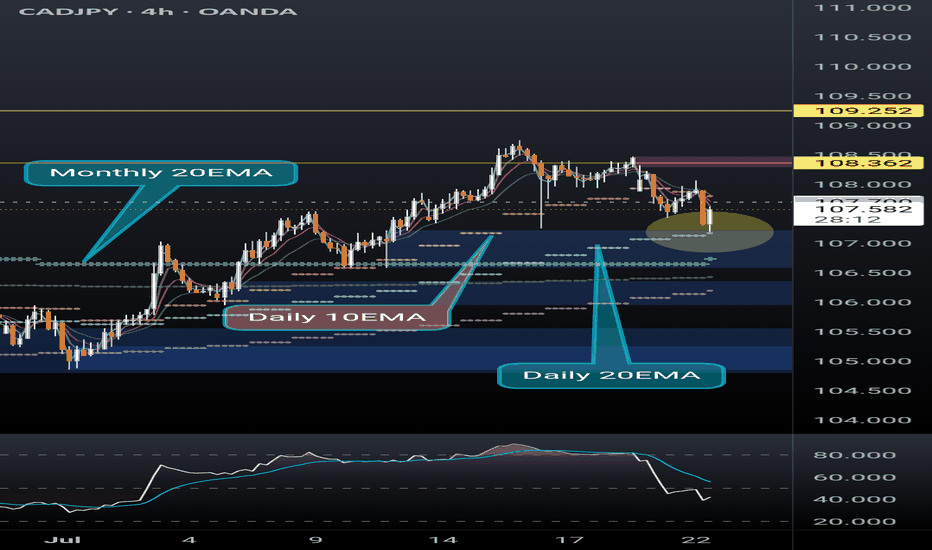
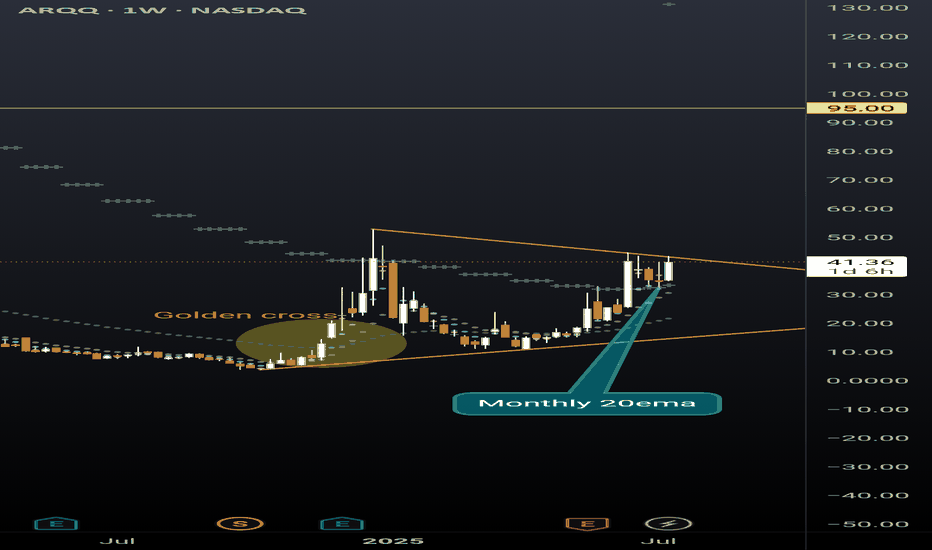
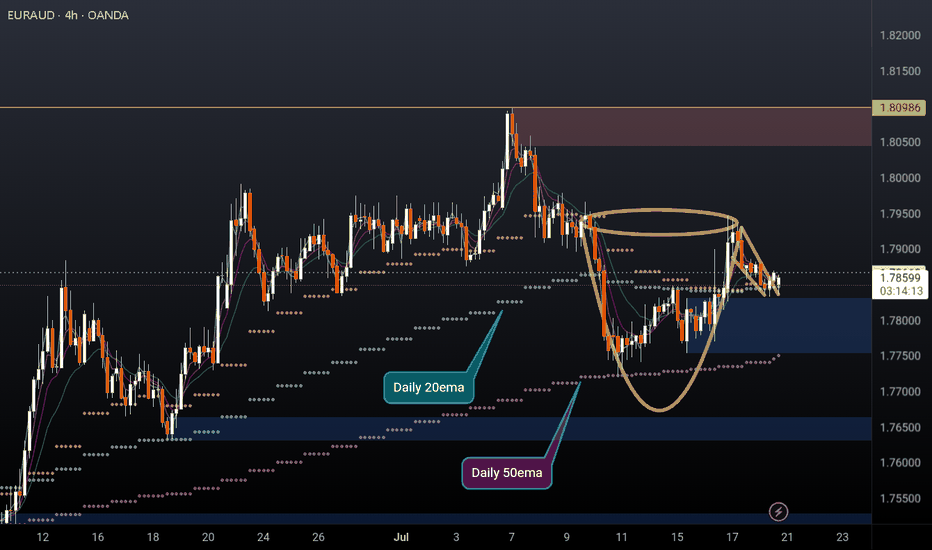
How to Use Exponential Moving Averages?The Exponential Moving Average (EMA) is one of the most popular technical indicators for traders, known for its sensitivity to recent price changes and ability to reveal trends in real-time. This is certainly not a 100% grail or a super indicator! But I would recommend not to ignore EMA during backtests
What is the Exponential Moving Average (EMA)?
The EMA is a moving average that gives more weight to recent prices, allowing it to react faster to price changes compared to the SMA. This quality makes EMA especially valuable in volatile markets like cryptocurrencies, forex, and stocks. Typically, traders use the EMA to smooth price data, making it easier to spot trends and reversals.
Key EMA Timeframes:
Short-Term: 10-20 EMA (for quick trades and scalping)
Medium-Term: 50 EMA (commonly used to gauge trend direction)
Long-Term: 100-200 EMA (used to assess overall market sentiment)
Why Use EMA in Trading?
The EMA helps traders identify the trend direction, evaluate market momentum, and recognize possible reversal points. Because the EMA adjusts quickly to price changes, it is effective for day trading, intraday trading, and even longer-term investing. Its responsiveness is particularly useful for:
Trend Confirmation: The EMA helps traders confirm if a trend is upward or downward. Multiple EMAs used in combination can highlight potential crossovers that signal trend shifts.
Entry and Exit Signals: EMA crossovers and support/resistance levels can serve as effective entry and exit points.
Momentum Assessment: Short-term EMAs provide insight into current momentum, while longer-term EMAs reveal broader market sentiment.
Pros and Cons of Using EMA in Trading
Pros:
Reactiveness: EMA adjusts quickly to new price movements, helping identify trends sooner than SMA.
Versatility: Suitable for various timeframes, from scalping to swing trading.
Clear Signals: Effective in trending markets for capturing entry and exit points.
Cons:
Sensitivity to Noise: EMA is more susceptible to market “noise” or erratic price swings, leading to potential false signals in choppy markets.
Not Ideal for Ranging Markets: EMA is less effective in sideways or consolidating markets.
Tips for Trading with EMA
Use EMA in Trending Markets: EMA performs best when there is a clear trend. In ranging markets, signals are less reliable.
Combine EMA with Other Indicators: Use indicators like RSI or MACD to confirm EMA signals and reduce the chances of false breakouts.
Stick to Risk Management Rules: EMAs, while effective, are not foolproof. Always set stop-loss levels and use proper position sizing to manage risk effectively.
Hope you enjoyed the content I created, You can support with your likes and comments this idea so more people can watch!
✅Disclaimer: Please be aware of the risks involved in trading. This idea was made for educational purposes only not for financial Investment Purposes.
---
• Look at my ideas about interesting altcoins in the related section down below ↓
• For more ideas please hit "Like" and "Follow"!
EMAS
KIRLOSBROS - Cup & Handle patternAll details are given on chart. If you like the analyses please do share it with your friends, like and follow me for more such interesting charts.
Disc - Am not a SEBI registered analyst. Please do your own analyses before taking position. Analysis provided on chart is only for educational purposes and not a trading recommendation.
$BA 1D Idea🚨 Boeing (BA) Analysis 🚨
🔻 Falling Wedge: BA is in a falling wedge pattern, signaling a potential reversal soon.
📊 Key Levels:
Support: $146
Resistance: $165-$170
Current Price: $152.35 (-25.88%)
🟢 Oscillator: Currently oversold in the green zone, suggesting a possible bounce.
📈 Watch for a breakout above the wedge for a move toward $165. Failure to hold $146 could lead to further downside.
Copper Pulls Back as China Optimism FadesCopper extended the August rebound into autumn and reached three-month highs, helped by the Fed’s jumbo rate cut and massive stimulus from Chinese authorities aiming to prop the economy and the property sector. However the measures do little to address the structural problems and the real estate market is unlikely to return to its former glory, while the lack of follow through on the fiscal front this week caused prior optimism to subside. Furthermore, the Fed has struck a more cautious approach towards further easing and Friday’s strong jobs report supported the reserved commentary. Markets have now priced out previous aggressive bets for 75 bps of cuts this year, aligning with the Fed’s 50 bps projections.
Copper pulls back as a result, threatening the EMA200 (black line) and the 50% Fibonacci of the recent recovery. A breach would pause the upside bias, send the non-ferrous metal into the daily Ichimoku Cloud and expose it to the ascending trend line from the August lows. Deeper correction however does not look easy under the current technical and fundamental backdrop.
There are still hopes for additional Chinese stimulus (potentially within the weekend), while prospects of US soft-landing and easier monetary policies in major economies can support higher prices. So do the AI boom and the green energy transition. Copper tries to defend the EMA200 that maintains its recovery momentum. This will allow it to push again towards 4.791, but we are cautious around further strength at this stage.
Stratos Markets Limited (www.fxcm.com):
CFDs are complex instruments and come with a high risk of losing money rapidly due to leverage. 64% of retail investor accounts lose money when trading CFDs with this provider . You should consider whether you understand how CFDs work and whether you can afford to take the high risk of losing your money.
Stratos Europe Ltd (trading as “FXCM” or “FXCM EU”) (www.fxcm.com):
CFDs are complex instruments and come with a high risk of losing money rapidly due to leverage. 66% of retail investor accounts lose money when trading CFDs with this provider . You should consider whether you understand how CFDs work and whether you can afford to take the high risk of losing your money.
Stratos Trading Pty. Limited (www.fxcm.com):
Trading FX/CFDs carries significant risks. FXCM AU (AFSL 309763). Please read the Financial Services Guide, Product Disclosure Statement, Target Market Determination and Terms of Business at www.fxcm.com
Stratos Global LLC (www.fxcm.com):
Losses can exceed deposits.
Any opinions, news, research, analyses, prices, other information, or links to third-party sites contained on this video are provided on an "as-is" basis, as general market commentary and do not constitute investment advice. The market commentary has not been prepared in accordance with legal requirements designed to promote the independence of investment research, and it is therefore not subject to any prohibition on dealing ahead of dissemination. Although this commentary is not produced by an independent source, FXCM takes all sufficient steps to eliminate or prevent any conflicts of interests arising out of the production and dissemination of this communication. The employees of FXCM commit to acting in the clients' best interests and represent their views without misleading, deceiving, or otherwise impairing the clients' ability to make informed investment decisions. For more information about the FXCM's internal organizational and administrative arrangements for the prevention of conflicts, please refer to the Firms' Managing Conflicts Policy. Please ensure that you read and understand our Full Disclaimer and Liability provision concerning the foregoing Information, which can be accessed via FXCM`s website:
Stratos Markets Limited clients please see: www.fxcm.com
Stratos Europe Ltd clients please see: www.fxcm.com
Stratos Trading Pty. Limited clients please see: www.fxcm.com
Stratos Global LLC clients please see: www.fxcm.com
Past Performance is not an indicator of future results.
USDJPY Rebound Faces Pushback at Key ResistanceAfter the Fed’s jumbo pivot in September and aggressive easing path, Chair Powell adopted a more reserved approach at the start of the previous week. The cautious messaging was extrapolated at the end of that same week by the strong jobs report. Markets have now priced out bets for another outsized move, expecting 50 bps of cuts by the end of the year, in line with the Fed’s projections.
At the same time, the Bank of Japan has shifted to a more patient approach to monetary tightening, after last month's hold, removing guidance for further hikes ahead. The August deceleration in wage growth adds a reason for caution, while the current political landscape does not favor aggressive tightening. With elections due later this month, the new Prime Minister does not see the need for more hikes.
As a result of these developments, USD/JPY posted its best week of the year and extends its gains into the daily Ichimoku Cloud, testing the pivotal 38.2% Fibonacci. This creates scope for further recovery towards 151.90, but we are cautious about sustained advance as the upside is unfriendly technically and fundamentally.
Inflation (ex-fresh food) in Japan has been rising for the past four months and remains above the 2% target for more than two years, wages are elevated and GDP posted strong growth in Q2. One more rate hike within the year is still reasonable and BoJ officials still see more tightening if the economy evolves as projected. Chair Powell may have struck a more cautious tone, but officials still expect another 150 bps of cuts by the end of next year, so the broader policy dynamics remains unfavorable for USD/JPY.
The pair faces pushback at the 38.2% Fibonacci and rejection could send it back below the EMA200 (black line) and reaffirm the bearish bias. This would in turn create scope for new 2024 lows (139.57), although strong catalyst would be required.
Stratos Markets Limited (www.fxcm.com):
CFDs are complex instruments and come with a high risk of losing money rapidly due to leverage. 62% of retail investor accounts lose money when trading CFDs with this provider . You should consider whether you understand how CFDs work and whether you can afford to take the high risk of losing your money.
Stratos Europe Ltd (trading as “FXCM” or “FXCM EU”) (www.fxcm.com):
CFDs are complex instruments and come with a high risk of losing money rapidly due to leverage. 59% of retail investor accounts lose money when trading CFDs with this provider . You should consider whether you understand how CFDs work and whether you can afford to take the high risk of losing your money.
Stratos Trading Pty. Limited (www.fxcm.com):
Trading FX/CFDs carries significant risks. FXCM AU (AFSL 309763). Please read the Financial Services Guide, Product Disclosure Statement, Target Market Determination and Terms of Business at www.fxcm.com
Stratos Global LLC (www.fxcm.com):
Losses can exceed deposits.
Any opinions, news, research, analyses, prices, other information, or links to third-party sites contained on this video are provided on an "as-is" basis, as general market commentary and do not constitute investment advice. The market commentary has not been prepared in accordance with legal requirements designed to promote the independence of investment research, and it is therefore not subject to any prohibition on dealing ahead of dissemination. Although this commentary is not produced by an independent source, FXCM takes all sufficient steps to eliminate or prevent any conflicts of interests arising out of the production and dissemination of this communication. The employees of FXCM commit to acting in the clients' best interests and represent their views without misleading, deceiving, or otherwise impairing the clients' ability to make informed investment decisions. For more information about the FXCM's internal organizational and administrative arrangements for the prevention of conflicts, please refer to the Firms' Managing Conflicts Policy. Please ensure that you read and understand our Full Disclaimer and Liability provision concerning the foregoing Information, which can be accessed via FXCM`s website:
Stratos Markets Limited clients please see: www.fxcm.com
Stratos Europe Ltd clients please see: www.fxcm.com
Stratos Trading Pty. Limited clients please see: www.fxcm.com
Stratos Global LLC clients please see: www.fxcm.com
Past Performance is not an indicator of future results.
How to analyse a chart? (Educational Post).In this post we will try to analyze what happened to Nifty and what can be the future course. We will also try to understand how to analyze Nifty using a parallel channel, EMA, Support and resistance and RSI. Through this exercise we will try to deduce possible turnaround supports, probable resistances it may face in future. On the onset let me tell you that the exercise is to increase the understanding of Technical analysis. The data should not be used for taking positions in the unpredictable market. Now have a look at the chart.
With the help of basic knowledge, you will be able to understand that every time the Nifty or for that matter any stock hits the top of the channel it reverts. Every time a stock or an index hits the channel bottom it tries to bounce back. When RSI shows the stock is over sold it corrects positively through short covering and when the stock is overbought zone it will try to cool down the RSI by price correcting on the negative side. The mid of the channel acts as support when the price is above it and acts as a resistance when price is below it.
Similarly 50 days and 200 days EMA which we call Mother and father line act as resistance when the price is below it and act as support when the price is above the lines. (This movement of stock price or index, when above and below 50 or 200 EMA whether it is hourly, daily, weekly or monthly and my Mother, Father and Small child theory I have explained it in depth in by book The Happy Candles Way to Wealth Creation). The other green and red lines are supports and resistances respectively. These lines drawn based on peaks and valleys, tops and bottoms of important candles in case of a candle chart. In case of a line chart they are tops and bottoms of peaks and valleys again and important curves.
Like we have supports and resistances on line chart of a stock and index, RSI also has support and resistnace zones which can also indicate us the turnaround zones. There in one more Purple line which indicates the current trend. Looking at these various factors you can analyses and draw your own charts.
To know more about these indicators and how to use them and to understand Techno-Funda investment, read my book: The Happy Candles Way to Wealth creation available on Amazon in Paperback or Kindle version.
My deduction from the above chart is the following. 24966 will be an important support for Nifty. Below which it can fall to 24698 or 24384 levels. Channel bottom support is around 23874. Father line and 200 days EMA is at 23241. Any of these can be potential turnaround zones. RSI of Nifty tends to bounce from 39.82 or 26.45 zone. Current RSI is 40.63. When there is a turnaround the resistances for Nifty will be 25065 which currently is Mother line resistance which is coinciding with mid channel resistance. Above this zone resistances will be 25439, 25665 and 25836 before Nifty regains 26K+ levels.
The information regarding Nifty in this article is for the purpose of education and to show how various indicators often give same or similar result.
To know more about various Techno-Funda indicators and how to use them, when to use them, when to buy, when to book profit, Where to place a stop loss or what is trailing stop loss etc. you are recommended to read my book: The Happy Candles Way to Wealth creation which is available on Amazon in paperback or kindle version. You can also read my Smart School column in Smart investment financial Weekly for gaining techno-Funda knowledge.
Disclaimer: There is a chance of biases including confirmation bias, information bias, halo effect and anchoring bias in this write-up. Investment in stocks, derivatives and mutual funds is subject to market risk please consult your investment advisor before taking financial decisions. The data, chart or any other information provided above is for the purpose of analysis and is purely educational in nature. They are not recommendations of any kind. We will not be responsible for Profit or loss due to descision taken based on this article. The names of the stocks or index levels mentioned if any in the article are for the purpose of education and analysis only. Purpose of this article is educational. Please do not consider this as a recommendation of any sorts.
4hr Bitcoin mean reversionIt looks like Bitcoin is doing a mean reversion on the 4 hour time frame at the moment. We dumped in the opening of the Asian session tonight. Liquidations are also seen above the current high that we could take out. Let's wait and see what the London and New York session brings and how price reacts. We should be watching closely for a break through the EMA50 on the 1 hour time frame to confirm a continuation of the trend.
USDCHF Reaffirms Bearish Bias after Timid SNB & US PCEThe Swiss National Bank was the first major institution to shift to monetary easing and remains at the forefront after its third consecutive rate cut this week. However, it stuck with the small 0.25% increments, which are meager compared to the Fed’s jumbo 0.5% pivot and aggressive easing path. Furthermore, with rates already at 1%, the SNB easing runway may not be very long. Today’s US inflation figures favor the Fed’s dovishness, as headline PCE decelerated to 2.2% and the lowest in more than three years. These dynamics weigh on the pair and reaffirm the bearish below the EMA200. This sustains risk for further losses below 0.8333 and levels not seen since at least 2015, although sustained weakness below it is hard.
Core PCE ticked up to 2.7% y/y and the Fed’s frontloading may fuel further persistence in price pressures and lead to fewer cuts later on. On the Swiss front, policymakers may not be able to avoid larger rate cuts. Inflation dropped to 1.1% in August and they expect further deceleration to 0.6% next year, while the elevated Franc harms exports and ads to the pressure for bigger policy moves and/or FX intervention. Despite the post-pandemic shift, the SNB has generally sought to keep the Swiss Franc from appreciating and has kept rates below zero for most of the past ten years.
As a result, we can see another effort surpass the EMA200 and pause the bearish bias. This would bring the 38.2% Fibonacci of the May-September slump into the spotlight, but we are cautious around the ascending prospects as the upside looks unfriendly.
Stratos Markets Limited (www.fxcm.com):
CFDs are complex instruments and come with a high risk of losing money rapidly due to leverage. 62% of retail investor accounts lose money when trading CFDs with this provider . You should consider whether you understand how CFDs work and whether you can afford to take the high risk of losing your money.
Stratos Europe Ltd (trading as “FXCM” or “FXCM EU”) (www.fxcm.com):
CFDs are complex instruments and come with a high risk of losing money rapidly due to leverage. 59% of retail investor accounts lose money when trading CFDs with this provider . You should consider whether you understand how CFDs work and whether you can afford to take the high risk of losing your money.
Stratos Trading Pty. Limited (www.fxcm.com):
Trading FX/CFDs carries significant risks. FXCM AU (AFSL 309763). Please read the Financial Services Guide, Product Disclosure Statement, Target Market Determination and Terms of Business at www.fxcm.com
Stratos Global LLC (www.fxcm.com):
Losses can exceed deposits.
Any opinions, news, research, analyses, prices, other information, or links to third-party sites contained on this video are provided on an "as-is" basis, as general market commentary and do not constitute investment advice. The market commentary has not been prepared in accordance with legal requirements designed to promote the independence of investment research, and it is therefore not subject to any prohibition on dealing ahead of dissemination. Although this commentary is not produced by an independent source, FXCM takes all sufficient steps to eliminate or prevent any conflicts of interests arising out of the production and dissemination of this communication. The employees of FXCM commit to acting in the clients' best interests and represent their views without misleading, deceiving, or otherwise impairing the clients' ability to make informed investment decisions. For more information about the FXCM's internal organizational and administrative arrangements for the prevention of conflicts, please refer to the Firms' Managing Conflicts Policy. Please ensure that you read and understand our Full Disclaimer and Liability provision concerning the foregoing Information, which can be accessed via FXCM`s website:
Stratos Markets Limited clients please see: www.fxcm.com
Stratos Europe Ltd clients please see: www.fxcm.com
Stratos Trading Pty. Limited clients please see: www.fxcm.com
Stratos Global LLC clients please see: www.fxcm.com
Past Performance is not an indicator of future results.
Copper Gets Double Boost from China Stimulus & Fed Jumbo CutThe Fed’s outsized pivot last week and guidance for multiple cuts ahead helped copper’s recovery, as it increases chances of a soft landing for the worlds largest economy. Furthermore, lower rates are expected to bring mortgages down and help the real estate market.
Copper got a second boost this week, from a massive monetary stimulus package from China - the world’s top consumer. Authorities have been enhancing their efforts to prop the sputtering economy recently and the new measures constitute a step up. Crucially, these include lower mortgage rates on existing home loans and a reduction in rates for second homes, in further support for the ailing property sector.
These developments lead copper towards a third straight profitable week and the best month since April, with bulls now getting the opportunity to tackle 4.700. Along with the return of AI euphoria that drives the rebound of the chip industry (where copper is a critical component), there are prospects for further gains.
On the other hand, the Fed’s frontloading creates risk for inflation persistence and less cuts in the future, while China’s actions are in the right direction, but bolder measures are needed on the fiscal front. Furthermore, the move looks stretched technically so a pullback towards the EMA200 (black line) would not be unreasonable. However, the downside appears well protected and sustained weakness below the EMA200 looks hard.
Stratos Markets Limited (www.fxcm.com):
CFDs are complex instruments and come with a high risk of losing money rapidly due to leverage. 62% of retail investor accounts lose money when trading CFDs with this provider . You should consider whether you understand how CFDs work and whether you can afford to take the high risk of losing your money.
Stratos Europe Ltd (trading as “FXCM” or “FXCM EU”) (www.fxcm.com):
CFDs are complex instruments and come with a high risk of losing money rapidly due to leverage. 59% of retail investor accounts lose money when trading CFDs with this provider . You should consider whether you understand how CFDs work and whether you can afford to take the high risk of losing your money.
Stratos Trading Pty. Limited (www.fxcm.com):
Trading FX/CFDs carries significant risks. FXCM AU (AFSL 309763). Please read the Financial Services Guide, Product Disclosure Statement, Target Market Determination and Terms of Business at www.fxcm.com
Stratos Global LLC (www.fxcm.com):
Losses can exceed deposits.
Any opinions, news, research, analyses, prices, other information, or links to third-party sites contained on this video are provided on an "as-is" basis, as general market commentary and do not constitute investment advice. The market commentary has not been prepared in accordance with legal requirements designed to promote the independence of investment research, and it is therefore not subject to any prohibition on dealing ahead of dissemination. Although this commentary is not produced by an independent source, FXCM takes all sufficient steps to eliminate or prevent any conflicts of interests arising out of the production and dissemination of this communication. The employees of FXCM commit to acting in the clients' best interests and represent their views without misleading, deceiving, or otherwise impairing the clients' ability to make informed investment decisions. For more information about the FXCM's internal organizational and administrative arrangements for the prevention of conflicts, please refer to the Firms' Managing Conflicts Policy. Please ensure that you read and understand our Full Disclaimer and Liability provision concerning the foregoing Information, which can be accessed via FXCM`s website:
Stratos Markets Limited clients please see: www.fxcm.com
Stratos Europe Ltd clients please see: www.fxcm.com
Stratos Trading Pty. Limited clients please see: www.fxcm.com
Stratos Global LLC clients please see: www.fxcm.com
Past Performance is not an indicator of future results.
Copper Supported by the Fed’s Jumbo CutAfter May’s record peak, copper prices slumped as demand optimism went away due to US and China economic fears, EV adoption slowdown and AI euphoria giving way to skepticism. However, copper staged a rebound, as China has been stepping up its effort to prop the economy, while AI optimism returned recently lifting tech and chip-making sectors. Furthermore US recession fears were quelled after the Fed slashed rates by a jumbo 0.5% last week and pointed to aggressive easing ahead, in what could be a boon for the property sectors where copper is used heavily.
These forces have helped the non-ferrous metal regain control above the EMA200, providing the launch pad for reclaiming the 4.500 handle. This would bring the summer high in the spotlight (4.700), although this level has a higher degree of difficulty.
On the other hand, the Fed’s frontloading creates risk of renewed inflation pressures that could lead to a shallower easing path, while China economic problems persist and the real estate sector remains in distress. Copper starts the current week on the back foot, unable to capitalize on its recent bounce. This sustains risk of sub-EMA200 moves that would pause the momentum, but the downside contains many buffers and prolonged weakness does not look easy, technically nor fundamentally.
Stratos Markets Limited (www.fxcm.com):
CFDs are complex instruments and come with a high risk of losing money rapidly due to leverage. 62% of retail investor accounts lose money when trading CFDs with this provider . You should consider whether you understand how CFDs work and whether you can afford to take the high risk of losing your money.
Stratos Europe Ltd (trading as “FXCM” or “FXCM EU”) (www.fxcm.com):
CFDs are complex instruments and come with a high risk of losing money rapidly due to leverage. 59% of retail investor accounts lose money when trading CFDs with this provider . You should consider whether you understand how CFDs work and whether you can afford to take the high risk of losing your money.
Stratos Trading Pty. Limited (www.fxcm.com):
Trading FX/CFDs carries significant risks. FXCM AU (AFSL 309763). Please read the Financial Services Guide, Product Disclosure Statement, Target Market Determination and Terms of Business at www.fxcm.com
Stratos Global LLC (www.fxcm.com):
Losses can exceed deposits.
Any opinions, news, research, analyses, prices, other information, or links to third-party sites contained on this video are provided on an "as-is" basis, as general market commentary and do not constitute investment advice. The market commentary has not been prepared in accordance with legal requirements designed to promote the independence of investment research, and it is therefore not subject to any prohibition on dealing ahead of dissemination. Although this commentary is not produced by an independent source, FXCM takes all sufficient steps to eliminate or prevent any conflicts of interests arising out of the production and dissemination of this communication. The employees of FXCM commit to acting in the clients' best interests and represent their views without misleading, deceiving, or otherwise impairing the clients' ability to make informed investment decisions. For more information about the FXCM's internal organizational and administrative arrangements for the prevention of conflicts, please refer to the Firms' Managing Conflicts Policy. Please ensure that you read and understand our Full Disclaimer and Liability provision concerning the foregoing Information, which can be accessed via FXCM`s website:
Stratos Markets Limited clients please see: www.fxcm.com
Stratos Europe Ltd clients please see: www.fxcm.com
Stratos Trading Pty. Limited clients please see: www.fxcm.com
Stratos Global LLC clients please see: www.fxcm.com
Past Performance is not an indicator of future results.
EMA, SMA and which one to choose? Educational PostArticle Written by Author of the book: The Happy Candles Way to wealth creation.
There is always a lot of debate while using chart whether to use EMA or SMA.
EMA = Exponential Moving Average.
SMA = Simple Moving Average.
In the below chart Black and Orange lines represent 50 and 200 EMA. Blue and the Lavender line represent the 50 and 200 SMA.
Simple Moving average is the actual average of the kind of SMA you are using that is 50 SMA is average of last fifty closings. Exponential moving average gives more importance to the recent price and less to the past prices in that order. For example, if you are calculating 50 EMA the weightage given to yesterday’s price is more than the weightage given to the price before 49 days. I personally use EMA for my charts when I want to take entry to some stocks. As I feel recent price influence the move of the candles more than past prices for future upward movement. At the same time for Profit booking I give more importance to SMA and 21 SMA in particular as I base my trailing stop losses based on monthly average.
To know more about EMAs and SMAs and importance of EMAs in particular you can read my book. The Happy Candles Way to wealth creation available in Paperback and Kindle version on Amazon where I have explained my Mother, Father and Small Child theory where I consider 50 EMA as mother line 200 EMA as father line and movement of a candle is compared to movement of a child playing in garden. In a very simple way I have tried to explain Techincal analysis related to stock price movement and their relation to EMAs.
Now whichever EMA or SMA you use. What I feel is you should remain consistent with it. Do not keep switching between the two. As you can see from the chart there is no major difference in position of both lines in the chart specially when the EMA or SMA is smaller in number. Moving averages are very helpful in determining the trend of the stock. Chances of its correction and support the stock price will get while falling down or resistance it might face if the price is below those lines.
EMAs and SMAs are excellent support when the stock price is above them and become fierce resistnace when the stock price is below these lines. Thus knowing where they are with respect to price is very important. My advice will be EMA or SMA should be part of your chart. Which one you use is a matter of choice. Staying consistent to the moving average you choose is important as Harivansh Rai Bachhan the famous Poet has said in his most famous poem Madhushala and I quote him, “Rah Pakad tu ek chala chal pa jayega Madhushala”. Meaning be consistent to your path and you will find your target.
Disclaimer: There is a chance of biases including confirmation bias, information bias, halo effect and anchoring bias in this write-up. Investment in stocks, derivatives and mutual funds is subject to market risk please consult your investment advisor before taking financial decisions. The data, chart or any other information provided above is for the purpose of analysis and is purely educational in nature. They are not recommendations of any kind. We will not be responsible for Profit or loss due to descision taken based on this article. The names of the stocks or index levels mentioned if any in the article are for the purpose of education and analysis only. Purpose of this article is educational. Please do not consider this as a recommendation of any sorts.
GBPUSD Sets 2+ Year Highs as the Fed Out-Cuts its UK PeerThe pair gains nearly 5% this year and the latest round of policy decisions by the Fed and the BoE, sent it the highest levels since the first quarter of 2022. The US Fed on Wednesday made its belated pivot with an outsized 0.5% reduction and pointed to another 50 bps worth of cuts by the end of the year. The Bank of England started lowering rates earlier than its US counterpart, with the 0.25% cut of August. Still wary over price pressures though, it has maintained a cautious stance around further easing. This apprehension was reaffirmed on Thursday, as policymakers stood pat on rates.
The Fed out-cut the BoE and is on track to deliver more reductions, setting up a favorable monetary policy differential for GBP/USD. Bulls now have the opportunity to push for the 1.3483 handle, but we are cautious at this time for further strength.
The Fed may have pointed to steep rate cut path as it tries to ensure a strong labor market and a soft landing, but may have a hard time implementing it, as it could put upward pressure to prices. On the other hand, despite the BoE’s trepidation, pressure could mount for faster pace and two more cuts are not unreasonable. Furthermore, the RSI moves towards overbought conditions, so we could see pressure. Daily closes below the EMA200 (black line) would be needed for the bullish bias to pause, but that is hard to justify under current monetary policy dynamics.
Stratos Markets Limited (www.fxcm.com):
CFDs are complex instruments and come with a high risk of losing money rapidly due to leverage. 62% of retail investor accounts lose money when trading CFDs with this provider . You should consider whether you understand how CFDs work and whether you can afford to take the high risk of losing your money.
Stratos Europe Ltd (trading as “FXCM” or “FXCM EU”) (www.fxcm.com):
CFDs are complex instruments and come with a high risk of losing money rapidly due to leverage. 59% of retail investor accounts lose money when trading CFDs with this provider . You should consider whether you understand how CFDs work and whether you can afford to take the high risk of losing your money.
Stratos Trading Pty. Limited (www.fxcm.com):
Trading FX/CFDs carries significant risks. FXCM AU (AFSL 309763). Please read the Financial Services Guide, Product Disclosure Statement, Target Market Determination and Terms of Business at www.fxcm.com
Stratos Global LLC (www.fxcm.com):
Losses can exceed deposits.
Any opinions, news, research, analyses, prices, other information, or links to third-party sites contained on this video are provided on an "as-is" basis, as general market commentary and do not constitute investment advice. The market commentary has not been prepared in accordance with legal requirements designed to promote the independence of investment research, and it is therefore not subject to any prohibition on dealing ahead of dissemination. Although this commentary is not produced by an independent source, FXCM takes all sufficient steps to eliminate or prevent any conflicts of interests arising out of the production and dissemination of this communication. The employees of FXCM commit to acting in the clients' best interests and represent their views without misleading, deceiving, or otherwise impairing the clients' ability to make informed investment decisions. For more information about the FXCM's internal organizational and administrative arrangements for the prevention of conflicts, please refer to the Firms' Managing Conflicts Policy. Please ensure that you read and understand our Full Disclaimer and Liability provision concerning the foregoing Information, which can be accessed via FXCM`s website:
Stratos Markets Limited clients please see: www.fxcm.com
Stratos Europe Ltd clients please see: www.fxcm.com
Stratos Trading Pty. Limited clients please see: www.fxcm.com
Stratos Global LLC clients please see: www.fxcm.com
Past Performance is not an indicator of future results.
FOMC 25bps vs 50bps??The day has arrived!! Today is predicted to be the first rate cut by the FED since the COVID crash of March 2020! Two years after that in March 2022 the FED begun rate hikes in an attempt to stop the rising inflation. Now that inflation is close to the FEDs target of 2% it's time to stimulate the economy with cheaper borrowing.
The big question is, 25bps or 50bps?
Last week we saw the ECB (European central bank) cut their interest rates by 60bps from 4.25% to 3.65%, although this news has somewhat gone unnoticed, I'm not so sure the FED would have ignored it. If Europe has considerably cheaper borrowing rates than the US it could signal more growth to come from Europe and that would not be ideal for the US.
Now this doesn't necessarily mean that Europe will be favoured by investors for long as this is only the beginning of rate cuts, Europe could taper off earlier or US could be more aggressive later on, we don't know for sure but I don't think America would want to fall behind.
Prediction markets have shown the 50bps cut is growing in probability. Now at 61% chance for 50bps according to FED funds futures (At time of writing). 25bps is definitely priced in, but I don't think 50bps is priced in. This should see risk markets get a boost.
In terms of TA, the 4H BTC chart looks ready to breakout, back above the 200EMA and 4H support. Flip the 4H resistance and $65,000 is the target.
Be carful today with leverage as volatility will be crazy, plenty of whipsawing and generally the first move direction is wrong. Stay safe out there.
EURGBP Bearish Bias Reaffirmed after UK CPI but BoE LoomsThe Bank of England lowered rates last month, for the first time in four years, joining major peers in their shift to less restrictive monetary settings. However, officials adopted a cautious and non-committal approach on further easing, as they remain wary of inflation which they expect to rise further this year. Today’s inflation report will likely strengthen the BoE’s apprehension, as CPI stayed above the 2% target, while core accelerated to 3.6% y/y in August.
EURGPB faces pushback as a result, at the critical resistance cluster provided by the EMA200 (black line) and the 23.6% Fibonacci of the August fall. Bearish bias is intact below that level, sustaining risk for further losses towards and beyond 0.8381. The monetary policy differential is unfavorable for the pair, as the ECB has already slashed rates twice this year and at least one more cut is expected this year.
The Bank of England will have a hard time moving again on Wednesday, but pressure for faster easing pace is likely to increase. Wage growth moderated substantially and this can allow greater tolerance for slower return of inflation to target, while the economy remains fragile, despite exiting its brief recession.
EUR/GBP has contained its fall in recent weeks and a break above the aforementioned resistance cluster would pause the bearish bias and provide the launching pad for taking out the 38.2% Fibonacci. Greater recovery however towards the 61.8% levels looks hard under current policy dynamics.
Stratos Markets Limited (www.fxcm.com):
CFDs are complex instruments and come with a high risk of losing money rapidly due to leverage. 6 2% of retail investor accounts lose money when trading CFDs with this provider . You should consider whether you understand how CFDs work and whether you can afford to take the high risk of losing your money.
Stratos Europe Ltd (trading as “FXCM” or “FXCM EU”) (www.fxcm.com):
CFDs are complex instruments and come with a high risk of losing money rapidly due to leverage. 59% of retail investor accounts lose money when trading CFDs with this provider . You should consider whether you understand how CFDs work and whether you can afford to take the high risk of losing your money.
Stratos Trading Pty. Limited (www.fxcm.com):
Trading FX/CFDs carries significant risks. FXCM AU (AFSL 309763). Please read the Financial Services Guide, Product Disclosure Statement, Target Market Determination and Terms of Business at www.fxcm.com
Stratos Global LLC (www.fxcm.com):
Losses can exceed deposits.
Any opinions, news, research, analyses, prices, other information, or links to third-party sites contained on this video are provided on an "as-is" basis, as general market commentary and do not constitute investment advice. The market commentary has not been prepared in accordance with legal requirements designed to promote the independence of investment research, and it is therefore not subject to any prohibition on dealing ahead of dissemination. Although this commentary is not produced by an independent source, FXCM takes all sufficient steps to eliminate or prevent any conflicts of interests arising out of the production and dissemination of this communication. The employees of FXCM commit to acting in the clients' best interests and represent their views without misleading, deceiving, or otherwise impairing the clients' ability to make informed investment decisions. For more information about the FXCM's internal organizational and administrative arrangements for the prevention of conflicts, please refer to the Firms' Managing Conflicts Policy. Please ensure that you read and understand our Full Disclaimer and Liability provision concerning the foregoing Information, which can be accessed via FXCM`s website:
Stratos Markets Limited clients please see: www.fxcm.com
Stratos Europe Ltd clients please see: www.fxcm.com
Stratos Trading Pty. Limited clients please see: www.fxcm.com
Stratos Global LLC clients please see: www.fxcm.com
Past Performance is not an indicator of future results.
JPN225 Correction Persists Ahead of the BoJThe Japanese index managed to swiftly rebound from the plunge caused by the central bank’s second rate hike and hawkish messaging at the end of July, as the market rout created some apprehension around the policy shift. Furthermore, the monetary setting remains accommodative and interests rates are still near-zero, while the stock market’s appeal goes beyond monetary policy and weak Yen.
JPN225 comes from a strong week, fueled largely by the upbeat messaging from Nvidia CEO Jensen Huang that spilled over to Japanese chip makers. Advantest and Tokyo Electron, two of Nikkei’s largest constituents, jumped more than 7%. As a result the index tries to regain the EMA200 that would allow it to exit its correction and challenge the August highs (39,204).
However, the index is cautious this week, as tech optimism wanes and markets await the BoJ’s decision, preceded by inflation update. Policymakers are unlikely to raise rates again, but communication around the path ahead will be crucial. Official have pointed to further tightening ahead and another hike this year is reasonable, as inflation is well above 2%, wages have increased and Q2 GDP posted strong growth. Furthermore, the monetary policy shift and the Yen’s rebound have led to outflows from foreigners over the past seven months.
JPN225 stays in correction and below the EMA200 the risk of bear market persists, although sustained below that threshold has a higher degree of difficulty.
Stratos Markets Limited (www.fxcm.com):
CFDs are complex instruments and come with a high risk of losing money rapidly due to leverage. 62% of retail investor accounts lose money when trading CFDs with this provider. You should consider whether you understand how CFDs work and whether you can afford to take the high risk of losing your money.
Stratos Europe Ltd (trading as “FXCM” or “FXCM EU”) (www.fxcm.com):
CFDs are complex instruments and come with a high risk of losing money rapidly due to leverage. 59% of retail investor accounts lose money when trading CFDs with this provider. You should consider whether you understand how CFDs work and whether you can afford to take the high risk of losing your money.
Stratos Trading Pty. Limited (www.fxcm.com):
Trading FX/CFDs carries significant risks. FXCM AU (AFSL 309763). Please read the Financial Services Guide, Product Disclosure Statement, Target Market Determination and Terms of Business at www.fxcm.com
Stratos Global LLC (www.fxcm.com):
Losses can exceed deposits.
Any opinions, news, research, analyses, prices, other information, or links to third-party sites contained on this video are provided on an "as-is" basis, as general market commentary and do not constitute investment advice. The market commentary has not been prepared in accordance with legal requirements designed to promote the independence of investment research, and it is therefore not subject to any prohibition on dealing ahead of dissemination. Although this commentary is not produced by an independent source, FXCM takes all sufficient steps to eliminate or prevent any conflicts of interests arising out of the production and dissemination of this communication. The employees of FXCM commit to acting in the clients' best interests and represent their views without misleading, deceiving, or otherwise impairing the clients' ability to make informed investment decisions. For more information about the FXCM's internal organizational and administrative arrangements for the prevention of conflicts, please refer to the Firms' Managing Conflicts Policy. Please ensure that you read and understand our Full Disclaimer and Liability provision concerning the foregoing Information, which can be accessed via FXCM`s website:
Stratos Markets Limited clients please see: www.fxcm.com
Stratos Europe Ltd clients please see: www.fxcm.com
Stratos Trading Pty. Limited clients please see: www.fxcm.com
Stratos Global LLC clients please see: www.fxcm.com
Past Performance is not an indicator of future results.
New Features For Dynamic Pivot Levels - Percentage indicatorIn our latest update, we’ve packed in some exciting new features and enhancements that will elevate your analysis experience to the next level:
Exciting New Features: We’ve added additional Exponential Moving Averages (EMAs), allowing you to track five different EMAs tailored to your needs. But that’s not all – we’ve introduced smiley indicators that give you instant feedback on whether the price is above or below the moving average. Now you can analyze with a clean, clutter-free chart!
Fibonacci Level Enhancements: We’ve upgraded the logic behind Fibonacci levels to give you more accurate insights. The improved Fibonacci calculations provide a clearer, more precise visual representation, helping you make better-informed decisions.
A Sleek, Streamlined User Interface: We know how important it is to work with a smart, efficient tool, so we’ve revamped the user interface! Settings are now neatly organized into categories, allowing you to quickly and easily customize everything you need. This makes your workflow smoother and faster.
This update doesn’t just bring new capabilities – it makes the tool more accessible and user-friendly than ever. It’s your key to staying focused on precision analysis, without the distractions!
4hr BITCOIN mean reversion rejection - Leave the rest for laterIn #Bitcoin's 4-hour chart scenario, we reject the EMA50 we are currently at and take the low at $56k in the next couple of days. We get a lot of economic data in the next few days until Friday, which could strengthen the US dollar and lead Bitcoin into a sell-off. Chart-wise, it looks like a rejection of the 4hr EMA50. The first target would be $56k and if things look really ugly, we should also consider $51k as a possible target.
Bitcoin bullish case for the weekI did this analysis yesterday. The case is the following. I expected this drop to the current levels of $62,000 to lead to a meanreversion to the EMA50 on the 4-hour time frame. In the bullish case, we hold the EMA50 and see higher prices. The targets for upside continuation would be $66k and $69k for this week.
USDJPY Vulnerable on Monetary Policy DynamicsThe pair is heading towards its second straight losing month, due to the shift in monetary policy dynamics, which could fuel further losses and new 2024 lows towards 140.26. Chair Powell offered the strongest signal to date of a September pivot, bolstering market optimism for multiple rate cuts ahead. The bank of Japan is on the opposite direction, trying to make policy less loose. Stepping up its effort, it raised rates for second time in this cycle and pointed to more moves, while Governor Ueda stack to script last week.
On the other hand, Mr Powell did not offer any insights around the size and pace of rate cuts, while market pricing for four moves this year is stretched. The BoJ’s latest rate hike meanwhile sparked volatility and forced the bank to pledge to not hike again while markets are unstable. Furthermore, the rate differential will still be wide even if the BoJ hikes again and the Fed cuts more than once.
As such, a recovery effort would not be surprising, but the EMA200 (black line) and the 38.2% Fibonacci of the recent slump can cap the upside. Sustained strength above this resistance confluence does not easy under the current policy dynamics.
Stratos Markets Limited (www.fxcm.com):
CFDs are complex instruments and come with a high risk of losing money rapidly due to leverage. 62% of retail investor accounts lose money when trading CFDs with this provider . You should consider whether you understand how CFDs work and whether you can afford to take the high risk of losing your money.
Stratos Europe Ltd (trading as “FXCM” or “FXCM EU”) (www.fxcm.com):
CFDs are complex instruments and come with a high risk of losing money rapidly due to leverage. 59% of retail investor accounts lose money when trading CFDs with this provider . You should consider whether you understand how CFDs work and whether you can afford to take the high risk of losing your money.
Stratos Trading Pty. Limited (www.fxcm.com):
Trading FX/CFDs carries significant risks. FXCM AU (AFSL 309763). Please read the Financial Services Guide, Product Disclosure Statement, Target Market Determination and Terms of Business at www.fxcm.com
Stratos Global LLC (www.fxcm.com):
Losses can exceed deposits.
Any opinions, news, research, analyses, prices, other information, or links to third-party sites contained on this video are provided on an "as-is" basis, as general market commentary and do not constitute investment advice. The market commentary has not been prepared in accordance with legal requirements designed to promote the independence of investment research, and it is therefore not subject to any prohibition on dealing ahead of dissemination. Although this commentary is not produced by an independent source, FXCM takes all sufficient steps to eliminate or prevent any conflicts of interests arising out of the production and dissemination of this communication. The employees of FXCM commit to acting in the clients' best interests and represent their views without misleading, deceiving, or otherwise impairing the clients' ability to make informed investment decisions. For more information about the FXCM's internal organizational and administrative arrangements for the prevention of conflicts, please refer to the Firms' Managing Conflicts Policy. Please ensure that you read and understand our Full Disclaimer and Liability provision concerning the foregoing Information, which can be accessed via FXCM`s website:
Stratos Markets Limited clients please see: www.fxcm.com
Stratos Europe Ltd clients please see: www.fxcm.com
Stratos Trading Pty. Limited clients please see: www.fxcm.com
Stratos Global LLC clients please see: www.fxcm.com
Past Performance is not an indicator of future results.
EURUSD Long - term outlookEURUSD Long - term outlook
This is a Daily chart for the EURUSD. With the most recent increase, EURUSD managed to break out to the up side of a massive Triangle that's been forming since January 2024
At this stage the price has produced an effective breakout as it has closed a few candles above the resistance line
There are 2 additional confluences that support a possible increase - The 20, 50 and 200 EMAs align to indicate a possible beginning on an up trend and the MACD is indicating Bullish continuation
The price can continue up targeting 1.11 and 1.125 in extension but this might as well be a false breakout and the price may reverse down again aiming at the 1.07 levels
The way that you can increase your chances for success are by looking at a smaller time frame