XLMBTC Low Volume Breakout Imminent Hello Traders!
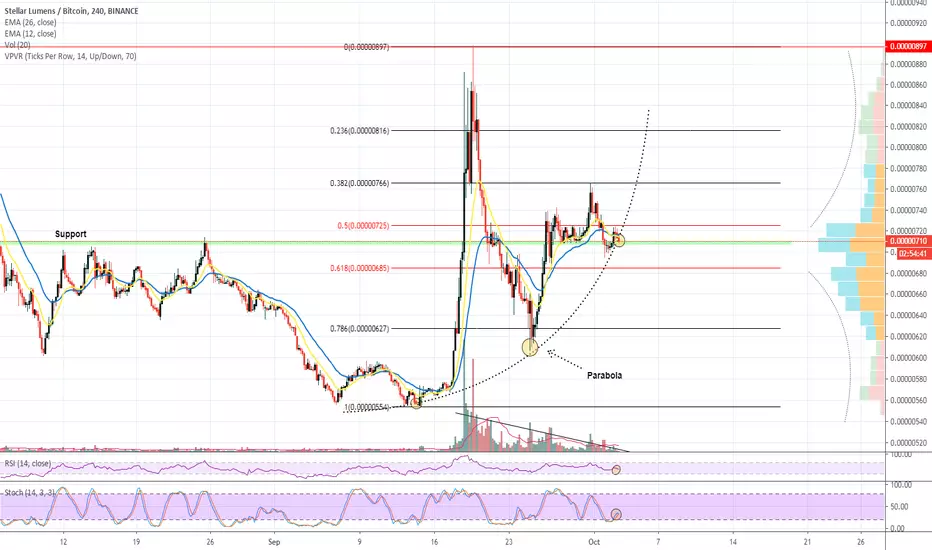
Today’s chart update will be on the XLM/BTC pairing which is in an interesting position, testing current local support with volume well below average, a break out move may be probable…
Points to consider,
- Trend bullish, probable of new higher low
- Price testing structural support
- .50 Fibonacci acting as resistance
- RSI neutral
- Stochastics showing upwards momentum
- VPVR showing decreasing transactions
- Volume decreasing rapidly
- EMA’s giving price resistance
XLM has had an insane bull move that corrected all the way down to the .786 Fibonacci level before retracing and trading in the now current rage. The trend is overall bullish as we do have consecutive higher lows in place; however this is in a parabolic manner.
Price is testing structural support, previous resistance; a break of this area will be quite bearish as market structure will then not be putting in a new higher high. Local resistance is at .50 Fibonacci level that needs to break upon respect of current support. If this level is broken then a test of the local highs will be more probable.
The RSI is quite neutral at current given time, it can break in any direction, really depends on the next move of XLM. The stochastics currently is projected upwards, we still have room for further upside potential.
The VPVR is interesting, showing us that the volume of transactions is decreasing on both ends, bullish and or bearish; the next move has a high degree of probability of being a flush move. Furthermore the volume itself is declining rapidly, telling us that a breakout is imminent in the near future.
The EMA’s are currently giving price resistance, is price fails to break the EMA’s then XLM will not put in a new higher high, the bullish market structure will no longer be in place…
What are your thoughts on XLM, is a breakout move imminent due to declining volume?
Please leave a like and comment
And remember,
“Hope is bogus emotion that only costs you money.” – Jim Cramer
EMAS
BTCUSD Critical Point | 200 MA | Oversold Bounce Hello Traders!
Hope you all had a great weekend,
Update on BTC recent developments on the daily chart , at a very critical point, trading below the 200 Moving Average, we need it to break and stay above this level to keep a bullish bias.
Points to consider,
- Daily trend bearish
- Price testing structural resistance
- Price below key moving average
- Stochastics in lower region
- RSI levels oversold
- .50 Fibonacci acting as resistance
- .618 Fibonacci is local support
- EMA’s both resistance
- Volume declining after climax
Bitcoin is trading at a very key region, right below the 200 moving average which is in confluence with structural resistance and the .50 Fibonacci level. The daily trend is considered to be bearish as we have not put in a higher high coming out of the bearish descending triangle .
The stochastics is well below in lower regions, flattening out; we need to see it show an upper projection. This can be in confluence with the RSI , being way oversold at current time; an oversold bounce may be probable to cool off both these indicators…
The Fibonacci levels are quite interesting, the .50 as mentioned before is now a key resistance level , and the 200 moving average coming over price at current given time makes this area of very strong resistance. The .618 Fibonacci level is considered as local support, price is more probable to quickly reach this region if the 200 moving average does not get broken…
Volume is declining after volume climax’s, this shows that a volatile move will be at play, we could see a Bart move back and over the 200 MA and or another flush down, to local support, the .618 Fibonacci level…
What are your thoughts?
Will BTC break this critical resistance level or flush down to local support?
IMO it’s pretty risky at current given time, we don’t have a clear direction however, few indicators are over extended, thus a oversold bounce would be more probable…
Please leave a like and comment,
And remember
“A lot of people get so enmeshed in the markets that they lose their perspective. Working longer does not necessarily equate with working smarter. In fact, sometimes is the other way around.” – Martin Schwartz


GOLD RushAs we see that Gold finally breaks it’s consolidation phase since 2014, we believe the bullish movement will continues, whether there will be a consolidation or not, what we see is the potential upside still interesting. Our internal target is 1650 with 1580 as a minor trend. If you own gold and thinking to profit taking, we suggest to postpone.
#galerisaham | Global Market

GOLD is a LONG for me!!This is my analysis on GOLD. you can see it rejected my trend line and on the weekly chart its now trying to retest the trend line and might go for a long. Too much possibilities in the uncertain market. But I am going for long.
DON'T FOLLOW THE CROWD!

xtzusd - not looking goodBearish on xtzusd. Building a bearish wedge / flag.
All emas acting as resistances. Don't believe this one will come back any time soon.

Don't get long before we break 294Seeing the congestions on heavy volume the last days, 283/284 confirms as a major support level.
With the futures gapping a second day 1% , it seems very bullish for the SPY, HOWEVER...
The 22 EMA is starting to show sideways movement , thus creating our situation not a trend, but a range
with large overhead resistance at 294. A profitable play would be, if we see heavy resistnace + a low volume breakout at 294 to short and play for the range. If we break 294 on heavy volume and without much congestion there - start looking for longs until we get to 300 again.

Bitcoin Short Targets - Long EntriesThis is my opinion on where I feel we need to test next on the macro time frame. I expect a strong bullish bounce in the 1st green box which is the 21 weekly ema , and also a very nice fib retracement zone.
If we lose the first bounce zone in the mid to high 8ks I would expect to test the 55ema next in the mid 7ks.. If for some reason that loses support too the 5k's is the last zone I would still consider it bullish on the long term scale still. I would then expect to find a price below 3k. For now my opinion is we bounce at that 1st target in the 8ks at the 21 weekly EMA and attempt to go higher than 14k, this will be determine fairly quickly as the proper bounce will have a lot of momentum.. if the momentum is not there, no reason to expect higher than 14k.
This is NOT financial advice. Trading and Investing are risky, these are only opinions and nothing more.

Gold isn't done yet imoThis week i've made 20% on gold buying 30EMA hits followed by engulfing candles. Yes its easy to make money in trends if its just keeps on rising however i also made money selling a few smaller time frame double tops. I think the bullish move will continue after forming a flag or if that breaks lower, when price reaches the 30 or 50 EMA on the 4hr chart and has a good rejection.

GBPAUD Is About to TANK!Why I took the sell?
In a down trend
pound has been weak
Large engulfing candle that broke below all EMAs
Pullback that rejected emas as resistance.
Double top "M Formation" at the yellow ema
Pending order set.
I think I can get at least 40 pips out of it. Taking Partial profits at 40 and letting the rest ride for a while.


Gold Starting Bullish AgainGood morning traders... As you see on the chart H4 above, this commodity will be rise again, invalidation if the last low price break...

Gold Projection Bearish ContinueAs you see on the chart H4 above, this pair still inside on the downtrend channel and will be complete the bearish impuls waves...

QEMA - Daily Chart EMAs This is for convenience when switching based on candle sticks, hence the Daily (candle) Chart.
I thought having a DAILY CHART set EMA's to enable or disable makes it convenient and why i placed the appropriate title and EMA's
I selected 8, 21, 55, 100, 200 as the standard for the EMA's.
Reason: Based on a well known trader preferred settings.


Last Week Setup Chart Gold Very AmazingAs you see on the chart H4 above, i have two big profits on last three days with amazing wave 3, this pair still bearish projection, but will be rebound for a moment...

Waiting For Break Out Triangle GoldAs you see on the chart above, this commodity will be break, down or up, wait and see...

Small Retracement for S&P500Lets keep it simple, The price is in the top of the ascending channel and waiting for the retracement to the 2830.00 zone and fill the last gap before the price continue the overall bias. Any sell in the 2873.00 zone is given to us a good risk reward ratio, if the price break above we can expect a bullish momentum looking for All Time HIghs.

-------------------4HR CHANNEL/ PPL SET-UP--------------------Additional lower timeframe confluences:
1) 30 min FIB retracement and notice any respect or rejection to key 61.8 level
2) 15 and 5min 14 and 50 Ema in your favour, or wait for a dynamic support/ resistance
3) 5min rejecting a PPL and RSI strength in your favour bounce off 30 or 70 level
4) At a point of lower time frame break/ push there will also normally be a 5min 14 EMA retest the same time as a minor correction
and good entry point if everything above lines up

USDJPY Short Set upWeekly level respected
We have Emas crosing
Consolitading after a long bull run
Big rejection wick
Double Top forming
I think that if the price breaks the current trendline we should see the price falling till the next marked zone at least
