Bulls and Bears Zone for 02-10-2023We had two days in a row where market fell after trading in a range for few days prior.
Any test of yesterday's Low could provide direction for the day.
Level to watch 4064 --- 4062
Report to watch :
US:Consumer Sentiment
10:00 AM ET
Emini

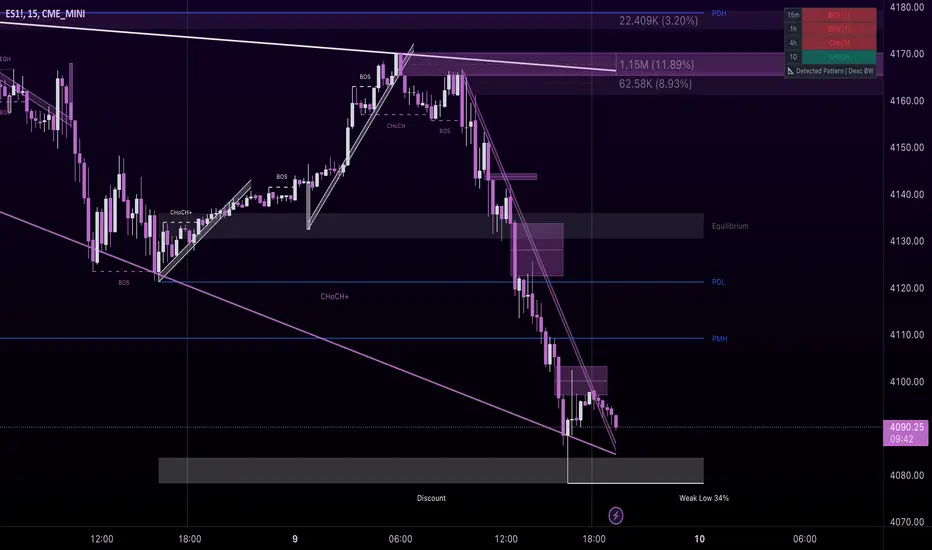
ES S&P e-mini futures, a breatherCME_MINI:ES1! After the whiplash from the after effects of Fed Chairman, the e-mini S&P futures take a little breather...What will the markets bring during the earning releases....
SPX Model Trading Plans for THU. 02/09Consolidation Ahead? Day 4
The surge from post-FOMC last week could be consolidating a bit in the near term, unless some unexpectedly bullish macro developments take place. The risk is still for an upside spike than for a downside draft while the index is above 4100 on a daily close basis.
Positional Trading Models: Our positional models are flat for now. Models indicate going short on a daily close below 4100, with a take-profit on a cross above 4065, and a trailing stop of 33 points. Models also indicate going long on a daily close above 4180 with a trailing stop of 35 points.
By definition, positional trading models may carry the positions overnight and over multiple days, and hence assume trading an instrument that trades beyond the regular session, with the trailing stops - if any - being active in the overnight session.
Intraday/Aggressive Models: Our aggressive, intraday models indicate the trading plans below for today.
Trading Plans for THU. 02/09:
Aggressive Intraday Models: For today, our aggressive intraday models indicate going long on a break above 4167, 4152, 4127, or 4103 with a 9-point trailing stop, and going short on a break below 4163, 4147, 4123, or 4097 with a 9-point trailing stop.
Models indicate no explicit long exits and short exits on a break above 4116 for today. Models also indicate a break-even hard stop once a trade gets into a 4-point profit level. Models indicate taking these signals from 09:46am ET or later.
By definition the intraday models do not hold any positions overnight - the models exit any open position at the close of the last bar (3:59pm bar or 4:00pm bar, depending on your platform's bar timing convention).
To avoid getting whipsawed, use at least a 5-minute closing or a higher time frame (a 1-minute if you know what you are doing) - depending on your risk tolerance and trading style - to determine the signals.
(WHAT IS THE CREDIBILITY and the PERFORMANCE OF OUR MODEL TRADING PLANS over the LAST WEEK, LAST MONTH, LAST YEAR? Please check for yourself how our pre-published model trades have performed so far! Seeing is believing!)
NOTES - HOW TO INTERPRET/USE THESE TRADING PLANS:
(i) The trading levels identified are derived from our A.I. Powered Quant Models. Depending on the market conditions, these may or may not correspond to any specific indicator(s).
(ii) These trading plans may be used to trade in any instrument that tracks the S&P 500 Index (e.g., ETFs such as SPY, derivatives such as futures and options on futures, and SPX options), triggered by the price levels in the Index. The results of these indicated trades would vary widely depending on the timeframe you use (tick chart, 1 minute, or 5 minute, or 15 minute or 60 minute etc.), the quality of your broker's execution, any slippages, your trading commissions and many other factors.
(iii) These are NOT trading recommendations for any individual(s) and may or may not be suitable to your own financial objectives and risk tolerance - USE these ONLY as educational tools to inform and educate your own trading decisions, at your own risk.
#spx #spx500 #spy #sp500 #esmini #indextrading #daytrading #models #tradingplans #outlook #economy #bear #yields #fomc #fed #newhigh #stocks #futures #inflation #powell #interestrates #earnings #earningsseason #chinareopen

SPX Model Trading Plans for WED. 02/08Consolidation Ahead? Day 3
The surge from post-FOMC last week could be consolidating a bit in the near term, unless some unexpectedly bullish macro developments take place. If you are long, could be time to take some money off the table, and if you are short/wanting to go short then you might want to dip your toes but want to wait for a confirmation before stepping in more. The risk is still for an upside spike than for a downside draft while the index is above 4100 on a daily close basis.
Positional Trading Models: Our positional models are flat for now. Models indicate going short on a daily close below 4100, with a take-profit on a cross above 4065, and a trailing stop of 33 points.
By definition, positional trading models may carry the positions overnight and over multiple days, and hence assume trading an instrument that trades beyond the regular session, with the trailing stops - if any - being active in the overnight session.
Intraday/Aggressive Models: Our aggressive, intraday models indicate the trading plans below for today.
Trading Plans for WED. 02/08:
Aggressive Intraday Models: For today, our aggressive intraday models indicate going long on a break above 4167, 4152, or 4102 with a 9-point trailing stop, and going short on a break below 4163, 4145, 4113, or 4097 with a 9-point trailing stop.
Models indicate no explicit long exits and short exits on a break above 4116 for today. Models also indicate a break-even hard stop once a trade gets into a 4-point profit level. Models indicate taking these signals from 10:16am ET or later.
By definition the intraday models do not hold any positions overnight - the models exit any open position at the close of the last bar (3:59pm bar or 4:00pm bar, depending on your platform's bar timing convention).
To avoid getting whipsawed, use at least a 5-minute closing or a higher time frame (a 1-minute if you know what you are doing) - depending on your risk tolerance and trading style - to determine the signals.
(WHAT IS THE CREDIBILITY and the PERFORMANCE OF OUR MODEL TRADING PLANS over the LAST WEEK, LAST MONTH, LAST YEAR? Please check for yourself how our pre-published model trades have performed so far! Seeing is believing!)
NOTES - HOW TO INTERPRET/USE THESE TRADING PLANS:
(i) The trading levels identified are derived from our A.I. Powered Quant Models. Depending on the market conditions, these may or may not correspond to any specific indicator(s).
(ii) These trading plans may be used to trade in any instrument that tracks the S&P 500 Index (e.g., ETFs such as SPY, derivatives such as futures and options on futures, and SPX options), triggered by the price levels in the Index. The results of these indicated trades would vary widely depending on the timeframe you use (tick chart, 1 minute, or 5 minute, or 15 minute or 60 minute etc.), the quality of your broker's execution, any slippages, your trading commissions and many other factors.
(iii) These are NOT trading recommendations for any individual(s) and may or may not be suitable to your own financial objectives and risk tolerance - USE these ONLY as educational tools to inform and educate your own trading decisions, at your own risk.
#spx #spx500 #spy #sp500 #esmini #indextrading #daytrading #models #tradingplans #outlook #economy #bear #yields #fomc #fed #newhigh #stocks #futures #inflation #powell #interestrates #earnings #earningsseason #chinareopen

three ideas for nasdaq continuationaccording to this flow analysis there are a few different ways bull nasdaq front month futures could continue

SPX Model Trading Plans for TUE. 02/07Consolidation Ahead? Day 2
The surge from post-FOMC last week could be consolidating a bit in the near term, unless some unexpectedly bullish macro developments take place. If you are long, could be time to take some money off the table, and if you are short/wanting to go short then you might want to dip your toes but want to wait for a confirmation before stepping in more. The risk is still for an upside spike than for a downside draft while the index is above 4100 on a daily close basis.
Positional Trading Models: Our positional models are flat for now. Models indicate going short on a daily close below 4100, with a take-profit on a cross above 4065, and a trailing stop of 33 points.
By definition, positional trading models may carry the positions overnight and over multiple days, and hence assume trading an instrument that trades beyond the regular session, with the trailing stops - if any - being active in the overnight session.
Intraday/Aggressive Models: Our aggressive, intraday models indicate the trading plans below for today.
Trading Plans for TUE. 02/07:
Aggressive Intraday Models: For today, our aggressive intraday models indicate going long on a break above 4123 or 4096 with a 9-point trailing stop, and going short on a break below 4119, 4092, or 4068 with a 10-point trailing stop.
Models indicate no explicit long exits and short exits on a break above 4073 for today. Models also indicate a break-even hard stop once a trade gets into a 4-point profit level. Models indicate taking these signals from 10:35am ET or later.
By definition the intraday models do not hold any positions overnight - the models exit any open position at the close of the last bar (3:59pm bar or 4:00pm bar, depending on your platform's bar timing convention).
To avoid getting whipsawed, use at least a 5-minute closing or a higher time frame (a 1-minute if you know what you are doing) - depending on your risk tolerance and trading style - to determine the signals.
(WHAT IS THE CREDIBILITY and the PERFORMANCE OF OUR MODEL TRADING PLANS over the LAST WEEK, LAST MONTH, LAST YEAR? Please check for yourself how our pre-published model trades have performed so far! Seeing is believing!)
NOTES - HOW TO INTERPRET/USE THESE TRADING PLANS:
(i) The trading levels identified are derived from our A.I. Powered Quant Models. Depending on the market conditions, these may or may not correspond to any specific indicator(s).
(ii) These trading plans may be used to trade in any instrument that tracks the S&P 500 Index (e.g., ETFs such as SPY, derivatives such as futures and options on futures, and SPX options), triggered by the price levels in the Index. The results of these indicated trades would vary widely depending on the timeframe you use (tick chart, 1 minute, or 5 minute, or 15 minute or 60 minute etc.), the quality of your broker's execution, any slippages, your trading commissions and many other factors.
(iii) These are NOT trading recommendations for any individual(s) and may or may not be suitable to your own financial objectives and risk tolerance - USE these ONLY as educational tools to inform and educate your own trading decisions, at your own risk.
#spx #spx500 #spy #sp500 #esmini #indextrading #daytrading #models #tradingplans #outlook #economy #bear #yields #fomc #fed #newhigh #stocks #futures #inflation #powell #interestrates #earnings #earningsseason #chinareopen

SPX Model Trading Plans for MON. 02/06Consolidation Ahead?
The surge after the FOMC Wednesday and the NFP Friday last week could be consolidating a bit in the near term, unless some unexpectedly bullish macro developments take place. If you are long, could be time to take some money off the table, and if you are short/wanting to go short then you might want to dip your toes but want to wait for a confirmation before stepping in more. The risk is still for an upside spike than for a downside draft while the index is above 4100 on a daily close basis.
Positional Trading Models: Our positional models are flat for now. Models indicate going short on a cross below 4100, with a take-profit on a cross above 4055, and with a trailing stop of 33 points.
By definition, positional trading models may carry the positions overnight and over multiple days, and hence assume trading an instrument that trades beyond the regular session, with the trailing stops - if any - being active in the overnight session.
Intraday/Aggressive Models: Our aggressive, intraday models indicate the trading plans below for today.
Trading Plans for MON. 02/06:
Aggressive Intraday Models: For today, our aggressive intraday models indicate going long on a break above 4120 or 4103 with a 9-point trailing stop, and going short on a break below 4117, 4100, or 4080 with a 9-point trailing stop.
Models indicate no explicit long exits and short exits on a break above 4086 for today. Models also indicate a break-even hard stop once a trade gets into a 4-point profit level. Models indicate taking these signals from 11:16am ET or later.
By definition the intraday models do not hold any positions overnight - the models exit any open position at the close of the last bar (3:59pm bar or 4:00pm bar, depending on your platform's bar timing convention).
To avoid getting whipsawed, use at least a 5-minute closing or a higher time frame (a 1-minute if you know what you are doing) - depending on your risk tolerance and trading style - to determine the signals.
(WHAT IS THE CREDIBILITY and the PERFORMANCE OF OUR MODEL TRADING PLANS over the LAST WEEK, LAST MONTH, LAST YEAR? Please check for yourself how our pre-published model trades have performed so far! Seeing is believing!)
NOTES - HOW TO INTERPRET/USE THESE TRADING PLANS:
(i) The trading levels identified are derived from our A.I. Powered Quant Models. Depending on the market conditions, these may or may not correspond to any specific indicator(s).
(ii) These trading plans may be used to trade in any instrument that tracks the S&P 500 Index (e.g., ETFs such as SPY, derivatives such as futures and options on futures, and SPX options), triggered by the price levels in the Index. The results of these indicated trades would vary widely depending on the timeframe you use (tick chart, 1 minute, or 5 minute, or 15 minute or 60 minute etc.), the quality of your broker's execution, any slippages, your trading commissions and many other factors.
(iii) These are NOT trading recommendations for any individual(s) and may or may not be suitable to your own financial objectives and risk tolerance - USE these ONLY as educational tools to inform and educate your own trading decisions, at your own risk.
#spx #spx500 #spy #sp500 #esmini #indextrading #daytrading #models #tradingplans #outlook #economy #bear #yields #fomc #fed #newhigh #stocks #futures #inflation #powell #interestrates #earnings #earningsseason #chinareopen

Upper and Lower Fair Value Gaps; immediate levels based on FibsFVGs from Previous week labeled includes 15min and smaller time frame gaps within. Opening prices for ES in green. Fib levels from swing points.

im into thisthe fib says it all
fib to fib
fib to high, or fib low equal
lets have the real data
bull

im really not worriedwere down a little more than .5% after this jobs report, and im looking at it as a non event mostly. its not the feds job to make wages go up or unemployment down. they are a lender and a monetary policy monitor/executive. i dont believe were still flying high the way we have been, were overdue for a pullback, but im still bullish treating this resistance as pivot. if we stay above it im looking higher, and looking to buy on dips if we sink more.

SPX Model Trading Plans for THU. 02/02Soft Landing, Big Tech Earnings...Goldilocks Dreams?
The surge after the rather dovish Powell in the post-FOMC press conference, followed by the earnings from Meta...feeding the bullish spike in the markets, with investors potentially getting drunk on the dreams of Goldilocks scenario going forward. Until something harsh wakes them up to a different reality, this could become the self fulfilling prophecy for the near future.
Positional Trading Models: Our positional models are flat for now. Models indicate going short on a cross below 4100, with a take-profit on a cross above 4055, and with a trailing stop of 33 points.
By definition, positional trading models may carry the positions overnight and over multiple days, and hence assume trading an instrument that trades beyond the regular session, with the trailing stops - if any - being active in the overnight session.
Intraday/Aggressive Models: Our aggressive, intraday models indicate the trading plans below for today.
Trading Plans for THU. 02/02:
Aggressive Intraday Models: For today, our aggressive intraday models indicate going long on a break above 4203, 4149, 4120, or 4103 with a 9-point trailing stop, and going short on a break below 4197, 4145, 4117, or 4100 with a 9-point trailing stop.
Models indicate no explicit long exits and no explicit short exits for today. Models also indicate a break-even hard stop once a trade gets into a 4-point profit level. Models indicate taking these signals from 09:46am ET or later.
By definition the intraday models do not hold any positions overnight - the models exit any open position at the close of the last bar (3:59pm bar or 4:00pm bar, depending on your platform's bar timing convention).
To avoid getting whipsawed, use at least a 5-minute closing or a higher time frame (a 1-minute if you know what you are doing) - depending on your risk tolerance and trading style - to determine the signals.
(WHAT IS THE CREDIBILITY and the PERFORMANCE OF OUR MODEL TRADING PLANS over the LAST WEEK, LAST MONTH, LAST YEAR? Please check for yourself how our pre-published model trades have performed so far! Seeing is believing!)
NOTES - HOW TO INTERPRET/USE THESE TRADING PLANS:
(i) The trading levels identified are derived from our A.I. Powered Quant Models. Depending on the market conditions, these may or may not correspond to any specific indicator(s).
(ii) These trading plans may be used to trade in any instrument that tracks the S&P 500 Index (e.g., ETFs such as SPY, derivatives such as futures and options on futures, and SPX options), triggered by the price levels in the Index. The results of these indicated trades would vary widely depending on the timeframe you use (tick chart, 1 minute, or 5 minute, or 15 minute or 60 minute etc.), the quality of your broker's execution, any slippages, your trading commissions and many other factors.
(iii) These are NOT trading recommendations for any individual(s) and may or may not be suitable to your own financial objectives and risk tolerance - USE these ONLY as educational tools to inform and educate your own trading decisions, at your own risk.
#spx #spx500 #spy #sp500 #esmini #indextrading #daytrading #models #tradingplans #outlook #economy #bear #yields #fomc #fed #newhigh #stocks #futures #inflation #powell #interestrates #earnings #earningsseason #chinareopen

Bulls and Bears zone for 02-02-2023Yesterday's rally after FOMC statement needs to see follow through; otherwise traders could take profit today.
Most one day big rallies occur during Bear markets.
Level to watch: 4175 --- 4173
Reports to watch:
US:Factory Orders
10:00 AM ET
US: EIA Natural Gas Report
10:30 AM ET

Nasdaq 12600 Target Hit, What Next?In this update we review the recent price action in the emini Nasdaq futures contract and identify the next high probability trading opportunities and price objectives to target

SPX Model Trading Plans for WED. 02/01The FOMC Decision Day!
No surprises in the rate decision just crossing the wires. Of course, the devil would be in the details, to be garnered from the press conference starting at 2:30pm. Nevertheless, our models are already indicating potential trading levels as below.
Positional Trading Models: Our positional models are flat for now. Models indicate going short on a cross below 4039, with a take-profit on a cross above 4002, and with a trailing stop of 33 points.
By definition, positional trading models may carry the positions overnight and over multiple days, and hence assume trading an instrument that trades beyond the regular session, with the trailing stops - if any - being active in the overnight session.
Intraday/Aggressive Models: Our aggressive, intraday models indicate the trading plans below for today.
Trading Plans for WED. 02/01:
Aggressive Intraday Models: For today, our aggressive intraday models indicate going long on a break above 4096, 4073, 4044, or 4017 with a 9-point trailing stop, and going short on a break below 4068, 4039, or 4014 with a 9-point trailing stop.
Models indicate explicit long exit on a break below 4093, and no explicit short exits for today. Models also indicate a break-even hard stop once a trade gets into a 4-point profit level. Models indicate taking these signals from 02:16pm ET or later.
By definition the intraday models do not hold any positions overnight - the models exit any open position at the close of the last bar (3:59pm bar or 4:00pm bar, depending on your platform's bar timing convention).
To avoid getting whipsawed, use at least a 5-minute closing or a higher time frame (a 1-minute if you know what you are doing) - depending on your risk tolerance and trading style - to determine the signals.
(WHAT IS THE CREDIBILITY and the PERFORMANCE OF OUR MODEL TRADING PLANS over the LAST WEEK, LAST MONTH, LAST YEAR? Please check for yourself how our pre-published model trades have performed so far! Seeing is believing!)
NOTES - HOW TO INTERPRET/USE THESE TRADING PLANS:
(i) The trading levels identified are derived from our A.I. Powered Quant Models. Depending on the market conditions, these may or may not correspond to any specific indicator(s).
(ii) These trading plans may be used to trade in any instrument that tracks the S&P 500 Index (e.g., ETFs such as SPY, derivatives such as futures and options on futures, and SPX options), triggered by the price levels in the Index. The results of these indicated trades would vary widely depending on the timeframe you use (tick chart, 1 minute, or 5 minute, or 15 minute or 60 minute etc.), the quality of your broker's execution, any slippages, your trading commissions and many other factors.
(iii) These are NOT trading recommendations for any individual(s) and may or may not be suitable to your own financial objectives and risk tolerance - USE these ONLY as educational tools to inform and educate your own trading decisions, at your own risk.
#spx #spx500 #spy #sp500 #esmini #indextrading #daytrading #models #tradingplans #outlook #economy #bear #yields #fomc #fed #newhigh #stocks #futures #inflation #powell #interestrates #earnings #earningsseason #chinareopen


SPX Model Trading Plans for TUE. 01/31The FOMC Decision Week - Day 2
With the FOMC Interest rate decision due this Wednesday, the markets may re-remember the interest rates factor. Whether the Fed's decision and the tone surprises the markets in either direction is going to determine if there would be a reversal or continuation of the recent melt-up in the markets. But, until that happens, the momentum seems to be consolidating.
Positional Trading Models: Our positional models went short at the close yesterday, at 4017.77 with a trailing stop of 35 points. For today, the models indicate placing a hard stop at 4053, and tightening the trailing stop to 20 points at the close.
By definition, positional trading models may carry the positions overnight and over multiple days, and hence assume trading an instrument that trades beyond the regular session, with the trailing stops - if any - being active in the overnight session.
Intraday/Aggressive Models: Our aggressive, intraday models indicate the trading plans below for today.
Trading Plans for TUE. 01/31:
Aggressive Intraday Models: For today, our aggressive intraday models indicate going long on a break above 4044, 4030, or 4017 with a 9-point trailing stop, and going short on a break below 4039, 4025, or 4014 with a 9-point trailing stop.
Models indicate no explicit long exits and no explicit short exits for today. Models also indicate a break-even hard stop once a trade gets into a 4-point profit level. Models indicate taking these signals from 11:01am ET or later.
By definition the intraday models do not hold any positions overnight - the models exit any open position at the close of the last bar (3:59pm bar or 4:00pm bar, depending on your platform's bar timing convention).
To avoid getting whipsawed, use at least a 5-minute closing or a higher time frame (a 1-minute if you know what you are doing) - depending on your risk tolerance and trading style - to determine the signals.
(WHAT IS THE CREDIBILITY and the PERFORMANCE OF OUR MODEL TRADING PLANS over the LAST WEEK, LAST MONTH, LAST YEAR? Please check for yourself how our pre-published model trades have performed so far! Seeing is believing!)
NOTES - HOW TO INTERPRET/USE THESE TRADING PLANS:
(i) The trading levels identified are derived from our A.I. Powered Quant Models. Depending on the market conditions, these may or may not correspond to any specific indicator(s).
(ii) These trading plans may be used to trade in any instrument that tracks the S&P 500 Index (e.g., ETFs such as SPY, derivatives such as futures and options on futures, and SPX options), triggered by the price levels in the Index. The results of these indicated trades would vary widely depending on the timeframe you use (tick chart, 1 minute, or 5 minute, or 15 minute or 60 minute etc.), the quality of your broker's execution, any slippages, your trading commissions and many other factors.
(iii) These are NOT trading recommendations for any individual(s) and may or may not be suitable to your own financial objectives and risk tolerance - USE these ONLY as educational tools to inform and educate your own trading decisions, at your own risk.
#spx #spx500 #spy #sp500 #esmini #indextrading #daytrading #models #tradingplans #outlook #economy #bear #yields #fomc #fed #newhigh #stocks #futures #inflation #powell #interestrates #earnings #earningsseason #chinareopen

SPX Model Trading Plans for MON. 01/30The FOMC Decision Week - Day 1
With the FOMC Interest rate decision due this Wednesday, the markets may re-remember the interest rates factor. Whether the Fed's decision and the tone surprises the markets in either direction is going to determine if there would be a reversal or continuation of the recent melt-up in the markets. But, until that happens, the momentum seems to be consolidating.
Positional Trading Models: Our positional models currently are in a neutral bias. Models indicate going short on the close if the daily close is below 4040, with a 35 point trailing stop and a 9-point trailing stop to trigger once the short touches 4020.
By definition, positional trading models may carry the positions overnight and over multiple days, and hence assume trading an instrument that trades beyond the regular session, with the trailing stops - if any - being active in the overnight session.
Intraday/Aggressive Models: Our aggressive, intraday models indicate the trading plans below for today.
Trading Plans for MON. 01/30:
Aggressive Intraday Models: For today, our aggressive intraday models indicate going long on a break above 4051, 4044, or 4017 with a 9-point trailing stop, and going short on a break below 4048, 4039, or 4014 with a 9-point trailing stop.
Models indicate no explicit long exits and no explicit short exits for today. Models also indicate a break-even hard stop once a trade gets into a 4-point profit level. Models indicate taking these signals from 12:01 pm ET or later.
By definition the intraday models do not hold any positions overnight - the models exit any open position at the close of the last bar (3:59pm bar or 4:00pm bar, depending on your platform's bar timing convention).
To avoid getting whipsawed, use at least a 5-minute closing or a higher time frame (a 1-minute if you know what you are doing) - depending on your risk tolerance and trading style - to determine the signals.
(WHAT IS THE CREDIBILITY and the PERFORMANCE OF OUR MODEL TRADING PLANS over the LAST WEEK, LAST MONTH, LAST YEAR? Please check for yourself how our pre-published model trades have performed so far! Seeing is believing!)
NOTES - HOW TO INTERPRET/USE THESE TRADING PLANS:
(i) The trading levels identified are derived from our A.I. Powered Quant Models. Depending on the market conditions, these may or may not correspond to any specific indicator(s).
(ii) These trading plans may be used to trade in any instrument that tracks the S&P 500 Index (e.g., ETFs such as SPY, derivatives such as futures and options on futures, and SPX options), triggered by the price levels in the Index. The results of these indicated trades would vary widely depending on the timeframe you use (tick chart, 1 minute, or 5 minute, or 15 minute or 60 minute etc.), the quality of your broker's execution, any slippages, your trading commissions and many other factors.
(iii) These are NOT trading recommendations for any individual(s) and may or may not be suitable to your own financial objectives and risk tolerance - USE these ONLY as educational tools to inform and educate your own trading decisions, at your own risk.
#spx #spx500 #spy #sp500 #esmini #indextrading #daytrading #models #tradingplans #outlook #economy #bear #yields #fomc #fed #newhigh #stocks #futures #inflation #powell #interestrates #earnings #earningsseason #chinareopen

SPX Model Trading Plans for FRI. 01/27Good News, Bad News? - Day 2
As the earnings season is picking up the speed, markets seem to be buoyant on the sentiment that the worst is over. It may not take much for the market sentiment to turn the other way. But, until that happens, the momentum is to the upside.
Positional Trading Models: Our positional models currently are in a neutral bias. Models indicate going short on the close if the daily close is below 4040, with a 35 point trailing stop.
By definition, positional trading models may carry the positions overnight and over multiple days, and hence assume trading an instrument that trades beyond the regular session, with the trailing stops - if any - being active in the overnight session.
Intraday/Aggressive Models: Our aggressive, intraday models indicate the trading plans below for today.
Trading Plans for FRI. 01/27:
Aggressive Intraday Models: For today, our aggressive intraday models indicate going long on a break above 4053, 4040, or 4024 with a 9-point trailing stop, and going short on a break below 4037 or 4021 with a 9-point trailing stop.
Models indicate no explicit long exits and no explicit short exits for today. Models also indicate a break-even hard stop once a trade gets into a 4-point profit level. Models indicate taking these signals from 10:01 am ET or later.
By definition the intraday models do not hold any positions overnight - the models exit any open position at the close of the last bar (3:59pm bar or 4:00pm bar, depending on your platform's bar timing convention).
To avoid getting whipsawed, use at least a 5-minute closing or a higher time frame (a 1-minute if you know what you are doing) - depending on your risk tolerance and trading style - to determine the signals.
(WHAT IS THE CREDIBILITY and the PERFORMANCE OF OUR MODEL TRADING PLANS over the LAST WEEK, LAST MONTH, LAST YEAR? Please check for yourself how our pre-published model trades have performed so far! Seeing is believing!)
NOTES - HOW TO INTERPRET/USE THESE TRADING PLANS:
(i) The trading levels identified are derived from our A.I. Powered Quant Models. Depending on the market conditions, these may or may not correspond to any specific indicator(s).
(ii) These trading plans may be used to trade in any instrument that tracks the S&P 500 Index (e.g., ETFs such as SPY, derivatives such as futures and options on futures, and SPX options), triggered by the price levels in the Index. The results of these indicated trades would vary widely depending on the timeframe you use (tick chart, 1 minute, or 5 minute, or 15 minute or 60 minute etc.), the quality of your broker's execution, any slippages, your trading commissions and many other factors.
(iii) These are NOT trading recommendations for any individual(s) and may or may not be suitable to your own financial objectives and risk tolerance - USE these ONLY as educational tools to inform and educate your own trading decisions, at your own risk.
#spx #spx500 #spy #sp500 #esmini #indextrading #daytrading #models #tradingplans #outlook #economy #bear #yields #fomc #fed #newhigh #stocks #futures #inflation #powell #interestrates #earnings #earningsseason #chinareopen

SPX Model Trading Plans for THU. 01/26Good News Bad News?
At the open, markets seem to be buoyant on the GDP and on Tesla earnings. It may not take much for the markets to interpret the good news on the GDP front as bad news on the interest rates.
Our trading plans published yesterday, Tue. 01/24, stated: "With yesterday's daily close above 3985, our models have flipped to a bullish bias and will remain bullish while the index is above 4000. Nevertheless, models indicate a rather choppy market while the index is below 4015". Yesterday, the index closed just about 1 point above the 4015 level, and our models are closely monitoring that level.
Positional Trading Models: Our positional models currently are in a neutral bias. Models indicate going short on the close if the daily close is below 4000, with a 35 point trailing stop.
By definition, positional trading models may carry the positions overnight and over multiple days, and hence assume trading an instrument that trades beyond the regular session, with the trailing stops - if any - being active in the overnight session.
Intraday/Aggressive Models: Our aggressive, intraday models indicate the trading plans below for today.
Trading Plans for THU. 01/26:
Aggressive Intraday Models: For today, our aggressive intraday models indicate going long on a break above 4044, 4024, 4012, or 4002 with a 9-point trailing stop, and going short on a break below 4040, 4021, 4009, or 3997 with a 9-point trailing stop.
Models indicate no explicit long exits and no explicit short exits for today. Models also indicate a break-even hard stop once a trade gets into a 4-point profit level. Models indicate taking these signals from 09:36 am ET or later.
By definition the intraday models do not hold any positions overnight - the models exit any open position at the close of the last bar (3:59pm bar or 4:00pm bar, depending on your platform's bar timing convention).
To avoid getting whipsawed, use at least a 5-minute closing or a higher time frame (a 1-minute if you know what you are doing) - depending on your risk tolerance and trading style - to determine the signals.
(WHAT IS THE CREDIBILITY and the PERFORMANCE OF OUR MODEL TRADING PLANS over the LAST WEEK, LAST MONTH, LAST YEAR? Please check for yourself how our pre-published model trades have performed so far! Seeing is believing!)
NOTES - HOW TO INTERPRET/USE THESE TRADING PLANS:
(i) The trading levels identified are derived from our A.I. Powered Quant Models. Depending on the market conditions, these may or may not correspond to any specific indicator(s).
(ii) These trading plans may be used to trade in any instrument that tracks the S&P 500 Index (e.g., ETFs such as SPY, derivatives such as futures and options on futures, and SPX options), triggered by the price levels in the Index. The results of these indicated trades would vary widely depending on the timeframe you use (tick chart, 1 minute, or 5 minute, or 15 minute or 60 minute etc.), the quality of your broker's execution, any slippages, your trading commissions and many other factors.
(iii) These are NOT trading recommendations for any individual(s) and may or may not be suitable to your own financial objectives and risk tolerance - USE these ONLY as educational tools to inform and educate your own trading decisions, at your own risk.
#spx #spx500 #spy #sp500 #esmini #indextrading #daytrading #models #tradingplans #outlook #economy #bear #yields #fomc #fed #newhigh #stocks #futures #inflation #powell #interestrates #earnings #earningsseason #chinareopen

SPX Model Trading Plans for WED. 01/25Roller Coaster Ride - Day 2
Our trading plans published yesterday, Tue. 01/24, stated: "With yesterday's daily close above 3985, our models have flipped to a bullish bias and will remain bullish while the index is above 4000. Nevertheless, models indicate a rather choppy market while the index is below 4015".
As hypothesized, the market rolled over overnight and is now on the downward move. Our positional models have negated the bullish bias overnight and are currently in a neutral bias.
Positional Trading Models: Our positional trading models indicate going short on the close if the daily close is below 3975 and above 3960, with a 35 point trailing stop.
By definition, positional trading models may carry the positions overnight and over multiple days, and hence assume trading an instrument that trades beyond the regular session, with the trailing stops - if any - being active in the overnight session.
Intraday/Aggressive Models: Our aggressive, intraday models indicate the trading plans below for today.
Trading Plans for WED. 01/25:
Aggressive Intraday Models: For today, our aggressive intraday models indicate going long on a break above 4002, 3988, 3973, 3958, or 3937 with a 9-point trailing stop, and going short on a break below 3984, 3968, 3955, or 3931 with a 9-point trailing stop.
Models indicate long exits on a cross below 3995, and no explicit short exits for today. Models also indicate a break-even hard stop once a trade gets into a 4-point profit level. Models indicate taking these signals from 10:46 am ET or later.
By definition the intraday models do not hold any positions overnight - the models exit any open position at the close of the last bar (3:59pm bar or 4:00pm bar, depending on your platform's bar timing convention).
To avoid getting whipsawed, use at least a 5-minute closing or a higher time frame (a 1-minute if you know what you are doing) - depending on your risk tolerance and trading style - to determine the signals.
(WHAT IS THE CREDIBILITY and the PERFORMANCE OF OUR MODEL TRADING PLANS over the LAST WEEK, LAST MONTH, LAST YEAR? Please check for yourself how our pre-published model trades have performed so far! Seeing is believing!)
NOTES - HOW TO INTERPRET/USE THESE TRADING PLANS:
(i) The trading levels identified are derived from our A.I. Powered Quant Models. Depending on the market conditions, these may or may not correspond to any specific indicator(s).
(ii) These trading plans may be used to trade in any instrument that tracks the S&P 500 Index (e.g., ETFs such as SPY, derivatives such as futures and options on futures, and SPX options), triggered by the price levels in the Index. The results of these indicated trades would vary widely depending on the timeframe you use (tick chart, 1 minute, or 5 minute, or 15 minute or 60 minute etc.), the quality of your broker's execution, any slippages, your trading commissions and many other factors.
(iii) These are NOT trading recommendations for any individual(s) and may or may not be suitable to your own financial objectives and risk tolerance - USE these ONLY as educational tools to inform and educate your own trading decisions, at your own risk.
#spx #spx500 #spy #sp500 #esmini #indextrading #daytrading #models #tradingplans #outlook #economy #bear #yields #fomc #fed #newhigh #stocks #futures #inflation #powell #interestrates #earnings #earningsseason #chinareopen

Bulls and Bears zone for 01-25-2023Lately, market seems to sell off during ETH session than tries to rally during RTH session.
Today might be the same. Any test of yesterday's Low could provide direction for the day.
Level to watch 3991 ---3989
Report to watch:
US:EIA Petroleum Status Report
10:30 AM ET

SPX Model Trading Plans for TUE. 01/24Earnings Earnings Everywhere...
With yesterday's daily close above 3985, our models have flipped to a bullish bias and will remain bullish while the index is above 4000. Nevertheless, models indicate a rather choppy market while the index is below 4015.
Positional Trading Models: Our positional trading models indicate going short on the close if the daily close is between 3980 and 3965, with a 35 point trailing stop.
By definition, positional trading models may carry the positions overnight and over multiple days, and hence assume trading an instrument that trades beyond the regular session, with the trailing stops - if any - being active in the overnight session.
Intraday/Aggressive Models: Our aggressive, intraday models indicate the trading plans below for today.
Trading Plans for TUE. 01/24:
Aggressive Intraday Models: For today, our aggressive intraday models indicate going long on a break above 4016, 4002, 3988, or 3973 with a 9-point trailing stop, and going short on a break below 4013, 3999, 3984, or 3968 with a 9-point trailing stop.
Models indicate no explicit long or short exits for today. Models also indicate a break-even hard stop once a trade gets into a 4-point profit level. Models indicate taking these signals from 09:36 am ET or later.
By definition the intraday models do not hold any positions overnight - the models exit any open position at the close of the last bar (3:59pm bar or 4:00pm bar, depending on your platform's bar timing convention).
To avoid getting whipsawed, use at least a 5-minute closing or a higher time frame (a 1-minute if you know what you are doing) - depending on your risk tolerance and trading style - to determine the signals.
(WHAT IS THE CREDIBILITY and the PERFORMANCE OF OUR MODEL TRADING PLANS over the LAST WEEK, LAST MONTH, LAST YEAR? Please check for yourself how our pre-published model trades have performed so far! Seeing is believing!)
NOTES - HOW TO INTERPRET/USE THESE TRADING PLANS:
(i) The trading levels identified are derived from our A.I. Powered Quant Models. Depending on the market conditions, these may or may not correspond to any specific indicator(s).
(ii) These trading plans may be used to trade in any instrument that tracks the S&P 500 Index (e.g., ETFs such as SPY, derivatives such as futures and options on futures, and SPX options), triggered by the price levels in the Index. The results of these indicated trades would vary widely depending on the timeframe you use (tick chart, 1 minute, or 5 minute, or 15 minute or 60 minute etc.), the quality of your broker's execution, any slippages, your trading commissions and many other factors.
(iii) These are NOT trading recommendations for any individual(s) and may or may not be suitable to your own financial objectives and risk tolerance - USE these ONLY as educational tools to inform and educate your own trading decisions, at your own risk.
#spx #spx500 #spy #sp500 #esmini #indextrading #daytrading #models #tradingplans #outlook #economy #bear #yields #fomc #fed #newhigh #stocks #futures #inflation #powell #interestrates #earnings #earningsseason #chinareopen

we are right at that same level in spx futes4037 is former r1 swing in wave, and bulls are in full control of that momentum with the breakout. there are two paths we could take. if bulls maintain that control of the 4037 level we will reac r1 soon, but back to swing p sooner if we lose it. scenario a coincides with extension, and scenario b is a continuation of b wave. im favoring the downside, but im not dedicated to that idea. specifically if we take out the highs of this futures session im adding, and if we resist from 4037 im continuing to sell. tsla, aapl and the like are great both ways.
