Bulls and Bears zone for 12-02-2021Since the market sold off a lot yesterday, it might be a good idea to check on Fibonacci levels.
Any test of ETH session High could provide direction for the day.
Level to watch 4515 --- 4513
Report to watch:
US:EIA Natural Gas Report
10:30 AM ET
Emini

Pivotal Levels To Trade The DowIn this update we review the price action the Emini Dow and identify some high probability trade locations to take advantage of!

Bulls and Bears zone for 12-01-2021ETH session has rallied probably to test yesterday's High.
Any test of ETH session High could provide direction for the day.
Level to watch 4626 --- 4624
Reports to watch:
US: PMI Manufacturing Final
9:45 AM ET
US:ISM Manufacturing Index
10:00 AM ET
US:Construction Spending
10:00 AM ET
US:Jerome Powell Speaks
10:00 AM ET
US: EIA Petroleum Status Report
10:30 AM ET
Bulls and Bears zone for 11-30-2021ETH session market sold off aggressively perhaps to test last week's Low.
Any test of ETH session Low could provide direction for the day.
Level to watch 4611 --- 4609
Reports to watch:
US:Chicago PMI
9:45 AM ET
US:Consumer Confidence
10:00 AM ET
US:Jerome Powell Speaks
10:00 AM ET

TradersAI TradingPlans - Testing The InterestHey guys,
Hope you all had a great Thanksgiving break!
After a long time of being away from here, we are thinking of publishing our trading plans here every morning, again.
For starters, here's a very simple, actionable, but potentially powerful idea we are looking at for now:
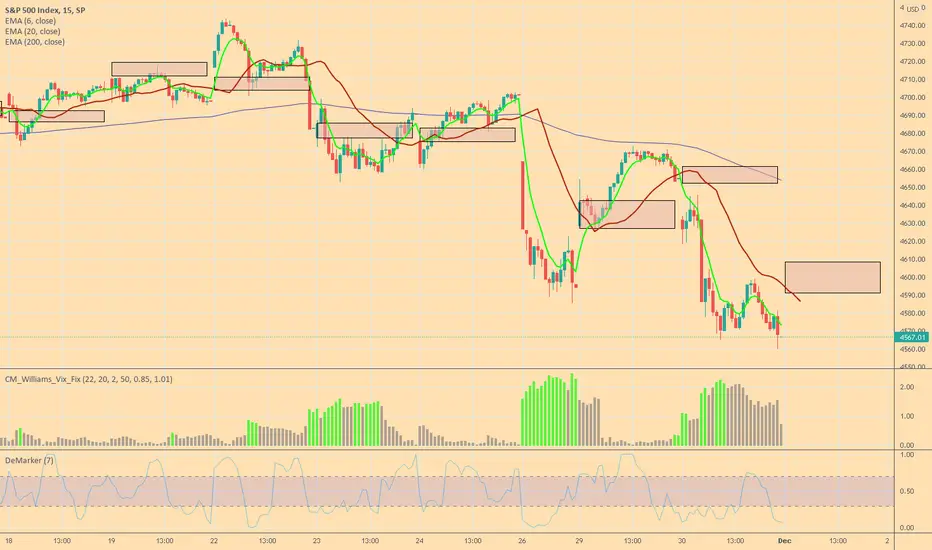
Go short if SPX breaks below 4670 or 4660 with a trailing stop of 9 points - or, exit at 3:59pm (depending on your trading time frame, say 1M, 5M, 15M, 30M, 60M, your final results could be different from someone else).
No long signals for today for our models.
Best of luck with your trading!
TradersAI

Bulls and Bears zone for 11-29-2021Market has been trading in a range during ETH session after selling off on Friday.
Any test of ETH session High could provide direction for the day.
Level to watch 4639 --- 4637
Report to watch:
US:Pending Home Sales Index
10:00 AM ET

More sell to come over next couple months$spx is entering a correction soon... expect a sideways down drive over some weeks

DOW LONG OR SHORTwill dow go lower or retrace back higher taking out the sellers, lets see what sunday open brigs and a new week ahead.

Bulls and Bears zone for 11-24-2021Market seems to be under selling pressure this morning.
Any test of yesterday's Low could provide direction for the day.
Level to watch 4670 --- 4668
Reports to watch:
US:New Home Sales
10:00 AM ET
US:Consumer Sentiment
10:00 AM E

Bulls and Bears zone for 11-23-2021This morning market is trying to rally, after a late sell off yesterday.
Any test of yesterday's Close could provide direction for the day.
Level to watch 4677 --- 4675

Bulls and Bears zone for 11-22-2021ETH session rally seems to have stalled around Friday's High.
Any test of ETH session High could provide direction for the day.
Level to watch 4708 --- 4706
Report to watch:
US:Existing Home Sales
10:00 AM ET

Bulls and Bears zone for 11-19-2021All week market has been running a pattern of alternating between range and rally days.
Any test of ETH session Low could provide direction for the day.
Level to watch 4688 --- 4686

Bulls and Bears zone for 11-18-2021Rally during ETH session stalled at Fibonacci 1.272 extension.
Any test of ETH session High could provide direction for the day.
Level to watch 4699 --- 4697
Reports to watch:
US:Leading Indicators
10:00 AM ET
US: EIA Natural Gas Report
10:30 AM ET

Bulls and Bears zone for 11-17-2021Market has been trading in a range during ETH session.
Any test of ETH session High, could provide direction for the day.
Level to watch 4695 --- 4693
Report to watch:
US:EIA Petroleum Status Report
10:30 AM ET

Bulls and Bears zone for 11-16-2021Yesterday market closed around Friday's Close and ETH session is trading in a range.
Any test of ETH session High could provide direction for the day.
Level to watch 4682 --- 4680
Reports to watch:
US:Business Inventories
10:00 AM ET
US:Housing Market Index
10:00 AM ET

Bulls and Bears zone for 11-15-2021Bulls have been active last few session and trying to push it up.
Any test of ETH session High could provide direction for the day.
Level to watch 4697 --- 4695

Bulls and Bears zone for 11-12-2021Market is trading higher after testing yesterday's Close.
Any test of ETH Low could provide direction for the day.
Level to watch 4655 --- 4653
Reports to watch:
US:Consumer Sentiment
10:00 AM ET
US:JOLTS
10:00 AM ET

Bulls and Bears zone for 11-11-2021ETH session, market has been trading around Fib levels.
Any test of Fibonacci 50% Level could provide direction for the day.
Level to watch 4655 --- 4653


Bulls and Bears zone for 11-10-2021Currently, market is trading below yesterday's Low and a rally stalled about yesterday's Close.
Any test of yesterday's Close could provide direction for the day.
Level to watch 4668 --- 4666
Reports to watch:
US: EIA Petroleum Status Report
10:30 AM ET
US: EIA Natural Gas Report
12:00 PM ET

Bulls and Bears zone for 11-09-2021Rally during ETH session stalled at Fibonacci 50% level of yesterday
Any test of ETH session High could provide direction for the day.
Level to watch 4697 --- 4695

Bulls and Bears zone for 11-08-2021ETH session market is trading above Fibonacci 50% level of Friday's session.
Any test of Friday's High could provide direction for the day.
Level to watch 4699 --- 4697
Report to watch:
US:Jerome Powell Speaks
10:30 AM ET

Bulls and Bears zone for 11-05-2021ETH session market has been trading Higher than yesterday's High.
Any test of yesterday's High could provide direction for the day.
Level to watch 4690 --- 4692
