Bulls and Bears zone for 12-04-2024It seems that Bulls keep buying and there is no end to this rally.
However, all good things come to an end, it is just matter of time.
Level to watch: 6084 --- 6082
Reports to watch:
US Factory Orders 10:00 AM
US Jerome Powell Speaks 1:40 PM
US Beige Book 2:00 PM
Emini

2024-12-02 - priceactiontds - daily update - nasdaqGood Evening and I hope you are well.
nasdaq e-mini futures
comment: Clear breakout on the daily chart. ATH wants a retest and for now there is no reason why market would stop there. My upmost target is 22400ish but for now bulls want to hit the 3 upper trend lines and see which one produces most resistance. Bears come back into the picture with a daily close below 20800.
current market cycle: Bull trend but also nested bull wedges on the daily chart. Will end in the next 3-8 weeks
key levels: 21000 - 21500
bull case: Bulls have 3 obvious targets above now. First ath retest 21340, then 2 more upper bull trend lines from wedges. 22000 is possible over the next 4 weeks but we are in the last stage of the bull trend.
Invalidation is a daily close below 21000.
bear case: Bears gave up above 21000 and will probably try again above 20300 or higher. For now they don’t have any arguments before bulls begin to stall due to profit taking. It’s too late for bigger longs and too early to short. Be patient.
Invalidation is above 22000.
short term: Bullish for 21340 and then probably some more. Buying pullback is most likely the easiest way here.
medium-long term: Will update this over the weekend. 22000 is a possibility but a bit far for now. Daily close above 20500 would bring it in play. First target for Q1 2025 is 19000.
current swing trade: Nope
trade of the day: Buy anywhere. Textbook breakout and market never looked back.

2024-11-28 - priceactiontds - daily update - sp500Good Evening and I hope you are well.
sp500 e-mini futures - Same as for dax. Retest of yesterday’s open price and bears could only correct sideways and biggest dip was 5 points. Big bull trend line was support and we are on our way up. I expect 6040 and probably higher. If not tomorrow then next month. We have a perfect channel upwards which leads 6100+. I don’t think bears can even get below 6015 again. If they do, 6000 has to hold or we could have seen the highs.
comment: Not much difference to my dax outlook. Relentless buying today, ath in sight and a decent channel upwards. Bears need something below 6000 to make bulls cover. Big bullish bias for me. Possible that we stay around 6000-6050 for November, to then do the Santa rally somewhere in December. Closing 2024 above 6000 would be amazing for bulls.
current market cycle: bull trend
key levels: 6000 - 6050 (above 6050 comes 6100 in play)
bull case : Higher lows and higher highs. Clear invalidation price given and big resistance above. I doubt bears can get this below 6010/6015 tomorrow. Only longs for me. If we stall around 6040, you should have a tight stop and from a r:r perspective, new longs above 6040 are bad.
Invalidation is below 6010.
bear case: Bears need something below 6000. That’s it. How likely is that? Look at the daily chart. Is there any bearishness in there?
Invalidation is above 6050.
short term : Bullish.
medium-long term - Update from 2024-11-16: So the top definitely qualifies as a blow-off top but the question if we continue further up, is still valid. It is possible that we are already inside the correction and if we continue below 5860, I highly doubt bulls can get above 6000 again. Given the current market structure, I won’t turn bear because the risk of another retest of the highs or even higher ones are just too big.
current swing trade: Nope
trade of the day: Could have bought pretty much anywhere.

2024-11-27 - priceactiontds - daily update - nasdaqGood Evening and I hope you are well.
nasdaq e-mini futures
comment: Market tested the 50% retracement to the tick and reversed up. It also closed above the daily 20ema, so bulls remain in control but barely. Clear triangle on the daily chart and it has room for 1-2 more days but it could also break out big time tomorrow.
current market cycle: Bull trend but also nested triangle on the daily chart
key levels : 20500 - 21500
bull case: First target is a break above 2100 and we would likely see giving up by the bears then and no more resistance until 21340. If bulls fail here and the bull trend line from August breaks, market is free to crash down to 18000.
Invalidation is below 20500.
bear case: Bears need strong follow through selling below 20700 or we won’t see lower prices. 20850 is around the mid point of the triangle and my line in the sand for bears. If they manage to keep it below, we could test down to 20700 and maybe break below.
Invalidation is above 21000.
short term: Neutral. Either wait for a bigger breakout or play the range.
medium-long term: If we stay above 20500, will likely rally more into year end before a bigger correction.
current swing trade: Nope
trade of the day: Selling the US open. Market traded below the 2m 20ema for 240 points down.

#202447 - priceactiontds - weekly update - sp500 e-mini futuresGood Evening and I hope you are well.
tl;dr
sp500 e-mini futures: Bullish. 5 consecutive days where bears tried and bulls closed at the highs. Buy signals do not get better than this. Above 6000 we see 6050 and most likely an acceleration up to new highs. 6100 and 6150 the obvious next targets. Bears need a daily close below 5850 and would still have a bigger bull trend line to break there so the downside is likely limited.
Quote from last week:
comment: 50% retracement hit and market closed above it on Friday. My preferred path for next week is a huge bull reversal higher. Is this likely after 2 strong bear days? No it’s not, so I have to wait for either side to show a clear new direction or continuation. If this goes to 5800 without me, so be it. I think after such a big rally with follow through buying above 6000, a retracement to 50% is a buy and not a sell.
comment : Bullish bias I had, bullish it was. Market looks like it wants up bad. Every dip is bought heavily on increasing volume. Time is now to get above 6100 or we won’t get it at all. Market is beyond overvalued, overbought and the poor late bulls are just arriving. Guess who will be left holding the bags again.
current market cycle: Bull trend
key levels : 5850 - 6150 (maybe even 6200)
bull case: Last hurrah. 6100 is my first target but can absolutely go beyond 6200. Anything below 5800 would be the end of this. I don’t feel the need to explain this further. The chart is crystal clear. I have written about this blow-off top for many weeks. Just don’t forget to take profits before this turns badly. I do think the odds of this closing 2024 below 6000 are low but can absolutely happen. These bullish profits since August are outrageous and once the run for the exits begins, it will be ruthless.
Invalidation is below 5800.
bear case: Bears gave up on Friday. If they can’t get below 5900 on Monday, we will see a meltup. No bear will come around big time before 6050 and even then I think they will let the bulls show signs of exhaustion before they be aggressive.
Invalidation is above 5800.
outlook last week:
short term: I want to join the bulls again. Need strong confirmation first though. Still no interest in selling as of now.
→ Last Sunday we traded 5896 and now we are at 5987. Perfect outlook. Hope you made some.
short term: Bullish all the way. If market closes below 5900 I would turn neutral and daily close below 5800 would probably be the end of my bullish thesis and I turn bear.
medium-long term - Update from 2024-11-24: 6100+ are my last targets for the bulls before this bubble begins to pop or at least deflate.
current swing trade: None
chart update: Added potential bullish 5-wave series.

Bulls And Bears zone for 11-21-2024On a daily chart, which gap is going to be filled in S&P 500 first. One on down side or upside.
Level to watch: 5966 ---5964
Report to watch:
US Existing Home Sales 10:00 AM ET

2024-11-19 - priceactiontds - daily update - sp500Good Evening and I hope you are well.
tl;dr
sp500 e-mini futures - Bullish bias still. The reversal was nasty and we had a very strong close. We are in a nested expanding triangle and if bears are strong, market won’t get above 5950. If bulls do, we go 5980 and the bear trend line next. I lean bullish. Measured move up from today gets us close to the ath and it’s the third try bears tried to close below the 50% retracement and failed. Good chance today was bears giving up and we melt again to a new ath. If we drop below 5900 again, I am probably wrong and bears taking over again.
comment : Nasty reversal and a good close by the bulls. Can expect follow through tomorrow above 5950 up tom 5980 and test the bear trend line. Above that we print a new ath. Best for bears would be to keep this below 5950 and then they have a chance of testing down to 5900 again. I have a heavy bullish bias going into tomorrow as long as market does not drop below 5900 much again
current market cycle: bull trend
key levels: 5900 - 6100
bull case: Bulls want to test the bear trend line around 5980 and go above 6000 again. They do need to break above 5950 first, which could be resistance due to the expanding triangle pattern but I doubt it. They kept the market 3 days in a row above the 50% retracement and I don’t think bears are strong enough to try a fourth time tomorrow. Measured move up from today’s reversal leads to around 6036.
Invalidation is below 5900.
bear case: Bears had an amazing sell off but bulls bought it big time. Technically this could be seen as a bear flag, but bears would have to keep the market below 5950 for that. That’s their first target and then getting below 5900 again. Since we are seeing big time buying below 5900 and the selling was mainly due to news, I don’t think bears are favored.
Invalidation is above 5950.
short term: Bullish. Probably more squeezing late bears tomorrow and I still do have unreasonable insane targets above 6100 that could be hit over the next days-weeks.
medium-long term - Update from 2024-11-16: So the top definitely qualifies as a blow-off top but the question if we continue further up, is still valid. It is possible that we are already inside the correction and if we continue below 5860, I highly doubt bulls can get above 6000 again. Given the current market structure, I won’t turn bear because the risk of another retest of the highs or even higher ones are just too big.
current swing trade: Nope
trade of the day: Buying 5855. Market printed a perfect inverted head & shoulders on the 1m tf, huge bull bars on a big volume increase. 3 almost too good to by true reasons to take the trade.

#202446 - priceactiontds - weekly update - sp500 e-mini futuresGood Evening and I hope you are well.
tl;dr
sp500 e-mini futures: Neutral until bulls come around or bears get below 5800. This pullback is too good for bulls not to buy and I have no interest in selling this. If this goes to 5800 without me, so be it. I think after such a big rally with follow through buying above 6000, a retracement to 50% is a buy and not a sell. Of course this can fail and bears are doing the real deal here. Therefore I wait for confirmation but bias is bullish.
Quote from last week:
comment: Same logic here as for dax. Bears failed to get below 5700 and on Tuesday market went the other direction. Wednesday was certainly a huge bull surprise and we went high enough that it opens even higher targets. The rally lost steam on Thursday/Friday, which could result in a pullback first. I draw the line for bulls around 5850, if we drop below, we might as well go 5800 followed by 5730.
comment: 50% retracement hit and market closed above it on Friday. My preferred path for next week is a huge bull reversal higher. Is this likely after 2 strong bear days? No it’s not, so I have to wait for either side to show a clear new direction or continuation. If this goes to 5800 without me, so be it. I think after such a big rally with follow through buying above 6000, a retracement to 50% is a buy and not a sell.
current market cycle: Bull trend
key levels: 5850 - 6050 (above 6050, 6200 comes in play)
bull case: I do think bulls have to reverse big time from 5877 or risk dropping down to 5800 on Monday. If Monday goes strongly above 5930, we will likely print 6000 the same day or Tuesday. First target for the bulls is a close above the 1h 20ema around 5920 and then 5950. Above we will see acceleration upwards.
Invalidation is below 5860ish.
bear case: Bears had a big surprise follow through day on Friday and if they can keep the momentum up, this trend is in serious question. Below 5860 we will accelerate down to 5800 and the bull trend line. I highly doubt that if we print 5800 before 6100, that we will see prices above 6000 for a long time.
Invalidation is above 5950.
outlook last week:
short term: I want to join the bulls but need a pullback first or a strong momentum break above 6030. Zero bearish thoughts as of now.
→ Last Sunday we traded 6025 and now we are at 5896. Bad outlook. Bad.
short term: I want to join the bulls again. Need strong confirmation first though. Still no interest in selling as of now.
medium-long term - Update from 2024-11-16: So the top definitely qualifies as a blow-off top but the question if we continue further up, is still valid. It is possible that we are already inside the correction and if we continue below 5860, I highly doubt bulls can get above 6000 again. Given the current market structure, I won’t turn bear because the risk of another retest of the highs or even higher ones are just too big.
current swing trade: None
chart update: Moved 50% retracement up, based on the recent bull leg.

Bulls and Bears zone for 11-15-2024S&P 500 has been negative for last four sessions. Could we see a potential gap fill trade in near future.
Level to watch: 5946 --- 5944
Report to watch:
U S Business Inventories 10:00 AM ET

2024-11-14 - priceactiontds - daily update - sp500Good Evening and I hope you are well.
tl;dr
sp500 e-mini futures - Bears moving it lower but barely. Every low was followed by 7-10 point pullback. For tomorrow I can see the following, 5909 is the daily 20ema and the breakout retest is at 5924. Those could be potential targets if the bears are strong and keep the market below 6000. Above 6000 I think many bears will give up and market could retry 6030 or higher. On the daily chart we have a two legged pullback and bulls are free to melt again. Still heavily favoring the bulls since the selling is so weak.
comment : Close below 6000 was good for the bears but does the 1h chart look bearish to you? Look at the daily chart and see how insignificant this move down is. Bears would need a big acceleration down and keep the market below the 5m 20ema for couple of hours and 100+ points. This will likely be a minor pullback which the bulls buy tomorrow. Be prepared for a nasty short squeeze tomorrow. I would not be surprised if we close above 6060 but consider me dumbfounded if we close the week below 5950.
current market cycle: bull trend
key levels: 5900 - 6100
bull case: Bulls want to close the week green and print another buy signal going into next week. Most bears will likely cover above 6000 and try again around 6015, which was the big magnet for the entire week and it will likely be for tomorrow as well. Above 6035 we see a complete give up by bears until 6053. Everything is in place for a big move tomorrow.
Invalidation is below 5960.
bear case: Bears closed below 6000. That’s the only thing they have going for them. Can they get down to the breakout price 5924 and daily 20ema around 5911? I highly doubt it. For that to happen the market would have to stay below 6000 and trap many bulls. Even a hot ppi print today could not move the market much and we had two sided trading all day. In all fairness, we have a very clear bull channel on the daily chart, with 2 upper trend lines, one around the ath 6053 and the other currently runs through 6180. I think 6180 is currently much more likely than touching the lower trend line at 5760.
Invalidation is above 6001.
short term: Bullish. Want to see a 2%+ up move tomorrow and squeeze further. Below 5950 we will print 5920 or 5900.
medium-long term - Update from 2024-10-13: Very rough guess for the remaining trading weeks in 2024. Spike up, decent correction (~10%), nasty (blow off top) year end rally if earnings hold in Q4. Don’t trade based on that guess.
Update 2024-11-14: Blow-off top happening right now. Got measured move targets above 6150 or higher. Santa came early, so don’t expect him to come around again this year.
current swing trade : Nope
trade of the day: Selling the open was decent I guess. Market looks much more bearish on the 1h tf than it was. Much two sided trading with better end for the bears. I don’t think selling 6000 was a good trade, despite going down to 5964.

#202445 - priceactiontds - weekly update - sp500 e-mini futuresGood Evening and I hope you are well.
tl;dr
sp500 e-mini futures : Bullish. Breakout was strong with follow through and I have a measured move target to 6400+ and a trend line that runs through 6200. Even if we get a pullback, the first one will most likely be bought and we retest 6050. What would the bears need to make this the ultimate bull trap? One giant bear bar that closes below 5850 could do it but how likely is that? It’s absolutely reasonable to not buy into this madness and wait for bears to come around. I would be surprised if we closed 2024 above 6000.
Quote from last week:
comment: Reasoning here is almost identical to dax and nasdaq. Selling was strong enough for a second leg and a measured move leads down to 5555, which is near the 50% retracement. I won’t repeat the same stuff here what I wrote for dax.
comment : Same logic here as for dax. Bears failed to get below 5700 and on Tuesday market went the other direction. Wednesday was certainly a huge bull surprise and we went high enough that it opens even higher targets. The rally lost steam on Thursday/Friday, which could result in a pullback first. I draw the line for bulls around 5850, if we drop below, we might as well go 5800 followed by 5730.
current market cycle: Bull trend
key levels: 5850 - 6050 (above 6050, 6200 comes in play)
bull case: With 6000 my bullish targets were met but this does not look like it’s reversing anytime soon. If bulls keep it above 5850, we are free to go up to 6100/6150. A measured move from last week up gives us 5300 and I even have a measured move target at 6500ish from the August rally but that is obviously very far fetched for now.
Invalidation is below 5850.
bear case: Bears have nothing as of now. The rally last week was strong enough to expect more upside and bears could not trade more than a bar below the 1h 20ema since Tuesday. The best they can hope for is that the bull trend line above us, holds and market does not go much above 6050. My bullish targets were met with 6000 but the market obviously broke strong enough above it. Bears have no decent reason to sell this right now.
Invalidation is above 6100.
outlook last week:
short term: Neutral until we break below 5700. I favor some more sideways movement before the second leg down but it should stay below 5830.
→ Last Sunday we traded 5758 and now we are at 6025. Well, at least I was not bearish.
short term: I want to join the bulls but need a pullback first or a strong momentum break above 6030. Zero bearish thoughts as of now.
medium-long term - Update from 2024-10-13: Very rough guess for the remaining trading weeks in 2024. Spike up, decent correction (~10%), nasty (blow off top) year end rally if earnings hold in Q4. Don’t trade based on that guess.
current swing trade: None
chart update: Removed bear lines, adjusted bull trend line and added bull channel

2024-11-07 - priceactiontds - daily update - sp500Good Evening and I hope you are well.
tl;dr
sp500 e-mini futures - Neutral. All bullish targets are met for me and I will not long anything above 5980 anymore. Too early for shorts, wait for bears to come around with force. Blow-off top with 6050 or 6100 is not out of the question, so best to join on momentum or sit on hands. Next big points will be made to the downside.
comment: All my bullish targets are now met and I would not look for longs above 5980. I got one more measured move higher to 6160 but that’s just beyond insane to expect this to be hit. But so was 6000 and here we are. All bubbles burst eventually, so will this.
current market cycle: bull wedge
key levels: 5720 - 6013
bull case: Bulls got 6000 and now want to continue and make this look like a real breakout above the bull wedge to trap many weak traders into longing this above 6000 and make them exit liquidity. At least that’s what I see potentially happening here. No interest in longs up here or looking for arguments for bulls. This is the biggest bubble there ever was. Next big points will be made to the downside.
Invalidation is below 5720.
bear case: Bears still don’t have much. The selling will start once enough bulls begin to take profits. Market is trying again to break above a multi week bull pattern and those rarely succeed. Don’t try to be an early bear and burn your account. This could easily go 50-100 points higher before turning. Measured move down from 6000 to 5730 leads exactly to the September low, where the bull trend line started. If we hit that price in 2024, you read this here first.
Invalidation is above 6050.
short term : Neutral. Scalps only for me until bears come around big time.
medium-long term - Update from 2024-10-13: Very rough guess for the remaining trading weeks in 2024. Spike up, decent correction (~10%), nasty (blow off top) year end rally if earnings hold in Q4. Don’t trade based on that guess.
Update 2024-11-07: Blow-off top happening right now and 6013 could be the end of it, I don’t know. Next comes the correction before bulls try another run at the highs during santa rally.
current swing trade: Nope
trade of the day: Buy anwhere. Again. 1h 20ema not touched since Tuesday. Trends do not get stronger than this.

2024-11-06 - priceactiontds - daily update - sp500Good Evening and I hope you are well.
tl;dr
sp500 e-mini futures - Same here, 2 daily bars engulfing 2 months price action and market tested the upper bull wedge line for a new ath. We are close enough to 6000 that we can expect it to get hit, everything else would be a huge surprise to me. Can you short 6000? Not blindly, market mostly needs a double top or more at these levels before it gives up on it. If bears get below the 1h 20ema, I start thinking about not being bullish anymore, until then it’s peak euphoria.
comment: Huge day for the bulls, right to or through the upper bull wedge line, depending on how you want to draw it. 6000 is the target and bulls will not stop until we have printed it. Bears can’t seriously expect this to stop before so that is why most of today's price action was bears giving up. We need some time around 6000 to find out how many bulls want to buy that price or if we see an immediate profit taking and reversal down. For now the bull wedge is still alive and the best pattern we have. 6000 would be a bit of an overshoot and those can reverse very fast and they like to test down to the other extreme, which would be 5800ish.
current market cycle: bull wedge
key levels: 5730 - 6000
bull case: Bulls want 6000. Don’t make this more complicated. Market has not touched the 1h 20ema since yesterday’s US open. As long as it is not broken, only look for longs until we hit 6000.
Invalidation is below 5730.
bear case : Bears don’t have much. Complete giveup from since yesterday and they will try again at 6000. If they somehow manage to print a decent 1h bear bar below the 20ema tomorrow, their case would get better. For now they don’t have one.
Invalidation is above 6050.
short term: Max bullish for 6000 as long as 1h 20ema holds.
medium-long term - Update from 2024-10-13 : Very rough guess for the remaining trading weeks in 2024. Spike up, decent correction (~10%), nasty (blow off top) year end rally if earnings hold in Q4. Don’t trade based on that guess.
current swing trade: Nope
trade of the day: Buy anwhere.

Bulls and Bears zone for 11-06-2024Yesterday's rally has continued into ETH session and market will open with a big gap up.
Therefore, we might see traders taking profit after such a gain in a day.
Level to watch: 5932 --- 5930

2024-11-05 - priceactiontds - daily update - sp500Good Evening and I hope you are well.
tl;dr
Indexes - Who wants to be long into election day? That question pondered my mind couple of times today but here we are. Surprising bull strength. I said it was too soon for the bigger second bear leg down but today was also too strong for bulls at this point. No bigger opinion on today’s price action. Most markets traded back up to the 50% retracement and near their daily 20ema and that spot is as neutral as it gets. Still leaning more bearish than bullish and I would not be surprised if the Globex session sell this hard.
sp500 e-mini futures
comment: Bulls had a good day and a buy vacuum up to the 50% retracement and daily 20ema. Bears have to come up with something big to reverse this. On the daily chart you can see the candle bodies from 2 weeks ago stayed above 5830, which is my highest target for bulls for now. If they go above that, they might as well melt to the bear trend line 5870.
current market cycle: trading range (chance that we are already in a bear trend is there)
key levels: 5730 - 5840
bull case: Bulls want to get a measured move up from today, which would lead to 5900. For now I don’t think the odds are too good for that but today’s strength was also surprising. Above 5830 I think most bears will give up.
Invalidation is below 5730.
bear case: Bears have to defend their big leg down from last week and they should keep it below 5830. They could see this as a buy vacuum to test the daily 20ema and we go down from here. My W4 target from my weekly outlook was 5800, so we are still close enough for this to be correct.
Invalidation is above 5830.
short term: Leaning bearish if we stay below 5830. Want to see this reverse completely and then some.
medium-long term - Update from 2024-10-13 : Very rough guess for the remaining trading weeks in 2024. Spike up, decent correction (~10%), nasty (blow off top) year end rally if earnings hold in Q4. Don’t trade based on that guess.
current swing trade: Nope
trade of the day: Buying US open I guess.

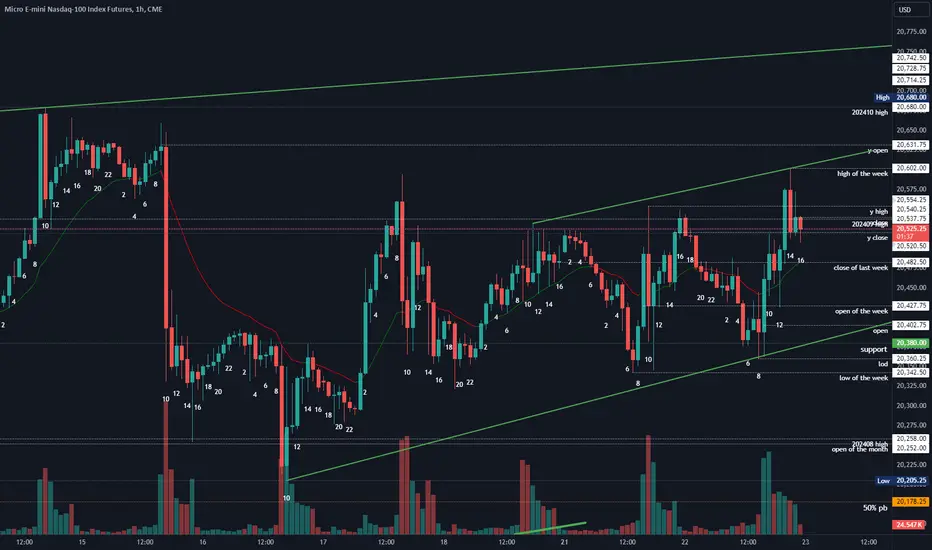
Analysis: Key Levels to Watch for Short and Long OpportunitiesI'm watching the Nasdaq closely as it approaches a critical decision point. In this analysis, I’ll outline two potential scenarios, including both short and long trade ideas based on the confluence of key technical levels.
Current Setup and Key Level: 20,320
Right now, the 20,320 level is my primary focus. This level aligns with:
The 38.2% Fibonacci retracement of the recent downtrend, suggesting potential resistance.
The VWAP (Volume-Weighted Average Price), which is acting as a dynamic resistance level.
This confluence makes 20,320 a critical resistance zone, where the market might either reverse or push through, setting the tone for the next significant move.
Scenario 1: Short Opportunity at 20,320 Resistance
If the price approaches 20,320 and shows signs of rejection (like a bearish candle pattern), I’m looking to take a short position at this level. Here’s why:
Fibonacci & VWAP Confluence: The alignment of the 38.2% Fib level with the VWAP reinforces this level as a strong potential resistance.
Risk Management: I would place a stop-loss above the 50% Fib level (around 20,400) to manage risk if the price breaks higher.
Targets: My initial target would be around the 20,000 level. If this breaks, I anticipate a stronger move downward due to potential stop-losses being triggered below 20,000 (more on that below).
Note on Stop-Loss Clusters: I believe many traders might have their stops placed just below the 20,000 mark. If the price breaks below this level, we could see a quick, momentum-driven move lower as these stops are triggered, potentially driving price toward deeper levels.
Scenario 2: Bullish Break Above 20,320
If the price breaks above 20,320 and holds above both the VWAP and the 38.2% Fib level, it could signal a bullish shift. Here’s what I’m looking for in this scenario:
Confirmation Above VWAP and Fib Level: A strong break and close above these levels would indicate that bulls are taking control and might push for higher retracement levels.
Potential Targets: In this scenario, I’d look for the price to move towards the 50% Fibonacci level (around 20,400) as the next resistance, followed by the 61.8% level near 20,500 if momentum holds.
Invalidation for Shorts: A decisive break and hold above 20,320 would invalidate the short setup. If this happens, I’ll look for potential long entries on a pullback to the VWAP or 38.2% Fib as support, with stops below these levels to manage risk.
Conclusion
The 20,320 area is the key level to watch here, with potential for both short and long setups:
Short Scenario: Look for rejection at 20,320 to target a move down to 20,000, with a possible extension lower if the 20,000 support breaks.
Long Scenario: A break above 20,320 could open the door for further upside, with potential targets around 20,400 and 20,500.
This setup combines technical indicators with price psychology, as stops clustered around the 20,000 level may drive significant moves if that support level is breached. I'll be monitoring how the price reacts to 20,320 closely for confirmation of either setup.
Let me know if you see anything differently or if you have any questions. Happy trading!

#202444 - priceactiontds - weekly update - sp500 e-mini futuresGood Evening and I hope you are well.
tl;dr
sp500: Bearish. 5730 was expected support and if bears are strong, 5800 stays resistance now. Expecting more sideways movement before another impulse down. Next target for bears is 5600 and bulls need a daily close above 5800. Thursday’s selling was strong enough for more downside but could also just have been distorted price action since it was end of the month. Friday was disappointing for bears already, which is why I think the selling is not as strong as hoped.
Quote from last week:
comment: Another disappointing week for the bulls. Big question now is the same as for dax and nq, was this the last before a deeper pullback or can we print 6000 before 5700? I don’t know and I am not going to pretend I do. Market is in breakout mode and the triangle has a bit more room to go. We simply need more price action because right now the market is in balance around 5870.
comment: Reasoning here is almost identical to dax and nasdaq. Selling was strong enough for a second leg and a measured move leads down to 5555, which is near the 50% retracement. I won’t repeat the same stuff here what I wrote for dax.
current market cycle: trading range
key levels: 5700 - 6000
bull case: 6000 remains bulls target but if we get a daily close below 5700, we will likely see 5550 before 6000. If we stay above, we will continue sideways.
Invalidation is below 5700.
bear case: Bears need to keep the pullback shallow and probably below the daily ema 5830. If they manage, their next target is 5670 which is the weekly 20ema and below that is 5555 for the measured move target, 50% retracement and July low.
Invalidation is above 5830.
outlook last week:
short term: Neutral. Bearish below 5820 for 5800, below 5800 we likely see 5730. Bullish above 5860 for 5880+ and above 5930 we will see 6000.
→ Last Sunday we traded 5846 and now we are at 5758. Outlook was ok.
short term: Neutral until we break below 5700. I favor some more sideways movement before the second leg down but it should stay below 5830.
medium-long term - Update from 2024-10-13: Very rough guess for the remaining trading weeks in 2024. Spike up, decent correction (~10%), nasty (blow off top) year end rally if earnings hold in Q4. Don’t trade based on that guess.
current swing trade: None
chart update: Added current valid bear trend lines and a potential bearish wave series down to 5555.

Bulls and Bears zone for 11-01-2024Could yesterday's sell off be just like Halloween
surprise ?
Event though, S&P closed at its Low, but ETH session traders are trying to rally.
Level to watch: 5763 --- 5765
Reports to watch:
US ISM Manufacturing Index 10:00 AM EST
US Construction Spending 10:00 AM EST

2024-10-30 - priceactiontds - daily update - sp500Good Evening and I hope you are well.
tl;dr
Indexes - Many bull trend lines are gone for good. Bears closed at the lows and they desperately need follow through tomorrow. If nq won’t keep the markets afloat tomorrow and drops below 20400, we will likely see a big sell off with 20200 or lower. Dax looks done, clear break of the trend line, swing shorts are juicy here.
sp500 e-mini futures
comment: Bull trend line is now also broken and once market prints below 5800, this is over until year end rally might try 6000 again. Same logic as dax but market is not as bearish after today. Bears need follow through below 5820 and then 5800, if they get it, buckle up. Bulls obviously want to reverse up like the past 2 weeks and trade above 5900 again.
current market cycle: triangle probably broken - entering bigger trading range
key levels: 5800 - 5870
bull case: Bulls need to stay above 5830 or we test 5820, followed by 5800. Today’s close does not look good. Before the close I heavily favored the bulls to reverse this again but then we saw couple of sell spikes which erased the previous lows. Market turns neutral again above 5865.
Invalidation is below 5800.
bear case: Bears need follow through. No surprise. 5800 is the target for tomorrow, once they get it, market is free to fall down to 5730-5740. Interesting day ahead of us.
Invalidation is above 5920.
short term: Leaning bearish if we stay below 5865. Best chance for bears in a long time.
medium-long term - Update from 2024-10-13: Very rough guess for the remaining trading weeks in 2024. Spike up, decent correction (~10%), nasty (blow off top) year end rally if earnings hold in Q4. Don’t trade based on that guess.
current swing trade: Nope
trade of the day: Selling 5880 and buying 5850 has been profitable for many days now. So it was today.

#202443 - priceactiontds - weekly update - sp500 e-mini futuresGood Evening and I hope you are well.
tl;dr
sp500 : Multiple ways to draw triangles and bull wedges on the daily chart. It has room to go more sideways but Friday’s reversal was so strong an market closed at the lows, that I think many bulls have enough reason to be disappointed and will exit once we break below 5800 and then we will likely see 5750 next. Above 5905 I am wrong and this will likely be the leg to 6000.
Quote from last week:
comment: Monday made the 50 points higher and that’s all bulls achieve last week. We had two pause bars on the daily chart with Tuesday and Thursday but that was not enough to put doubt in bulls minds that this rally is over. 6000 is the target and, same as dax, we will likely hit it one way or the other.
comment: Another disappointing week for the bulls. Big question now is the same as for dax and nq, was this the last before a deeper pullback or can we print 6000 before 5700? I don’t know and I am not going to pretend I do. Market is in breakout mode and the triangle has a bit more room to go. We simply need more price action because right now the market is in balance around 5870.
current market cycle: nested bull wedges and a minor triangle from past 2 weeks
key levels: 5800 - 6000
bull case: 6000 is the target. Bulls now tried many times to break above 5930 but continue to fail. Same reasoning as for dax. Can the market find more buyers above 5900 next time we get there or do we have to pull back down to 5730 first? Until we see a daily close below 5800, bulls are still favored, since we are only closing above the daily 20ema.
Invalidation is below 5800.
bear case: Bears are printing weak bear bars and can not close below the daily ema. Pure guesswork as of now, which side will give up first. We will very likely get a bigger move next week, so don’t blow your account until then. If bears move strongly below 5800, 5730 is next and there it’s big decision time if we see 6000 or not.
Invalidation is above 6050.
outlook last week:
short term: Neutral between 5870 - 5930 and bullish above 5930 for 6000.
→ Last Sunday we traded 5906 and now we are at 5846. Most of the week was neutral, and we closed just 60 points lower than last week.
short term: Neutral. Bearish below 5820 for 5800, below 5800 we likely see 5730. Bullish above 5860 for 5880+ and above 5930 we will see 6000.
medium-long term - Update from 2024-10-13: Very rough guess for the remaining trading weeks in 2024. Spike up, decent correction (~10%), nasty (blow off top) year end rally if earnings hold in Q4. Don’t trade based on that guess.
current swing trade: None
chart update: Removed wave count

$spx going to 11k over the next 3 to 4 yearsIm expecting the current bull to continue for another few years, with a deep correction in between now and the expected target of 11 k, by 2028/29...
From there I expect SP:SPX to enter a sideways bear market such as the ones of 68/75 and 2000/2009 in order to form the 4th base of the secular run since 1929 (shown the comments).
Bears always get it wrong, because of their self-delusions about the world and often also themselves!
It's bulls who - due to their prescience and foresight - actually get to foresee tops in the market.
Bears never catch a top, if they do it's either by coincidence, luck or something a four year old could have seen, like the covid top... anyway... we see so much madness in the ideas section, it's even fun!

Bulls and Bears zone for 10-23-2024S&P 500 has been range bound last several days.
Any test of yesterday's Close could provide direction for the day.
Level to watch: 5870 ---5872
Reports to watch:
US Existing Home Sales 10:00 AM ET
US Beige Book 2:00 PM ET

2024-10-22 - priceactiontds - daily update - nasdaqGood Evening and I hope you are well.
tl;dr
Indexes - Sideways again. No deeper meaning to it. Nasdaq has not touched the daily 20ema over the last days but is creeping higher again. Lows are bought so it’s reasonable to expect bears to give up unless something unexpected happens (e.g. very bad earnings but the probability is very low). Bull wedge has not a lot of room anymore, so the odds of a big breakout, this week, are good.
nasdaq e-mini futures
comment : We are moving in a nested bull channel inside the bigger bull wedge. We are making higher highs and higher lows again but barely. Buying above 20500 has been unprofitable for a week now but also selling below 20400. One side will give up soon, can wait for the bigger breakout instead of trading this trading range. Having said that, bulls are still in control since bears could not even touch the daily ema for two weeks now.
current market cycle: Bull trend (nested bull wedges)
key levels: 20000 - 21000
bull case: Bulls grinding this higher again but we also see decent selling in between. It’s buy low and sell high inside the channel. Don’t overstay your welcome in positions and don’t bet on a breakout. Their next target is a breakout above the current channel and a retest of 20700. Above that they would need a daily close above 20700 and then market is free to retest 21000+ again.
Invalidation is below 20300.
bear case: Bears need a daily close below 20300. If they get that, next target would be 20200 and then they have a decent chance of testing 19900 again, where the bull trend line from August runs through. So even if they get all that, the downside is probably very limited for now.
Invalidation is above 20700.
short term: Neutral
medium-long term: Very likely a retest of the ath before I expect a correction 10% or more, before another year end rally. I do think we see 21000 before we see 19600.
current swing trade: Nope
trade of the day: Buying the US open 20400 since previous support was 20340ish and upside potential was to 20500 at least.