How to Prep: SPX Breakdown. BIG MoveSPX Breakdown:
My Philosophy is price is king and
KEEP IT SIMPLE.
Here it is.
Today My Plan for SPX intraday...
Es to Spx
4752.
Spx Bull case
Open above 4752 we can test 4762 with 4769 and 4774 (this is my preferred move at opening, then adjust).
SPX Bear case
Open below 4752 and stay below 4752 we can test 4742 with 4733 and 4728.
Hope you enjoy! Follow on TradingView for more trading tips.
Stay Frosty!
Emini

Bulls and Bears zone for 01-11-2024This morning market is trading lower.
Any test of ETH session High could provide direction for the day.
Level to watch: 4838 --- 4836
Report to watch:
US:EIA Natural Gas Report
10:30 AM ET

Bulls and Bears Zone for 01-04-2024Four down days in a row, something we have not seen in a while.
Two years ago today when S&P 500 made ATH.
Level to watch: 4751 --- 4753
Report to watch:
US:EIA Natural Gas Report
10:30 AM ET

March E-Mini S&P 500 Index Futures Weekly Chart - 12/18/23March E-mini S&P 500 Index futures continued the rally that began at the beginning of November, taking out the recent high from the last week in July. MACD recently experienced a bullish cross by crossing above its signal line. That relationship is widening, which indicates a continuing bullish trend. RSI is getting closer to being overbought at 70, though bearish divergence might be in play as the RSI is lower than its peak in August, even though price has taken out the high in August. This could indicate that momentum is weakening, and a reversal might occur. If the bullish trend continues, resistance might be found at the April 2022 high of 4,860. A reverse to the downside could find support at the 61.8% Fib level (4,530) and at the 52-week moving average (~4,400).
Please Note:
Commentary and charts reflect data at the time of analysis (12/15/23). Market conditions are subject to change and may not reflect all market activity.

Bulls and Bears zone for 12-13-2023Are we there yet?
This Santa Claus rally seems to be very strong, but for how long is the question.
Level to watch: 4700 --- 4702
Reports to watch:
US:EIA Petroleum Status Report
10:30 AM ET
US:FOMC Announcement
2:00 PM ET
US: Fed Chair Press Conference
2:30 PM ET

Bulls and Bears zone for 12-07-2023Yesterday market sold off and closed at its Low. This morning it is trading at bottom half of yesterday's RTH session.
Any test of ETH session High could provide direction for the day.
Level to watch 4570 --- 4568
Report to watch:
US:EIA Natural Gas Report
10:30 AM ET

Bulls and Bears zone for 11-29-2023Markets have been trading sideways for a week. Need to be patient with trading this market.
Level to watch 4583 ---- 4581
Report to watch:
US:EIA Petroleum Status Report
10:30 AM ET
US: Beige Book
2:00 PM ET

Weekly Setup and 10 AM TRADEThis is a holiday abridged week. I expect market volume to taper off after Tuesday or so, with it coming alive following Monday. Thursday and Friday, the NYSE remains closed. Happy Thanksgiving!
My Weekly Scenarios
Scenario 1: I think if we are able to remain above 4510-4515 this week, there may be a tendency to test 4552 area. I do think there is a possibility of a range extension into 4586-4600 due to seasonality, mega caps etc.
ES Weekly Trade Plan
Inflection: 4508-4512
Upper Levels: 4545 / 4565 / 4606-4614 / 4634
Lower Levels: 4484 / 4467-4474 / 4423-4430 / 4400
ES Monday Trade Plan
Inflection: 4508-4512
Upper Levels: 4537 / 4545 / 4560-4566 / 4580
Lower Levels: 4500 / 4493 / 4474 / 4467
STAY FROSTY!

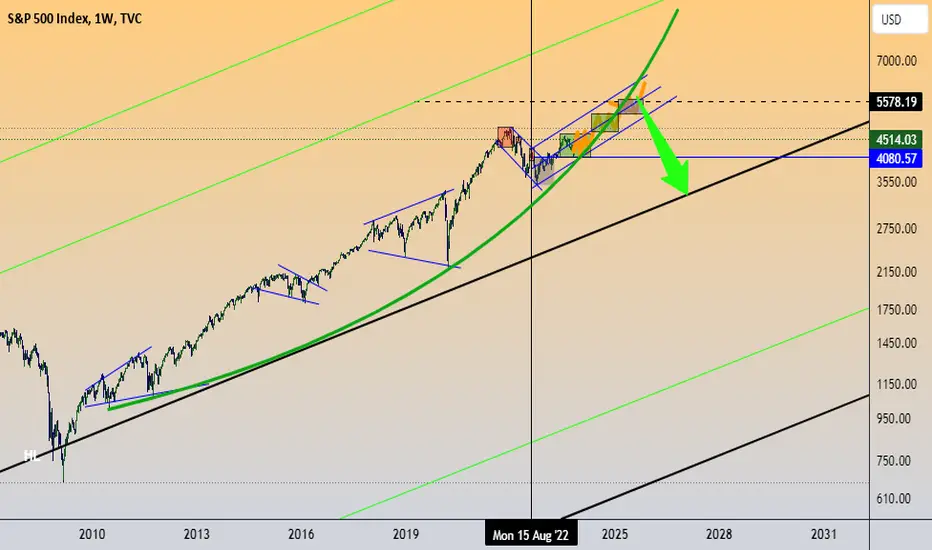
$spx on a parabolic FithCBOE:SPX is climbing it's 5th and last (?) wave from the parabolic rise created since the GFC... targets about 5600 CBOE:SPX and from there I do expect the October 2022 lows to be taken out at last...
False Rally? Two scenarios. Price hits 4550-4600 and stalls in a range to either,
Scenario 1, break down and rebalance the BISI FVGs formed at end of October throughout November.
Scenario 2, price ranges around 4550-4600 levels before taking out 4640 highs, reaching for 4750.

Bulls and Bears zone for 11-15-2023After a Huge rally yesterday, futures are trading around yesterday's High.
Any test of yesterday's HIGH could provide direction for the day.
Level to watch: 4522 --- 4524
Reports to watch:
US: Business Inventories
10:00 AM ET
US:EIA Petroleum Status Report
10:30 AM ET

Bulls and Bears zone for 11-09-2023Last several days market has been rallying. However, last few sessions traders seem to be selling in the afternoon session.
Level to watch 4395 --- 4393
Report to watch:
US:EIA Natural Gas Report
10:30 AM ET
US: Jerome Powell Speaks
2:00 PM ET

Tuesday Overview and Wed Prep ES/SPXBeautiful day of trading. I sent an update on key level of 4376.
"LIS down now to 4376, if it holds we may see 4400-4405 tested. "
Key level tomorrow will be 4340.
I will share any updates in the chat.
Stay Frosty!

Daily Plan ES SPX 11/3/2023Scenarios for tomorrow
my key level tomorrow will remain 4330-4340.
ES Trade Plan
Inflection: 4337
Upper Levels: 4340-4345 / 4370 / 4392-4397
Lower Levels: 4307 / 4294-4296 / 4267
Stay Frosty!

Bulls and Bears zone for 11-01-2023Market is trying to rally this morning after selling off during ETH session.
We could have a range bound session today.
Level to watch 4213 --- 4211
Reports to watch:
US:ISM Manufacturing Index
10:00 AM ET
US: Construction Spending
10:00 AM ET
US:JOLTS
10:00 AM ET
US:EIA Petroleum Status Report
10:30 AM ET
US:FOMC Announcement
2:00 PM ET
US: Fed Chair Press Conference
2:30 PM ET

Bulls and Bears zone for 10-25-2023Markets ability to rally yesterday afternoon after a late morning sell off is encouraging.
Any test of ETH Low could provide direction for the day.
Level to watch 4262 --- 4260
Reports to watch:
US: New Home Sales
10:00 AM ET
US:EIA Petroleum Status Report
10:30 AM ET

Powell's Speech to Provide Market Direction?S&P 500 INDEX MODEL TRADING PLANS for THU. 10/19
This week marks the beginning of the peak of Q3 earnings season, and a potential inflection points in the geopolitical risks with signs of potential ground operations to begin by Israel in Gaza. Geopolitical risks, high interest rates, sticky inflation, extremely strong jobs market, early signs of consumers beginning to scale back...yet, retail bullish positioning has increased this week again. Powell's speech today may not necessarily provide any clear market direction, yet it could lead to some knee jerk moves.
We have been publishing for the last two weeks: "Our models indicate 4310 as the level to close above for the current bearish bias to be negated". Now, this 4310 is the main support level and a daily close below that is needed for our models to turn bearish. The market tested this level briefly yesterday, Wed. 10/18, but bounced right back up to close a few points above it. This level may come into play again today, and how the price action ends today with respect to this level could give us some indications of near-term market direction.
Aggressive, Intraday Trading Plans:
For today, our aggressive intraday models indicate going long on a break above 4377, 4352, 4322, 4306, or 4285 with a 9-point trailing stop, and going short on a break below 4365, 4345, 4312, 4301, or 4280 with a 9-point trailing stop.
Models indicate explicit long exits on a break below 4370 or 4319, and explicit short exits on a break above 4370 or 4314. Models also indicate a break-even hard stop once a trade gets into a 4-point profit level. Models indicate taking these signals from 09:59am EST or later.
By definition the intraday models do not hold any positions overnight - the models exit any open position at the close of the last bar (3:59pm bar or 4:00pm bar, depending on your platform's bar timing convention).
To avoid getting whipsawed, use at least a 5-minute closing or a higher time frame (a 1-minute if you know what you are doing) - depending on your risk tolerance and trading style - to determine the signals.
(WHAT IS THE CREDIBILITY and the PERFORMANCE OF OUR MODEL TRADING PLANS over the LAST WEEK, LAST MONTH, LAST YEAR? Please check for yourself how our pre-published model trades have performed so far! Seeing is believing!)
NOTES - HOW TO INTERPRET/USE THESE TRADING PLANS:
(i) The trading levels identified are derived from our A.I. Powered Quant Models. Depending on the market conditions, these may or may not correspond to any specific indicator(s).
(ii) These trading plans may be used to trade in any instrument that tracks the S&P 500 Index (e.g., ETFs such as SPY, derivatives such as futures and options on futures, and SPX options), triggered by the price levels in the Index. The results of these indicated trades would vary widely depending on the timeframe you use (tick chart, 1 minute, or 5 minute, or 15 minute or 60 minute etc.), the quality of your broker's execution, any slippages, your trading commissions and many other factors.
(iii) These are NOT trading recommendations for any individual(s) and may or may not be suitable to your own financial objectives and risk tolerance - USE these ONLY as educational tools to inform and educate your own trading decisions, at your own risk.
#spx, #spx500, #spy, #sp500, #esmini, #indextrading, #daytrading, #models, #tradingplans, #outlook, #economy, #bear, #yields, #stocks, #futures, #inflation, #recession, #softlanding, #higher4longer, #higherforlonger, #israel, #geopolitical, #earnings, #powellspeech

Bulls and Bears zone for 10-18-2023Last several days S&P 500 has been trading sideways since bouncing off its 200 DMA.
Any test of yesterday's Low could provide direction for the day.
Level to watch: 4382 --- 4384
Report to watch:
US: Beige Book
2:00 PM ET

Earnings Season Kicks OffS&P 500 INDEX MODEL TRADING PLANS for FRI. 10/13
Today marks the kick off of the Q3 earnings season, and a potential inflection points in the geopolitical risks with signs of potential ground operations to begin by Israel in Gaza. Geopolitical risks, high interest rates, sticky inflation - reiterated by this morning's CPI numbers, extremely strong jobs market, early signs of consumers beginning to scale back...yet, retail bullish positioning has increased this week again. Is this Fools rushing in where Angels fear to tread or retail investors having some crystal ball into the future that institutions don't have access to? Only time can tell.
However, our AI-driven models (since 2018 - not a "me too AI" bandwagon hopper) have negated the bearish bias yesterday, Tue. 10/10, based on the last two sessions' price action and in line with what we have been publishing for the last week or so: "Our models indicate 4310 as the level to close above for the current bearish bias to be negated". Now, this 4310 is the main support level and a daily close below that is needed for our models to turn bearish.
Aggressive, Intraday Trading Plans:
For today, our aggressive intraday models indicate going long on a break above 4402, 4384, 4371, 4361, or 4312 with a 9-point trailing stop, and going short on a break below 4398, 4357, 4348, 4332, or 4308 with a 9-point trailing stop.
Models indicate explicit long exits on a break below 4380, 4375, or 4367, and explicit short exits on a break above 4353 or 4336. Models also indicate a break-even hard stop once a trade gets into a 4-point profit level. Models indicate taking these signals from 10:11am EST or later.
By definition the intraday models do not hold any positions overnight - the models exit any open position at the close of the last bar (3:59pm bar or 4:00pm bar, depending on your platform's bar timing convention).
To avoid getting whipsawed, use at least a 5-minute closing or a higher time frame (a 1-minute if you know what you are doing) - depending on your risk tolerance and trading style - to determine the signals.
(WHAT IS THE CREDIBILITY and the PERFORMANCE OF OUR MODEL TRADING PLANS over the LAST WEEK, LAST MONTH, LAST YEAR? Please check for yourself how our pre-published model trades have performed so far! Seeing is believing!)
NOTES - HOW TO INTERPRET/USE THESE TRADING PLANS:
(i) The trading levels identified are derived from our A.I. Powered Quant Models. Depending on the market conditions, these may or may not correspond to any specific indicator(s).
(ii) These trading plans may be used to trade in any instrument that tracks the S&P 500 Index (e.g., ETFs such as SPY, derivatives such as futures and options on futures, and SPX options), triggered by the price levels in the Index. The results of these indicated trades would vary widely depending on the timeframe you use (tick chart, 1 minute, or 5 minute, or 15 minute or 60 minute etc.), the quality of your broker's execution, any slippages, your trading commissions and many other factors.
(iii) These are NOT trading recommendations for any individual(s) and may or may not be suitable to your own financial objectives and risk tolerance - USE these ONLY as educational tools to inform and educate your own trading decisions, at your own risk.
#spx, #spx500, #spy, #sp500, #esmini, #indextrading, #daytrading, #models, #tradingplans, #outlook, #economy, #bear, #yields, #stocks, #futures, #inflation, #recession, #softlanding, #higher4longer, #higherforlonger, #israel, #geopolitical, #earnings

Fools Rushing In or Angels' Crystal Ball? Day 3S&P 500 INDEX MODEL TRADING PLANS for THU. 10/12
Geopolitical risks, high interest rates, sticky inflation - reiterated by this morning's CPI numbers, extremely strong jobs market, early signs of consumers beginning to scale back...yet, retail bullish positioning has increased this week again. Is this Fools rushing in where Angels fear to tread or retail investors having some crystal ball into the future that institutions don't have access to? Only time can tell.
However, our AI-driven models (since 2018 - not a "me too AI" bandwagon hopper) have negated the bearish bias yesterday, Tue. 10/10, based on the last two sessions' price action and in line with what we have been publishing for the last week or so: "Our models indicate 4310 as the level to close above for the current bearish bias to be negated". Now, this 4310 is the main support level and a daily close below that is needed for our models to turn bearish.
Aggressive, Intraday Trading Plans:
For today, our aggressive intraday models indicate going long on a break above 4401, 4388, 4380, 4347, or 4337 with a 8-point trailing stop, and going short on a break below 4398, 4368, 4355, 4343, or 4334 with a 9-point trailing stop.
Models indicate explicit long exits on a break below 4385 or 4376, and explicit short exits on a break above 4359 or 4371. Models also indicate a break-even hard stop once a trade gets into a 4-point profit level. Models indicate taking these signals from 09:32am EST or later.
By definition the intraday models do not hold any positions overnight - the models exit any open position at the close of the last bar (3:59pm bar or 4:00pm bar, depending on your platform's bar timing convention).
To avoid getting whipsawed, use at least a 5-minute closing or a higher time frame (a 1-minute if you know what you are doing) - depending on your risk tolerance and trading style - to determine the signals.
(WHAT IS THE CREDIBILITY and the PERFORMANCE OF OUR MODEL TRADING PLANS over the LAST WEEK, LAST MONTH, LAST YEAR? Please check for yourself how our pre-published model trades have performed so far! Seeing is believing!)
NOTES - HOW TO INTERPRET/USE THESE TRADING PLANS:
(i) The trading levels identified are derived from our A.I. Powered Quant Models. Depending on the market conditions, these may or may not correspond to any specific indicator(s).
(ii) These trading plans may be used to trade in any instrument that tracks the S&P 500 Index (e.g., ETFs such as SPY, derivatives such as futures and options on futures, and SPX options), triggered by the price levels in the Index. The results of these indicated trades would vary widely depending on the timeframe you use (tick chart, 1 minute, or 5 minute, or 15 minute or 60 minute etc.), the quality of your broker's execution, any slippages, your trading commissions and many other factors.
(iii) These are NOT trading recommendations for any individual(s) and may or may not be suitable to your own financial objectives and risk tolerance - USE these ONLY as educational tools to inform and educate your own trading decisions, at your own risk.
#spx, #spx500, #spy, #sp500, #esmini, #indextrading, #daytrading, #models, #tradingplans, #outlook, #economy, #bear, #yields, #stocks, #futures, #inflation, #recession, #softlanding, #higher4longer, #higherforlonger, #israel, #geopolitical, #cpi

Fools Rushing In or Angels' Crystal Ball? Day 2S&P 500 INDEX MODEL TRADING PLANS for WED. 10/11
Geopolitical risks, high interest rates, sticky inflation, extremely strong jobs market, early signs of consumers beginning to scale back (per Walmart's CEO)...yet, retail bullish positioning has increased last week. Is this Fools rushing in where Angels fear to tread or retail investors having some crystal ball into the future that institutions don't have access to? Only time can tell.
However, our AI-driven models (since 2018 - not a "me too AI" bandwagon hopper) have negated the bearish bias yesterday, Tue. 10/10, based on the last two sessions' price action and in line with what we have been publishing for the last week or so: "Our models indicate 4310 as the level to close above for the current bearish bias to be negated". Now, this 4310 is the main support level and a daily close below that is needed for our models to turn bearish.
Aggressive, Intraday Trading Plans:
For today, our aggressive intraday models indicate going long on a break above 4401, 4390, 4381, 4359, or 4321 with a 9-point trailing stop, and going short on a break below 4397, 4376, 4356, 4332, or 4315 with a 9-point trailing stop.
Models indicate explicit long exits on a break below 4387, and explicit short exits on a break above 4335. Models also indicate a break-even hard stop once a trade gets into a 4-point profit level. Models indicate taking these signals from 10:01am EST or later.
By definition the intraday models do not hold any positions overnight - the models exit any open position at the close of the last bar (3:59pm bar or 4:00pm bar, depending on your platform's bar timing convention).
To avoid getting whipsawed, use at least a 5-minute closing or a higher time frame (a 1-minute if you know what you are doing) - depending on your risk tolerance and trading style - to determine the signals.
(WHAT IS THE CREDIBILITY and the PERFORMANCE OF OUR MODEL TRADING PLANS over the LAST WEEK, LAST MONTH, LAST YEAR? Please check for yourself how our pre-published model trades have performed so far! Seeing is believing!)
NOTES - HOW TO INTERPRET/USE THESE TRADING PLANS:
(i) The trading levels identified are derived from our A.I. Powered Quant Models. Depending on the market conditions, these may or may not correspond to any specific indicator(s).
(ii) These trading plans may be used to trade in any instrument that tracks the S&P 500 Index (e.g., ETFs such as SPY, derivatives such as futures and options on futures, and SPX options), triggered by the price levels in the Index. The results of these indicated trades would vary widely depending on the timeframe you use (tick chart, 1 minute, or 5 minute, or 15 minute or 60 minute etc.), the quality of your broker's execution, any slippages, your trading commissions and many other factors.
(iii) These are NOT trading recommendations for any individual(s) and may or may not be suitable to your own financial objectives and risk tolerance - USE these ONLY as educational tools to inform and educate your own trading decisions, at your own risk.
#spx, #spx500, #spy, #sp500, #esmini, #indextrading, #daytrading, #models, #tradingplans, #outlook, #economy, #bear, #yields, #stocks, #futures, #inflation, #recession, #softlanding, #higher4longer, #higherforlonger, #israel, #geopolitical

Bulls and Bears zone for 10-11-2023Equities have rallied for three straight days in a row.
Any test of yesterday's High could provide direction for the day.
Level to watch: 4302 --- 4304
Report to watch:
US:FOMC Minutes
2:00 PM ET

Fools Rushing In Or Angels' Crystal Ball?S&P 500 INDEX MODEL TRADING PLANS for TUE. 10/10
Geopolitical risks, high interest rates, sticky inflation, early signs of consumers beginning to scale back (per Walmart's CEO)...yet, retail bullish positioning has increased last week. Is this Fools rushing in where Angels fear to tread or retail investors having some crystal ball into the future that institutions don't have access to? Only time can tell.
However, our AI-driven models (since 2018 - not a "me too AI" bandwagon hopper) have negated the bearish bias, based on the last two sessions' price action and in line with what we have been publishing for the last week or so: "Our models indicate 4310 as the level to close above for the current bearish bias to be negated". Now, this 4310 is the main support level and a daily close below that is needed for our models to turn bearish.
Aggressive, Intraday Trading Plans:
For today, our aggressive intraday models indicate going long on a break above 4379, 4357, 4343, 4322, or 4300 with a 9-point trailing stop, and going short on a break below 4375, 4353, 4338, 4319, or 4297 with a 9-point trailing stop.
Models indicate explicit long exits on a break below 4307, and explicit short exits on a break above 4315. Models also indicate a break-even hard stop once a trade gets into a 4-point profit level. Models indicate taking these signals from 10:31am EST or later.
By definition the intraday models do not hold any positions overnight - the models exit any open position at the close of the last bar (3:59pm bar or 4:00pm bar, depending on your platform's bar timing convention).
To avoid getting whipsawed, use at least a 5-minute closing or a higher time frame (a 1-minute if you know what you are doing) - depending on your risk tolerance and trading style - to determine the signals.
(WHAT IS THE CREDIBILITY and the PERFORMANCE OF OUR MODEL TRADING PLANS over the LAST WEEK, LAST MONTH, LAST YEAR? Please check for yourself how our pre-published model trades have performed so far! Seeing is believing!)
NOTES - HOW TO INTERPRET/USE THESE TRADING PLANS:
(i) The trading levels identified are derived from our A.I. Powered Quant Models. Depending on the market conditions, these may or may not correspond to any specific indicator(s).
(ii) These trading plans may be used to trade in any instrument that tracks the S&P 500 Index (e.g., ETFs such as SPY, derivatives such as futures and options on futures, and SPX options), triggered by the price levels in the Index. The results of these indicated trades would vary widely depending on the timeframe you use (tick chart, 1 minute, or 5 minute, or 15 minute or 60 minute etc.), the quality of your broker's execution, any slippages, your trading commissions and many other factors.
(iii) These are NOT trading recommendations for any individual(s) and may or may not be suitable to your own financial objectives and risk tolerance - USE these ONLY as educational tools to inform and educate your own trading decisions, at your own risk.
#spx, #spx500, #spy, #sp500, #esmini, #indextrading, #daytrading, #models, #tradingplans, #outlook, #economy, #bear, #yields, #stocks, #futures, #inflation, #recession, #softlanding, #higher4longer, #higherforlonger, #israel, #geopolitical
