ENA / USDT#ENA / USDT
Iam expecting big returns from ETH and its related coins in this season
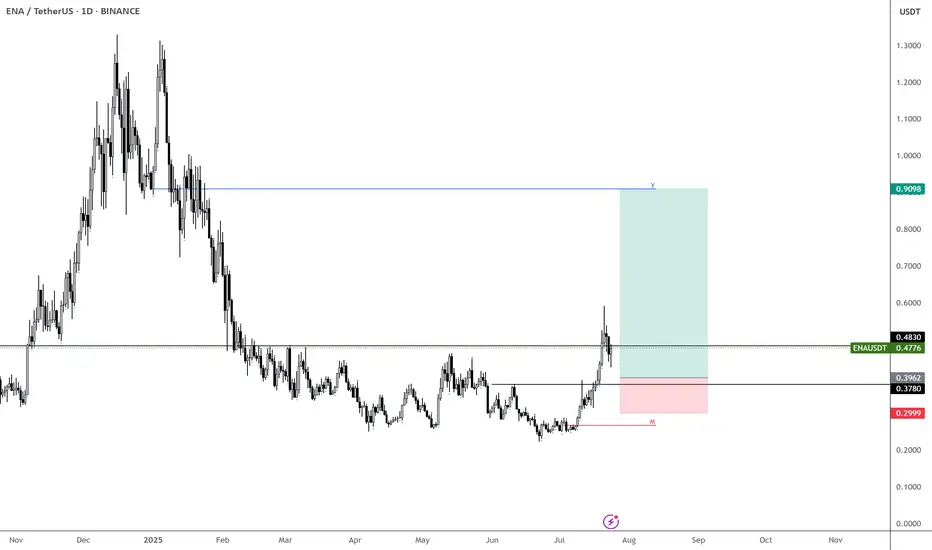
This chart is also looking good
Another Potential round bottom pattern under formation
Keep an eye
Enacrypto

ENA – Sub-40c Would Be a Gift
If we get BINANCE:ENAUSDT below 40c, that would be an incredible opportunity.
Maybe I’m being too greedy—or maybe not. I’ll let the market decide.
Right now, ENA looks like a solid play for the coming weeks, so I’m focused on finding the best possible entry.
MARKETSCOM:ETHEREUM still looks strong overall. Even with a minor retrace, I’m expecting higher—potentially up to $7k.
So it makes sense to position in names like BINANCE:ENAUSDT , BINANCE:EIGENUSDT , BINANCE:AAVEUSDT , and others to ride the wave.
ENA : The largest token release...Hello dears
Given the long-term price decline that we have witnessed, it has now been announced that this currency is going to do a token release, which will naturally cause the price to fall, so be careful.
In case of a fall, we have identified important supports for you so that you can buy with risk and capital management.
The target has also been identified.
*Trade safely with us*

ENAUSDT Long / Buy SetupOn lower tf ena showing bullish momentum, while previous setups went bad due to war, but ena still holding the previous marked area, this is a short term setup not long term, still expecting another low for whole market. Will share swing setups if found strong momentum. Must use SL as btc as it's peak.

ENA SCALP & Intraday Setup Both Long & Short SetupWait for the entries to be filled first. If short entry achieved first then go for the short, if long entry achieved first then go for the long, in both cases must use SL, cause it's consolidating in a range, any side impulse move is expected from ena.

ENAUSDT 1D Analysis ENA ~ 1D Analysis
#ENA Buy back gradually from here if you still have confidence in this coin with a short term target of at least 15%+ from here.

ENA About to Explode or Dump? Key Levels You Can’t Ignore!Yello Paradisers — are you positioned right for the next potential explosion in #ENA, or will you get caught on the wrong side of the move like most retail traders? After a brutal grind in a descending channel, something big is brewing... and it’s coming faster than many realize. Let's dive in.
💎#ENAUSDT currently facing a key resistance at the upper boundary of the descending channel, clearly tested multiple times and respected well by the market structure. A candle close above this channel would trigger a confirmed breakout, which opens up a clean path for continued upside movement — the next major target sits at the resistance zone between 0.446 and 0.4725.
💎There’s a high-probability alternative setup unfolding as well: ENA holding the S/R level around 0.3448 and the demand zone below, which aligns perfectly with the multi-timeframe EMA support. If this area holds strong, expect another impulse move toward our resistance zone as momentum builds.
💎Price had been forming lower highs and lower lows, respecting the downtrend But recently we observed a Clear Change of Character (ChoCH) — ENA broke market structure by forming a higher high.What usually follows? A higher low, and that’s where we are now.
💎The most probable scenario is for price to pull back to the S/R level or dip into the demand zone, and then form a higher low before making the next leg upward toward resistance.
💎Invalidation is simple and must be respected: if we see a confirmed candle close below 0.2798, then the bullish case breaks and the setup is no longer valid. This is where you must cut quickly, avoid hope-trading, and reassess the structure from scratch.
Don’t chase. Don’t panic. React with strategy, not emotion. This is how real professionals win in crypto. Stay sharp, Paradisers.
MyCryptoParadise
iFeel the success🌴

#ENA/USDT#ENA
The price is moving within a descending channel on the 1-hour frame, adhering well to it, and is heading for a strong breakout and retest.
We are seeing a bounce from the lower boundary of the descending channel, which is support at 0.3430.
We have a downtrend on the RSI indicator that is about to be broken and retested, supporting the upward trend.
We are looking for stability above the 100 moving average.
Entry price: 0.3521
First target: 0.3608
Second target: 0.3728
Third target: 0.3882

#ENA/USDT#ENA
The price is moving within a descending channel on the 1-hour frame, adhering well to it, and is heading for a strong breakout and retest.
We are experiencing a rebound from the lower boundary of the descending channel, which is support at 0.3700.
We are experiencing a downtrend on the RSI indicator, which is about to break and retest, supporting the upward trend.
We are looking for stability above the 100 Moving Average.
Entry price: 0.3911
First target: 0.4100
Second target: 0.4235
Third target: 0.4410

Sensitive supportHello friends
Considering the good growth we had, you can see that the price has corrected after reaching its ceiling and has reached a sensitive support.
Now, with the price correction, there is a good opportunity to buy in stages and with capital management and move towards the specified goals.
*Trade safely with us*

$ENA Finally Breaks Out – Retesting Before Next Leg Up!!MIL:ENA eventually broke through the adamant trendline resistance.
following repeated rejectionsPrice is now backing off slightly, testing the Fib area and breakout formation.
Holding at this level positions it to make a clean run to $0.48–$0.50+This chart is on the rise again ????
Follow for more updates
DYOR, NFA

ENAUSDT - IS it still Bullish?This is for ENA - and below is the M-Profile
The 4H SVP chart of ENA/USDT displays a very strong bullish structure after a prolonged downtrend and compression phase. Price stayed compressed under $0.31 with declining volume and tight overlapping value areas—this created a base. The breakout occurred explosively on May 8, with aggressive volume and clear value area migration upward. Each subsequent 4H session shows price acceptance above prior value, with POC shifting from $0.36 to $0.38 and now to $0.41, confirming strength. The current VAH is around $0.422 and POC at $0.418, so if ENA holds above $0.41, dips into this value area are ideal for continuation longs. If it breaks above $0.422 with volume, the next breakout leg may target $0.445–$0.46. Overall, the structure suggests the uptrend is intact unless price closes back below $0.39 VAH.
This is the doodle you can long for, a small little bit more of an upmove before it makes a fall below owing btc move' though expecting more higher a bit of a move!

ENA is standing at a classic “make-or-break base-build” juncture
🕞 60-Second Read
Trend on the 1-D chart is still structurally bearish , yet price (spot 0.350 USDT) just printed a higher-low off the April wick and reclaimed the mid-channel line. Two large upside voids are now in play.
Hot-Zone #1 – 0.292 (15 m imbalance): fresh demand, 17 % under spot.
Hot-Zone #2 – 0.496 (3 MP-High retest): range cap & first breaker, 42 % above.
Hot-Zone #3 – 0.836 → 0.892 (Feb pivot ↔ Yearly EC): macro supply shelf.
🎲 Probability Dashboard
HTF Trend & Structure – -2
Liquidity Map (voids above) – +1
Momentum (vector flips) – +1
Derivatives (funding ≈ flat) – 0
Net Score = 0
Bear / Neutral / Bull odds ≈ 40 % / 30 % / 30 %
📈 Trade Playbook
Strategy 1
1. Layered Limit Grid – Aggressive Counter-Trend Long
Entry layers (size %):
0.300 – 25 % of your allocated ENAUSDT size
0.280 – 35 %
0.260 – 25 %
0.240 – 15 %
SL = 0.215
TP ladder:
0.350 – 20 % off-load
0.496 – 25 %
0.836 – 30 %
1.040 – 25 %
Weighted R:R ≈ 7.3
Strategy 2
2. Layered Limit Grid – Conservative Breakout Long
Trigger: daily close > 0.496, then place grid orders.
Entry layers (size %):
0.510 – 40 %
0.570 – 30 %
0.650 – 20 %
0.836 – 10 %
SL = 0.440
TP ladder:
0.836 – 30 %
1.040 – 30 %
1.516 – 25 %
1.550 – 15 %
Weighted R:R ≈ 4.8
Setup Logic
Price reclaimed mid-channel but remains inside a 69 % upside void to 0.836.
Stacked un-retested highs (0.496 / 0.836 / 1.040) act as magnetic targets.
Yearly S1 (0.220) converges with vector zone support – ideal invalidation.
Risk Radar
Perp OI up 18 % WoW – a funding spike could squeeze late longs.
Two token unlocks (2 & 5 May) add ≥ 200 M ENA supply.
Macro: FOMC (1 May) & BTC flow volatility may spill into alts.
ENA must flip 0.496 to sprint through the 0.84-1.04 air-pocket; fail that and liquidity magnets at 0.30 → 0.22 take the wheel. Trade the grid – not the hopium.
(Not financial advice – always do your own research.)

#ENA/USDT#ENA
The price is moving within a descending channel on the 1-hour frame, adhering well to it, and is heading for a strong breakout and retest.
We are seeing a rebound from the lower boundary of the descending channel, which is support at 0.2800.
We have a downtrend on the RSI indicator that is about to break and retest, supporting the upward trend.
We are looking for stability above the 100 moving average.
Entry price: 0.2935
First target: 0.3020
Second target: 0.3100
Third target: 0.3200

ENA/USDT Breakout Pattern (18.04.2025)The ENA/USDT pair on the M30 timeframe presents a Potential Buying Opportunity due to a recent Formation of a Breakout Pattern. This suggests a shift in momentum towards the upside and a higher likelihood of further advances in the coming hours.
Possible Long Trade:
Entry: Consider Entering A Long Position around Trendline Of The Pattern.
Target Levels:
1st Resistance – 0.3015
2nd Resistance – 0.3217
🎁 Please hit the like button and
🎁 Leave a comment to support for My Post !
Your likes and comments are incredibly motivating and will encourage me to share more analysis with you.
Best Regards, KABHI_TA_TRADING
Thank you.

ENAUSDT 1DENA ~ 1D Analysis
#ENA The main support that you might be able to consider to start buying back from here with a short -term target of at least 10%+ from here.

#ENA/USDT#ENA
The price is moving within a descending channel on the 1-hour frame, adhering well to it, and is heading for a strong breakout and retest.
We are experiencing a rebound from the lower boundary of the descending channel, which is support at 0.3530.
We are experiencing a downtrend on the RSI indicator, which is about to break and retest, supporting the upward trend.
We are looking for stability above the 100 Moving Average.
Entry price: 0.3700
First target: 0.3820
Second target: 0.3950
Third target: 0.4118

Bearish Outlook for ENA: Potential Downward TrendHello everyone! 👋
I hope you're all doing well. I wanted to share my thoughts on ENA and provide my perspective on the current market situation. Here's my outlook:
The price of this coin is exhibiting signs of weakness, suggesting it may face further downward pressure. Recent price action has broken through key support levels, while momentum indicators are pointing to a continuation of the prevailing downtrend.
If the broader market sentiment remains negative, we could see further declines toward the next major support zones. While potential rebounds are always a possibility, the overall trend currently appears to favor the bears.
Stay vigilant and manage your risk accordingly.
Best regards! BINANCE:ENAUSDT

ENA/USDT Analysis: A great opportunity for a speculative longThis asset has broken an important sell zone and consolidated above it, forming a strong volume zone below at $0.415-$0.408. On a retest of this zone, we will monitor the reaction. If confirmation appears, we open a long position with the potential to break above the $0.48 level.

ENA...Hello friends
Given that the price has reached the bottom of the range, which is also a good support area, we can enter the trade with risk and capital management.
*Trade safely with us*

Phemex Analysis #68: Is It A Good Time to Buy Ethena (ENA) Now?!Ethena has rapidly ascended in the decentralized finance (DeFi) sector, notably propelling its stablecoin, USDe, to become the world's largest by market capitalization within a year. In December 2024, Ethena Labs introduced USDtB, a stablecoin backed by BlackRock's tokenized money market fund, BUIDL, aimed at stabilizing USDe during bearish crypto market phases. More recently, a proposal has been put forward to integrate Ethereal, a decentralized exchange (DEX), into Ethena's reserve management system. This integration seeks to enhance trading capabilities for USDe and distribute governance tokens to ENA holders, further enriching the ecosystem.
Despite these fundamental advancements, ENA's price has experienced significant volatility. After reaching a high of $1.32, the token's value declined by approximately 75%, hitting a low of $0.33. However, the downward momentum has recently slowed, coinciding with a broader market recovery. This shift has led many to question whether now is an opportune time to invest in ENA, especially considering its substantial real-world developments.
Potential Scenarios
1. Continued Downtrend
If ENA fails to maintain current support levels at $0.316, it could test lower price points. Factors such as broader market downturns or negative investor sentiment could exacerbate this decline.
Pro Tips:
Short Positions: Experienced traders might consider short-selling strategies to capitalize on potential declines, especially if the price drops below $0.316 with high volume.
Buying at Support Levels: Long-term investors may consider accumulating ENA gradually near established support levels such as $0.26 and $0.20.
2. Consolidation Phase
ENA may enter a consolidation phase, trading within a defined range as the market seeks direction. This period of sideways movement could last until new catalysts emerge.
Pro Tips:
Range Trading: Identify key support ($0.316) and resistance levels ($0.48) to execute buy and sell orders effectively within the trading range.
Patience: Avoid overtrading during consolidation; wait for clear signals before making significant moves.
3. Bullish Reversal
Given ENA's recent positive developments and technical indicators, there is potential for a bullish reversal. Sustaining levels above recent resistance points could signal renewed investor confidence and an upward trend.
Pro Tips:
Breakout Entry: If the price breaks above the $0.40 resistance level with high volume, consider a long position with profit targets at $0.48, $0.54, and $0.70.
Accumulate Gradually: Consider dollar-cost averaging to build a position without exposing yourself to immediate market volatility.
Conclusion
Deciding to invest in ENA requires careful consideration of these scenarios. By employing strategic approaches tailored to each potential outcome, traders can better navigate the complexities of the cryptocurrency market. As always, thorough research and prudent risk management are essential when making investment decisions.
Tips:
🔥 Break free from "buy low, sell high"! Our new Pilot Contract empowers you to profit from ANY market direction on DEX coins with up to 3x leverage. Go long, go short, go further!
Check out Phemex - Pilot Contract today!
Disclaimer: This is NOT financial or investment advice. Please conduct your own research (DYOR). Phemex is not responsible, directly or indirectly, for any damage or loss incurred or claimed to be caused by or in association with the use of or reliance on any content, goods, or services mentioned in this article.

Breaking: Ethena ($ENA) Surged 21% Today- What Next?The synthetic dollar protocol built on Ethereum that will provide a crypto-native solution for money that is not reliant on traditional banking system infrastructure, alongside a globally accessible dollar-denominated savings instrument native token Ethena ( MIL:ENA ), saw its price surge by a whooping 21% today amidst the three white crow pattern that appeared on the daily price chart hinting at increased buying pressure.
Ethena, weeks back was down losing almost half of value, bulls took advantage of the dip and capitalize on the oversold nature of MIL:ENA , presently placing the RSI at 58 which is neither overbought nor oversold but hints at a continuous buying pressure.
In the case of a market pull back, MIL:ENA might find support in the 78.6% fib retracement level, similarly, a break above the 1-month high could pave way for a new resistance point with massive influx of buyers in the long term.
Ethena Price Live Data
The live Ethena price today is $0.439498 USD with a 24-hour trading volume of $758,695,169 USD. We update our ENA to USD price in real-time. Ethena is up 16.02% in the last 24 hours, with a live market cap of $1,416,695,330 USD. It has a circulating supply of 3,223,437,500 ENA coins and the max. supply is not available.

ENAUSDT 2DENA ~ 2D Analysis
#ENA Buy gradually from here if you still have a Conviction on this Coin with a minimum target of 20%+.
