#ENA/USDT#ENA
The price is moving in a descending channel on the 1-hour frame and is expected to continue upwards
We have a trend to stabilize above the moving average 100 again
We have a descending trend on the RSI indicator that supports the rise by breaking it upwards
We have a support area at the lower limit of the channel at a price of 0.3880
Entry price 0.4480
First target 0.4870
Second target 0.5224
Third target 0.5700
ENAUSD

ENAUSDT 2DENA ~ 2D Analysis
#ENA If you still have a Conviction on this Coin, Maybe this support you can consider to start buying back with a minimum target of 15%+.
ENAUSDT – Massive Breakout Incoming? Yello, Paradisers! Are we about to witness a major reversal, or is #ENAUSDT gearing up for another leg down? Let’s break it down before the big move happens!
💎#ENAUSDT has been forming a falling wedge a classic bullish reversal pattern. The price has been consistently rejecting from the descending resistance while finding support at the lower boundary. But here’s the key part: price action is now testing a crucial support zone at $0.4690 an area where buyers have historically stepped in to push the market higher. This could be a major turning point.
💎If bulls take control and we see a breakout above the wedge resistance, it could trigger a strong rally. The first major target sits in the $0.8229–$0.8794 range, followed by a key resistance zone near $1.2690. With volume confirmation, this move could accelerate quickly, fueled by short squeezes and renewed bullish momentum.
💎On the flip side, if bulls fail to hold the support and the price breaks below, it could open the door for a deeper correction trapping late buyers and causing further liquidations.
This is not the time for emotional decisions. A big move is coming, but patience is key. Whether it’s a breakout or a breakdown, only a few traders will time it right.
MyCryptoParadise
iFeel the success🌴

Sniper Mode Activated – The Perfect Entry is Coming! Sniper Mode Activated – The Perfect Entry is Coming! 🎯💥
“Look, I know I’m aiming a little lower than most, but that’s what separates the best traders. I don’t chase – I snipe the perfect entry. Precision, patience, and massive profits!”
Here’s the Plan:
Blue Box = BIG Opportunity – If CDV, lower time frame breakouts, and volume profile align, these zones could be incredibly profitable.
Patience is Power – I don’t jump in blindly. I wait for confirmation, for the perfect shot, and then I strike. That’s how pros trade.
Momentum is Key – When the breakout happens, you don’t want to be late. You want to be ahead of the move, positioned for maximum gains.
Final Thoughts:
“I’ve got my eyes on this like a hawk. CDV, volume profile, liquidity heatmap – all must align. No confirmation, no trade. But when the signal comes? We take the shot and win big.”
Good luck, traders – the setup is coming, and it could be massive! 🚀🔥
Let me tell you, this is something special. These insights, these setups—they’re not just good; they’re game-changers. I've spent years refining my approach, and the results speak for themselves. People are always asking, "How do you spot these opportunities?" It’s simple: experience, clarity, and a focus on high-probability moves.
Want to know how I use heatmaps, cumulative volume delta, and volume footprint techniques to find demand zones with precision? I’m happy to share—just send me a message. No cost, no catch. I believe in helping people make smarter decisions.
Here are some of my recent analyses. Each one highlights key opportunities:
🚀 RENDERUSDT: Strategic Support Zones at the Blue Boxes +%45 Reaction
🎯 PUNDIXUSDT: Huge Opportunity | 250% Volume Spike - %60 Reaction Sniper Entry
🌐 CryptoMarkets TOTAL2: Support Zone
🚀 GMTUSDT: %35 FAST REJECTION FROM THE RED BOX
🎯 ZENUSDT.P: Patience & Profitability | %230 Reaction from the Sniper Entry
🎯 DEXEUSDT %180 Reaction with %9 Stop
🐶 DOGEUSDT.P: Next Move
🎨 RENDERUSDT.P: Opportunity of the Month
💎 ETHUSDT.P: Where to Retrace
🟢 BNBUSDT.P: Potential Surge
📊 BTC Dominance: Reaction Zone
🌊 WAVESUSDT.P: Demand Zone Potential
🟣 UNIUSDT.P: Long-Term Trade
🔵 XRPUSDT.P: Entry Zones
🔗 LINKUSDT.P: Follow The River
📈 BTCUSDT.P: Two Key Demand Zones
🟩 POLUSDT: Bullish Momentum
🌟 PENDLEUSDT.P: Where Opportunity Meets Precision
🔥 BTCUSDT.P: Liquidation of Highly Leveraged Longs
🌊 SOLUSDT.P: SOL's Dip - Your Opportunity
🐸 1000PEPEUSDT.P: Prime Bounce Zone Unlocked
🚀 ETHUSDT.P: Set to Explode - Don't Miss This Game Changer
🤖 IQUSDT: Smart Plan
⚡️ PONDUSDT: A Trade Not Taken Is Better Than a Losing One
💼 STMXUSDT: 2 Buying Areas
🐢 TURBOUSDT: Buy Zones and Buyer Presence
🌍 ICPUSDT.P: Massive Upside Potential | Check the Trade Update For Seeing Results
🟠 IDEXUSDT: Spot Buy Area | %26 Profit if You Trade with MSB
📌 USUALUSDT: Buyers Are Active + %70 Profit in Total
🌟 FORTHUSDT: Sniper Entry +%26 Reaction
🐳 QKCUSDT: Sniper Entry +%57 Reaction
📊 BTC.D: Retest of Key Area Highly Likely
This list? It’s just a small piece of what I’ve been working on. There’s so much more. Go check my profile, see the results for yourself. My goal is simple: provide value and help you win. If you’ve got questions, I’ve got answers. Let’s get to work!

ENA/USDT - Potential Breakout in Long-Term DowntrendHello traders!
Let's take a look at the ENA/USDT price chart. As you can observe, the price has been locked in a long-term downtrend , contained within a descending macro channel .
Recent Price Action:
Over the past 24 hours, ENA has shown signs of a potential reversal. The price has entered a mini-uptrend channel and is currently approaching the upper boundary (ceiling) of the larger, descending macro channel. This creates the possibility of a breakout from the long-term downtrend.
Potential Breakout Scenario:
Given the potential increase in altcoin trading volume, I believe there's a strong likelihood that ENA could break through the macro channel's resistance level, located around $1.060 . If this breakout occurs, I anticipate a continued upward movement towards the following targets:
First targets:
Target 1: $0.9875
Target 2: $1.0500
Then:
Target 1: $1.20
Target 2: $1.35
Target 3: $1.52
mportant Note on Price Correction:
It's crucial to acknowledge that after a potential breakout above the macro channel's ceiling, a price correction is likely to follow. This is a normal market behavior after a significant upward move and should be anticipated.
Disclaimer:
This analysis represents my personal perspective and should not be considered financial advice. The cryptocurrency market is inherently volatile, and past performance is not a guarantee of future results. Always conduct your own research and manage your risk accordingly before making any trading decisions.
Good luck with your trades!

ENAUSD: Buy signal at the bottom of the Megaphone.Ethena just turned neutral on its 1D technical outlook (RSI = 47.814, MACD = -0.029, ADX = 25.505), which considering the +8% rise today, signifies the enormous upside potential of this coin. This is expected as the long term pattern is a Bullish Megaphone nonetheless. Each of the two HH formations on its top, where on the 4.0 Fibonacci extension. Buy and target the 4.0 Fib (TP = 2.4000).
## If you like our free content follow our profile to get more daily ideas. ##
## Comments and likes are greatly appreciated. ##

ENA Holding Key Support: Ready for the Next Move?ENA/USDT is in a strong uptrend, consistently forming higher highs and higher lows. The price is currently trading above a key support zone, which aligns with the strong rising trendline.
A bounce from the current levels could lead to a potential upside move, especially after a period of accumulation.
DYOR, NFA

ENA/USDT on the Edge Major Breakdown Signals Big Moves Ahead!The chart showcases ENA/USDT breaking down from a well-established channel pattern, signaling potential bearish momentum. This breakdown indicates a shift in market sentiment, as bulls have failed to hold the key support levels. The price action now reflects a retest of the broken channel's lower boundary, which is likely to act as a significant resistance area.
ENA has exited the channel pattern, with the price moving decisively below the structure. This breakdown is a critical bearish signal, as it invalidates the previous trend's upward momentum. The levels of $0.84 and $0.89 will act as key resistance points. The $0.84 level represents the immediate resistance derived from the channel's lower boundary, while $0.89 aligns with a historical supply zone, where sellers are likely to dominate if the price approaches this level. A failure to reclaim these levels will reinforce the bearish bias, encouraging sellers to push the price lower.
If the price fails to reclaim the resistance levels, the bearish breakdown could extend toward $0.73, which is the first significant demand zone, followed by $0.66, a mid-level support identified from previous accumulation zones, and $0.58, the ultimate bearish target if selling pressure accelerates.
The breakdown has been accompanied by increased sell-side volume, indicating strong participation by sellers. Any attempts to reclaim the resistance levels must also show increasing volume on the buy side to invalidate the bearish structure. The breakdown below the channel has likely shaken bullish confidence. When the price retests the resistance zone between $0.84 and $0.89, short positions may dominate, targeting the lower support levels.
Traders should watch for price action near the $0.84 to $0.89 resistance range. A clear rejection at this zone, coupled with low bullish volume, will confirm the bearish continuation. Conversely, if bulls manage to reclaim and hold above $0.89, it could invalidate the bearish outlook and signal a recovery toward $1.00.
ENA/USDT has shown significant bearish signs with the channel breakdown and subsequent retest of resistance levels. The likelihood of further downside remains high unless bulls reclaim the $0.89 level. Traders should exercise caution and focus on price action around the key resistance and support zones for optimal trade entries.

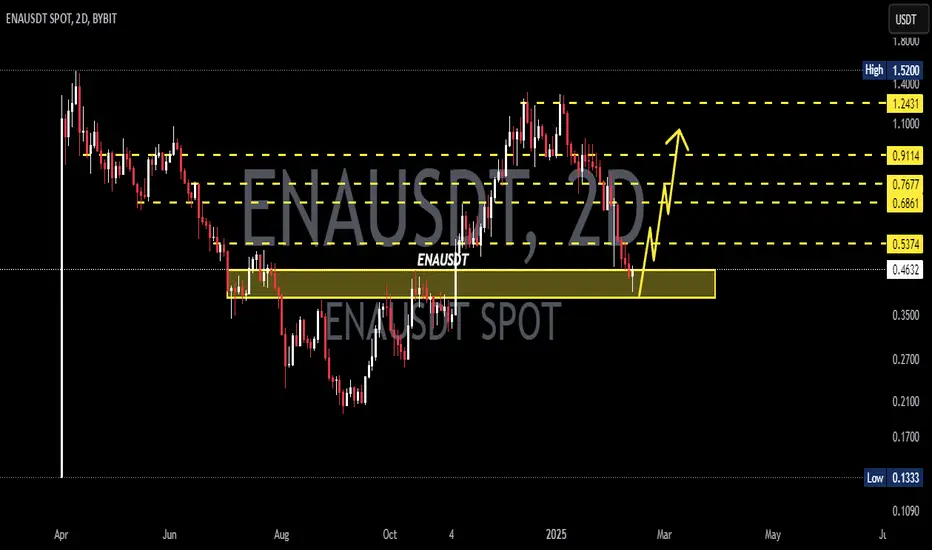
ENA rebuy setup (1D)This is one of the symbols that Trump had invested in. It now appears that a supercycle has completed, and the price has entered a new wave phase (wave E).
The low-risk area for rebuying in spot trading includes the two entries we have highlighted on the chart.
Minimum targets are indicated on the chart. If ENA can stabilize above the supply zone, it may become very bullish again.
The closure of a daily candle below the invalidation level will invalidate this analysis.
For risk management, please don't forget stop loss and capital management
Comment if you have any questions
Thank You

ENAUSDT 3DENA ~ 3D
MIL:ENA In the next 2-3 weeks you will see a new high price for this coins, Buy in stages, target at least 20%+

ENAUSDT Analysis - What Shall we Expect !!!As you can see, the price is likely forming a cup and handle pattern. If our assumption is correct, we should wait for this pattern to break out to see a price increase.
Give me some energy !!
✨We spend hours finding potential opportunities and writing useful ideas, we would be happy if you support us.
Best regards CobraVanguard.💚
_ _ _ _ __ _ _ _ _ _ _ _ _ _ _ _ _ _ _ _ _ _ _ _ _ _ _ _ _ _ _ _
✅Thank you, and for more ideas, hit ❤️Like❤️ and 🌟Follow🌟!
⚠️Things can change...
The markets are always changing and even with all these signals, the market changes tend to be strong and fast!!

#ENA/USDT Ready to go up#ENA
The price is moving in a descending channel on the 15-minute frame and sticking to it well
We have a bounce from the lower limit of the descending channel, this support is at 0.6900
We have a downtrend on the RSI indicator that is about to be broken, which supports the rise
We have a trend to stabilize above the moving average 100
Entry price 0.7000
First target 0.7190
Second target 0.7389
Third target 0.7600

Is #ENAUSDT Ready to Rally or Fall Further? Key Levels to Watch Yello, Paradisers! Is #ENAUSDT ready to make a massive bullish move and slide down further? Let's discuss #Ethena analysis and see what's happening:
💎#ENA is showing promising signs of a bullish continuation and holding steady at the crucial support zone between $0.254 and $0.300. We've been closely watching its journey within a Descending Broadening Wedge pattern, and now, #Ethena looks poised to test the descending resistance line—a potential turning point.
💎Volume has remained robust, and with #ENA marking its all-time low just one month ago, we may be setting up for a strong rebound. As the saying goes, "Once we hit bottom, the only place to go is up," and this could be unfolding right now.
💎If #ENAUSDT can maintain strength at its current level, we could be on the verge of a significant rally. A breakout above the $0.470 minor resistance zone would open the path to higher targets and potentially even new highs.
💎However, if momentum weakens around this support zone, a pullback toward the lower demand area near $0.204 could be in store. A daily close below this demand zone would invalidate our bullish outlook and could signal more downside risk.
Stay vigilant, Paradisers, and closely monitor #ENA's price action.
MyCryptoParadise
iFeel the success🌴

ENAUSDT Bullish Flag!ENAUSDT Technical analysis update
ENAUSDT is trading within a bullish flag pattern on the 4-hour chart, with the 100 EMA providing support at the flag's bottom. Once the price breaks above the flag's resistance, a bullish move of 50-100% can be anticipated in ENA.
Buy After breakout confirmed in 4H chart
Target: 50%-100%

ENA - 300% UPENA has changed its trend from bearish to bullish. It is likely, it has marketcap, volumes will come and I see it up with at least 300% gain.

#ENA/USDT#ENA
The price is moving in a descending channel on the 4-hour frame upwards and is expected to continue.
We have a trend to stabilize above the moving average 100 again.
We have a downtrend on the RSI indicator that supports the rise by breaking it upwards.
We have a support area at the lower limit of the channel at a price of 0.33100.3800.
Entry price 0.2800.
First target 0.4174.
Second target 0.4435.
Third target 0.4637.

#ENA/USDT#ENA
The price has broken the descending channel on the 1-hour frame. To the upside and is expected to continue
We have a trend to stabilize above the moving average 100 again
We have an upward trend on the RSI indicator that supports the rise by breaking it to the upside
We have a support area at the lower limit of the channel at a price of 0.2700
Entry price 0.2900
First target 0.3300
Second target 0.3609
Third target 0.3963

#ENA/USDT#ENA
The price is moving in a descending channel on the 12-hour frame and is sticking to it to a large extent and it was broken upwards
We have a bounce from the lower limit of the channel at a price of 0.200
We have an upward trend on the RSI indicator, which supports the rise
We have a trend to stabilize above the moving average 100
Entry price 0.220
First target 0.257
Second target 0.286
Third target 0.322

ENAUSDTGood Luck >>
• Warning •
Any deal I share does not mean that I am forcing you to enter into it, you enter in with your full risk, because I'll not gain any profits with you in the end.
The risk management of the position must comply with the stop loss.
(I am not sharing financial or investment advice, you should do your own research for your money.)

ENAUSDT Resistance Breakout!ENAUSDt technical analysis update
ENA is breaking the resistance trendline after 20 days of consolidation on the 4H chart. We can expect a strong bullish move from the current level, as the price is trading above the 100 EMA.
Regards
Hexa

#ENA/USDT#ENA
We have a descending channel pattern on the 12-hour frame, the price is moving within it and adhering to its borders well
We have a support ar ea in green at a price of 0.800 after the price touched it and rebounded from it
We have a trend to stabilize above the moving average 100
We have a descending trend on the RSI indicator that supports the price upwards and is expected to break it
Entry price 0.2900
First target 0.330
Second target 0.355.
Third target 0.386

ENAUSDTENA ~ 12H
#ENA Successfully broke through the resistance of this descending pattern.
Buy in stages. bulls will continue to push the price as long as it is above this resistance.

ENA - A reversal is inevitable #ENA/USDT #Analysis
Description
---------------------------------------------------------------
+ The price has formed a channel and is currently trading within it.
+ A clear breakout from the channel could trigger a bullish trend.
+ A minor correction is expected before the trend reverses.
---------------------------------------------------------------
VectorAlgo Trade Details
------------------------------
Entry Price: 0.35
Stop Loss: 0.27
------------------------------
Target 1: 0.39
Target 2: 0.44
Target 3: 0.51
------------------------------
Timeframe: 4H
Capital Risk: 1-2% of trading amount
Leverage: 5-10x
---------------------------------------------------------------
Enhance, Trade, Grow
---------------------------------------------------------------
Feel free to share your thoughts and insights.
Don't forget to like and follow us for more trading ideas and discussions.
Best Regards,
VectorAlgo
