EUR/USD trend analysisHello Traders
It looks like EUR/USD trend is about to reverse. From my point of view i see an ending diagonal pattern still forming for wave C of a zigzag correction (ABC).
i'm looking for price to find support at .50 Fibonacci level before reverse.
As always i will be looking for a long entry after price breaks above wave 4 of ending diagonal (wave C)
Happy trading.
Ending Diagonal


USD/JPY Trade AlertHello traders,
Today i'm updating USD/JPY . do you recognize a pattern?
i do, it's an ending diagonal indicating a trend reversal is near by
always look for more confirmations before enter the market and this is One, Another one can be oversold RSI and Stochastic or Bullish candlestick formations
Happy Trading

AUD/USD ending DiagonalHello Traders,
Possible ending diagonal on wave 5 of 3. I ll wait for breakout on lower support line for an entry. Sometimes when ending diagonal are formed we expect a big drop on price.
As i said always wait for confirmation before entering. good luck

XAUUSD - Ending Diagonal - End Of Correction?Here is a Elliot Wave Triple Three correctional combination which began since the last impulse move reached its peak (1689) in February.
The Zigzag pattern you can see between wave X to Z is the final corrective pattern of the three combinations which implies that the correction is coming to an end. Further confluence is provided by the nature in which the final set of waves are forming. They are coming together in an Ending Diagonal . Ending Diagonals are commonly found at the end of a Wave C in a correctional sequence.
I see this final wave coming to at least 1650 according to the general guidelines, and then a wick out anywhere down below between the 1650-1630 zone.
From there we could see a new yearly high with an initial target of 1787. Further wave extensions are coming in at 1808, 1833 and 1846. This is a long term target (quarterly and biannual) which only serves to provide an indication of the current direction.
Disclaimer
This is not trading advice. All content/ information shared in this idea is purely educational in nature and is expected to be used for educational analysis and illustration purposes only.
Do not trade or speculate based solely on the information provided.
Trust your own analysis.
Beyond Edge

XAUUSD - Ending Diagonal - End Of Correction?Here is a Elliot Wave Triple Three correctional combination which began since the last impulse move reached its peak (1689) in February.
The Zigzag pattern you can see between wave X to Z is the final corrective pattern of the three combinations which implies that the correction is coming to an end. Further confluence is provided by the nature in which the final set of waves are forming. They are coming together in an Ending Diagonal. Ending Diagonals are commonly found at the end of a Wave C in a correctional sequence.
I see this final wave coming to at least 1650 according to the general guidelines, and then a wick out anywhere down below between the 1650-1630 zone.
From there we could see a new yearly high with an initial target of 1787. Further wave extensions are coming in at 1808, 1833 and 1846. This is a long term target (quarterly and biannual) which only serves to provide an indication of the current direction.
Disclaimer
This is not trading advice. All content/ information shared in this idea is purely educational in nature and is expected to be used for educational analysis and illustration purposes only.
Do not trade or speculate based solely on the information provided.
Trust your own analysis.
Beyond Edge

Ending Diagonal GBP/USDHello Traders
an ending diagonal on 1 hour chart GBP/USD is almost completed and it looks like "a throw over on wave 5 just occurred " (a brief break of the trend line connecting the end points of wave 1 and 3). if this in fact a valid analysis expect a sharp decline retracing at least back where it started or even further

EUR/USD 1 hour chart ending diagonalHello Traders, it look like EUR/USD uptrend is coming an end, price has been rejected several times from march 20 high (Resistance level now) and it also looks like an ending diagonal pattern it's on the way which tipically are formed on wave 5 or waves C . RSI and Stochastic are showing divergence indicating a possible reversal. for this analysis to be valid we will be looking for a break out below ending diagonal pattern support line

GBPUSD Elliott Wave | Short | Jeremy WagnerChart on the left suggests we are in wave iv of C (ending diagonal)...one more dip lower to retest today's low to finish off the bearish sequence then we may see a strong rally.
The chart on the right is a more traditional impulse and is one wave slower...so two more dips lower to finish off C then a strong rally.
Trend lines support a hold below the April 7 low.
If you are learning Elliott Wave, I'd appreciate any questions you have so it makes sense for you.
Cheers!
Jeremy

PING AN prediction till 2021 year by Powerful TradersHello everyone!
Traders, we do not like to write more.
The prediction of the PING AN' price you can find on a chart!
Regards, Team Traders "Powerful Traders"

Emerging ButterflyEmerging Bearish Butterfly ,
watch price action at the potential reversal zones
Sell breakout
If you like , give thumbs up and follow ,
Many Thanks
#Stay_Home

EURCAD broke Ending Diagonal 🦐EURCAD broke Ending Diagonal (descending wedge) and now We are waiting for retest and our signals to place a nice order.
It could be the third Elliot's wave (impulsive)

USDJPY analysisThis pair may provide a nice Long entry as soon as it completes an ending diagonal in wave C
So far at m15 we have got a flat structure, implying the continuation to the downside

XLM WEEKLY - It made it!XLM took me by surprise this week with a surge to its ending diagonal trend line . Any further upside this week to the 0.764 will likely be a bull trap wick, looking for the final leg down to complete the ending diagonal and then trend reversal.
XLM was one of the few major Cryptos to show Bullish divergence on the Weekly before this latest uptrend but is now showing hidden Bearish divergence.
Analysis will be blown if we surge to new higher highs from here but 360 view shows global equities and crypto running out of steam in bull trap regions.

GBPUSD Impulsive wave and correction in the 2h charthi all,
We see a clear impulsive price action to the upside out of the EDT (see reference chart / big picture).
However, the downward reaction is corrective. The depicted triangle is a good, first indication that we are in a correction.
Now price might go a bit more up to wave b and then fall impulsively below wave a.
I expect the price to stop at 38,2 % retracement (equals to wave 4 of previous Impulse).
If this last wave c is impulsive then this might be a good opp to go long.
However, bear in mind the price might retrace also lower.
Merakshi

LINK/USDT - Ending Diagonal just came across this chart this morning and it looks quite promising.
I plan to wait for the price to overthrow and then brake back into the wedge before enter my short.
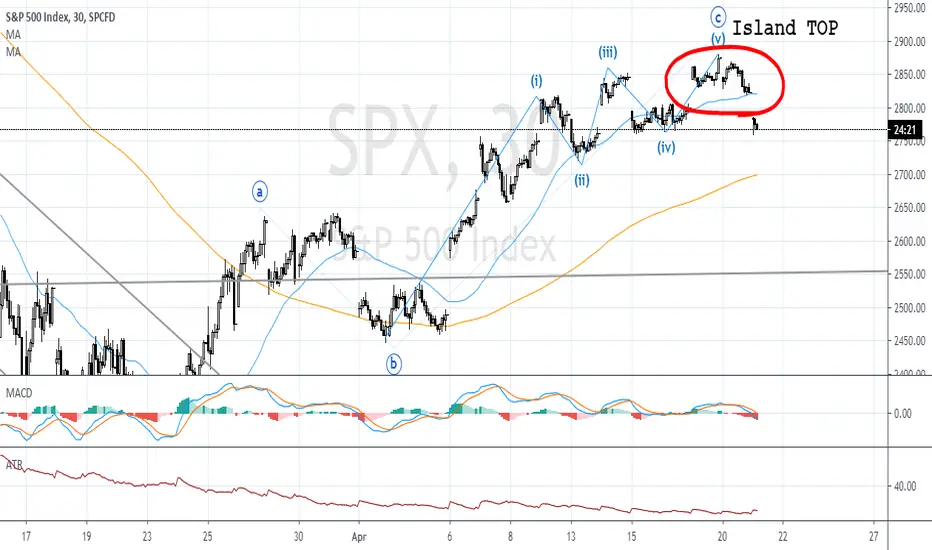
Force strikes back - Island TOPA-B-C Recovery
Ending diagonal
Diagonal break with a gap
Island TOP take place?
Pieces of evidence are clear for short. The protective stop could be at 2822, 2870.
Targets:
for V shape believer: 2500
for U shape believer: 2000 - 2300
W shape believer: 1700 - 2100
L shape believer: more
AUDCAD - Corrective phase on hourly chartThis pair is on its way to make a move down after making a clear ending diagonal pattern of wave 5.
Already short on this one at around 0.89700

After the coronavirus shock will the next leg come?After a 50% correction, after an A-B-C structure correction, after the breaking an Ending Diagonal I wait for a new low in S&P500.
How far will it fall? Who knows?
I expect a double bottom at least or more, but the minimum target of 2500 also would serve 3RR.
In rising correction, I will search for a short position. Aim, Aim and FIRE!
The S&P500 must not move above 2850 if this bearish reversal view is correct! but on the other hand, if the S&P500 would go above 2850 even I do not expect to see it above 2900!

Coming bed time for GBPBreak out from ending diagonal and a falling channel. Maybe come a big impulse five up.
In my view EURGBP won't fall below 0.8680 and printing above 0.8790 will put the bullish upturn on a solid base.

An ending diagonal We have a good Elliot Wave Structure
elliottwave-forecast.com
With ABC and waves 2...
Next drop leg will be wave 3

Bearish ending diagonal confirmed, target 5800This downward move is enough to change my intraday and swing trading bias to short. Chart is same as previous with target around 5800 in the green buy zone box. I actually am long term bullish on this and ultimately looking to buy if it squeezes in that box.
However that probably won't be for a few days if not a few weeks. The lower bollinger band will be both an exit area for shorts and entry area for long term buys.
I am not opening an actual short trade here yet but will be scalping in that direction and probably not updating TV with every trade I do. This is just a note of my bias.

Could reach 23 - 24$ again.A failure swing low what I would like to seem. Even I don't know which type of correction has been underway in wave 4 (it could be Triangle or Flat) but whichever it is I expect to see a downward movement to retest the low near 20$ again.
Ideally, the oil won't move above 28.24 - 29.13 resistance zone until it reaches 23 - 24$ price zone.
