USOIL My Opinion! BUY!
My dear friends,
Please, find my technical outlook for USOIL below:
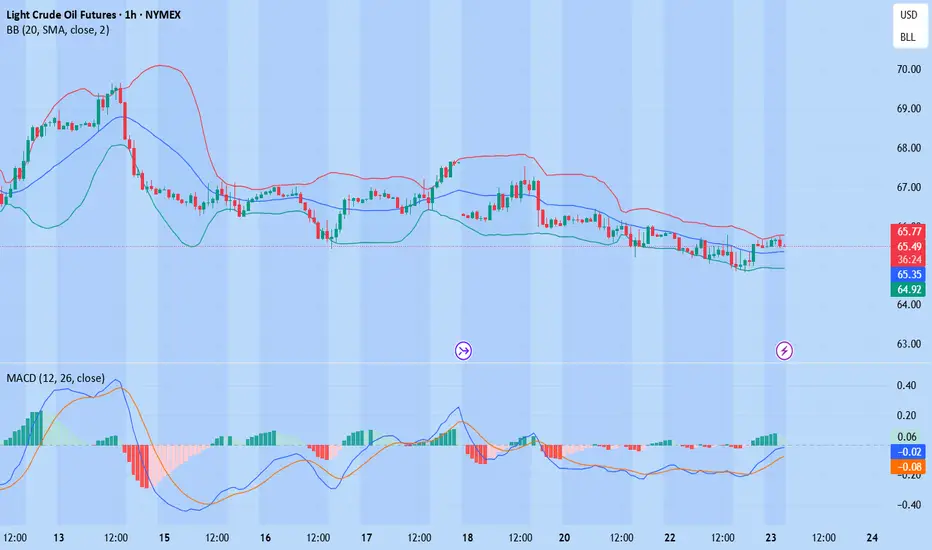
The instrument tests an important psychological level 65.00
Bias - Bullish
Technical Indicators: Supper Trend gives a precise Bullish signal, while Pivot Point HL predicts price changes and potential reversals in the market.
Target - 65.50
Recommended Stop Loss - 64.75
About Used Indicators:
Super-trend indicator is more useful in trending markets where there are clear uptrends and downtrends in price.
Disclosure: I am part of Trade Nation's Influencer program and receive a monthly fee for using their TradingView charts in my analysis.
———————————
WISH YOU ALL LUCK
Energy Commodities
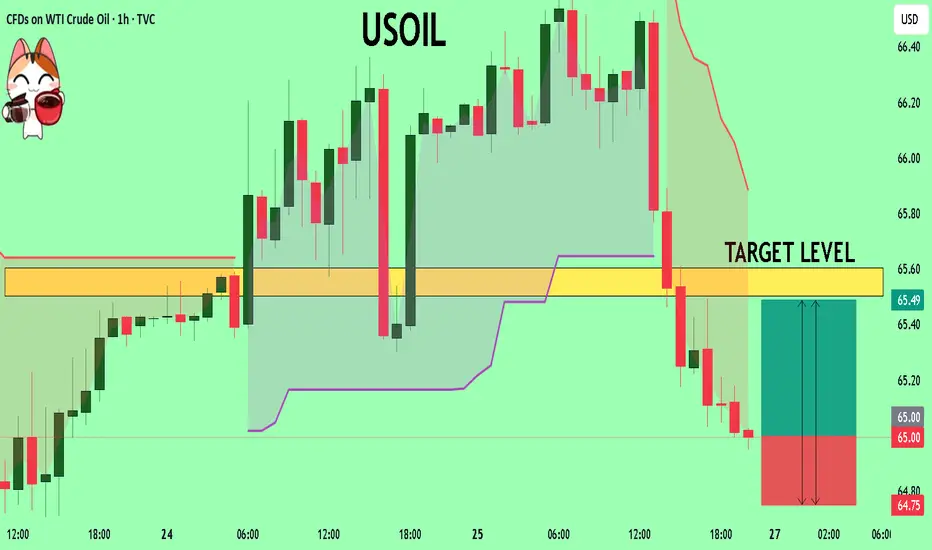
USOIL LONG FROM SUPPORT
USOIL SIGNAL
Trade Direction: long
Entry Level: 65.00
Target Level: 66.37
Stop Loss: 64.09
RISK PROFILE
Risk level: medium
Suggested risk: 1%
Timeframe: 2h
Disclosure: I am part of Trade Nation's Influencer program and receive a monthly fee for using their TradingView charts in my analysis.
✅LIKE AND COMMENT MY IDEAS✅

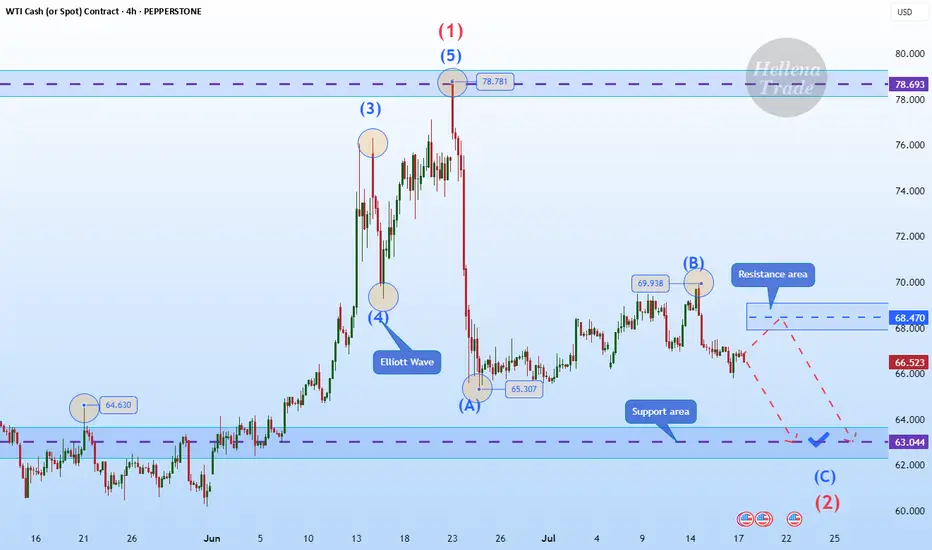
Hellena | Oil (4H): SHORT to support area of 63.000.Colleagues, I believe that wave “B” has formed at the level of 69.938, and now we expect the downward movement to continue with the aim of completing wave ‘C’ of the middle order and wave “2” of the higher order in the support area of 63,000.
It is quite possible that the price could reach the 60,000 level, but I think that for now it is worth focusing on the nearest targets.
Manage your capital correctly and competently! Only enter trades based on reliable patterns!
XNGUSD CONTINUES ITS DOWNWARD TREND. FOR HOW LONG?XNGUSD CONTINUES ITS DOWNWARD TREND. FOR HOW LONG?
Recent bearish impulse started at the beginning of this week may come to an end soon. Yesterday the U.S. Natural Gas Storage report came out. Numbers appeared to be lower than expected and lower than previous. (23b vs 28b vs 46b). This is bullish signal for the market participants. Minutes after the report came out, market reacted bullish, however, soon price went sideways.
Right now gas prices continue to decline. Still, the opportunity for short-sellers here is quite limited. Not so far below there is a level of 3.0000, form where I expect the price to rebound, supposedly to a 3.3000.
Crude oil trading reminder: triple positive support
💡Message Strategy
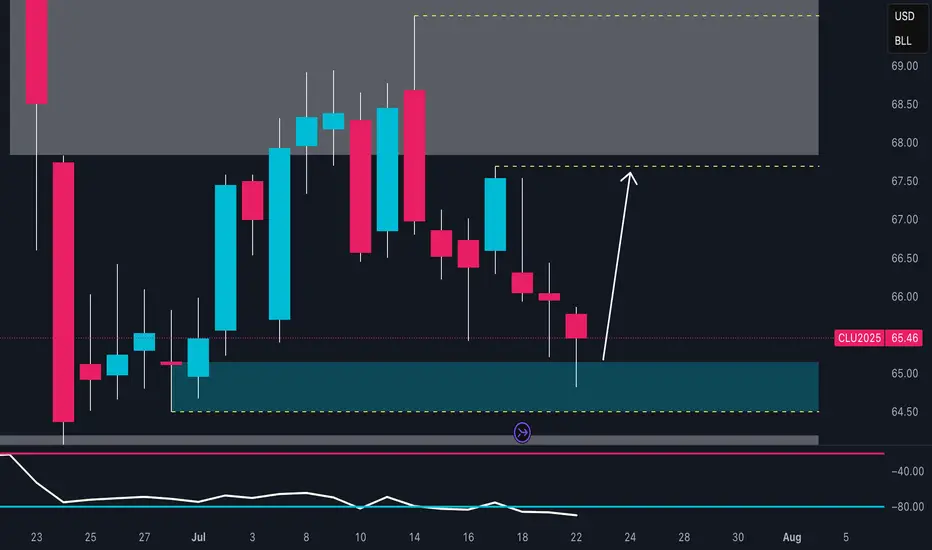
After three consecutive days of sluggishness, both U.S. and Brent crude oil remained above the 100-day moving average on Thursday (July 24). U.S. crude oil is currently up 0.4%, trading around 65.46; Brent crude oil is currently up 0.1%, trading around US$68.67 per barrel. The three engines of trade negotiations, unexpected decline in inventories, and geopolitical games are ignited at the same time. Oil prices showed signs of stabilizing, allowing bulls to "smell" the long-awaited rebound opportunity.
1. The trade war breaks the ice: the US, Japan and Europe have reached a series of agreements to ignite market hopes.
2. Inventories plummeted by 3.2 million barrels! The balance of supply and demand suddenly tilted.
3. Geopolitical black swan: The war between Russia and Ukraine burns the energy supply chain
📊Technical aspects
The short-term (4H) trend of crude oil fluctuated upward slightly. The moving average system gradually formed a bullish arrangement, and the short-term objective trend direction was upward. In terms of momentum, the MACD indicator opened upward above the zero axis, and the bullish momentum was sufficient.
In terms of form, the oil price broke through the neckline, and the head and shoulders bottom reversal pattern was established. It is expected that after the intraday crude oil trend retests the neckline position, the probability of forming another upward rhythm is high.
💰Strategy Package
Long Position:65.50-66.50,SL:64.00,Target:67.75-68.00

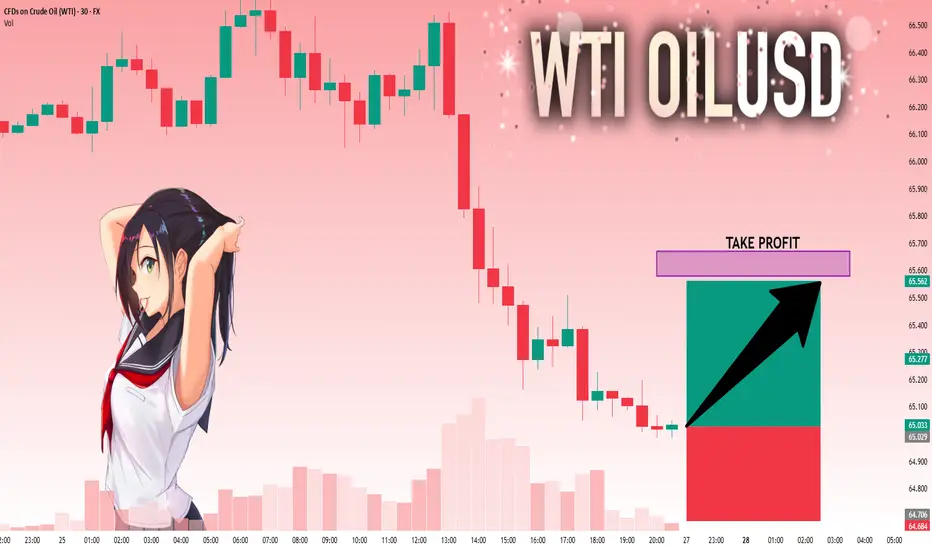
USOIL: Next Move Is Up! Long!
My dear friends,
Today we will analyse USOIL together☺️
The market is at an inflection zone and price has now reached an area around 65.029 where previous reversals or breakouts have occurred.And a price reaction that we are seeing on multiple timeframes here could signal the next move up so we can enter on confirmation, and target the next key level of 65.579.Stop-loss is recommended beyond the inflection zone.
❤️Sending you lots of Love and Hugs❤️
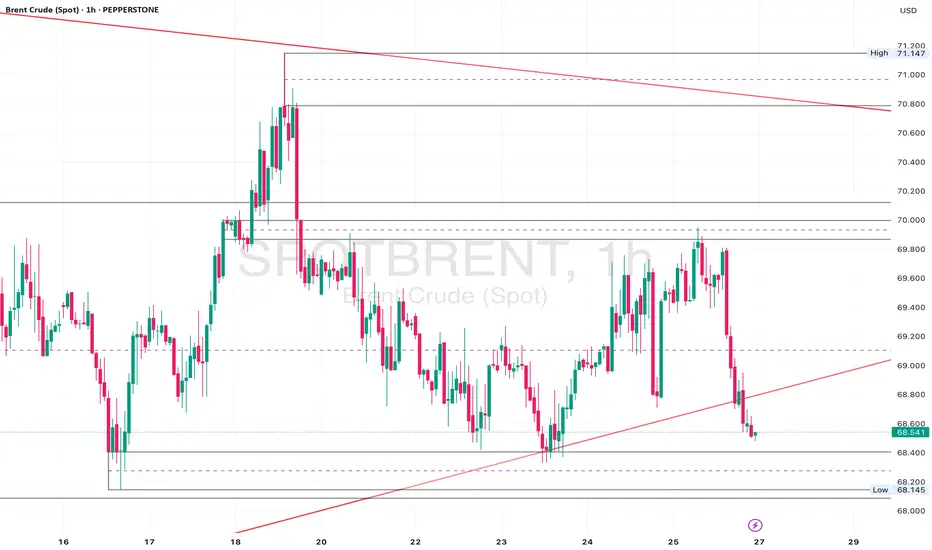
Brent Crude Sitting at Key Support – 69.20 Hold for a Rebound?Daily Analysis:
Price is holding above the ascending trendline and forming higher lows. Multiple rejections from the 68.00 region suggest strong demand. As long as we remain above the trendline, bulls stay in control.
4H Analysis:
Pullback after rejecting 71.00. Now sitting inside the 69.60–69.20 demand area. Bullish channel is still valid unless we break below 68.50.
1H Analysis:
Price broke the rising channel but is now hovering near key support. Bullish re-entry possible if lower timeframe aligns around 69.60.
Confirmation & Entry:
If we see bullish engulfing or pin bar at 69.60–69.20, this could signal a long setup back to 71.00. Invalidated on clean break below 68.50.
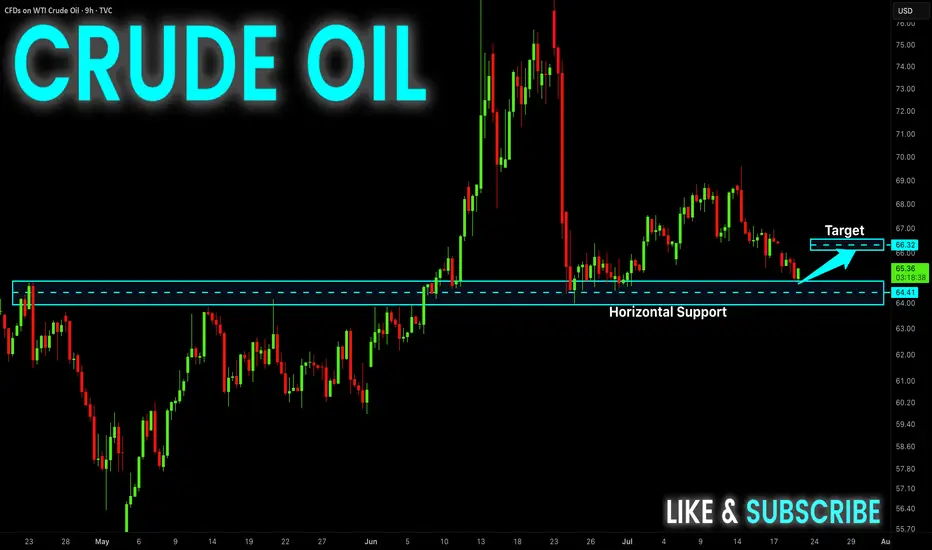
Crude oil market analysis: Crude oil has not moved much, but it Crude oil market analysis:
Crude oil has not moved much, but it is a good short-term operation opportunity. Sell small when it rebounds, sell big when it rebounds. Crude oil will basically not trap you. It is difficult to end the selling in the short term. It will basically decline in the future. You can sell when it rebounds near 67.00 today. If it breaks 64.00, it will directly dive. The daily line of crude oil has formed a shock pattern. You can sell at the break position of 64.00.
Operation suggestions:
Crude oil---sell near 67.00, target 65.00-63.00

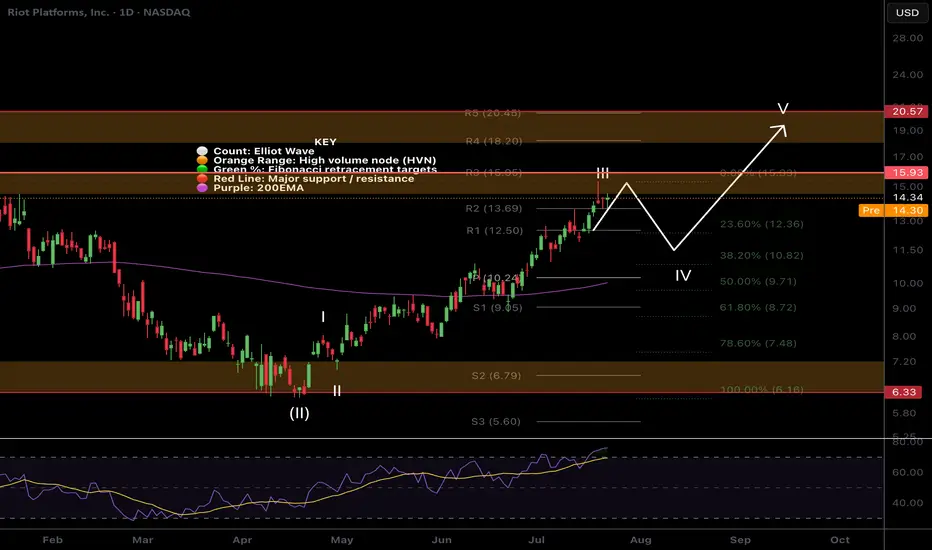
$RIOT Targets hitNASDAQ:RIOT has hit my take profit target at the High Volume Node and R3 daily pivot where it has found resistance.
Wave III appears to be complete with wave IV expected targets being the 0.382-0.5 Fibonacci retracement, also the daily pivot point and ascending daily 200EMA, $10.24.
Analysis is invalidated if we continue to the upside with a new swing high. RSI is overbought no bearish divergence.
Safe trading
$IREN More downside after huge rally!NASDAQ:IREN is printing bearish divergence on the daily RSI at all tie high resistance.
An Elliot wave motif wave appears complete and wave looks underway with a shallow target of the daily pivot, 0.382 Fibonacci retracement and ascending daily 200EMA.
The daily red wick after printing a 20% start to the day is reminiscent of a blow off top in this asset trapping newbs with FOMO price discovery pump. Market behaviour in action!
Analysis is invalidated if price returns to all time high.
Safe trading

Crude oil ----- Sell near 67.50, target 65.00-63.00Crude oil market analysis:
Crude oil has been falling recently, but the decline is not large, and the rebound will not be large. Consider selling crude oil if it rebounds slightly. The crude oil idea is bearish. It is difficult for crude oil to rise sharply without fundamentals, but we insist on taking losses in operation. If there is no loss, a piece of news will make it take off directly. Crude oil focuses on 64.00 support, and suppresses 67.50 and 69.50. Consider selling opportunities when the Asian session rebounds to 67.50.
Fundamental analysis:
Tariffs have not affected the market recently, and no major news has been announced. The market is relatively calm.
Operational suggestions:
Crude oil ----- Sell near 67.50, target 65.00-63.00

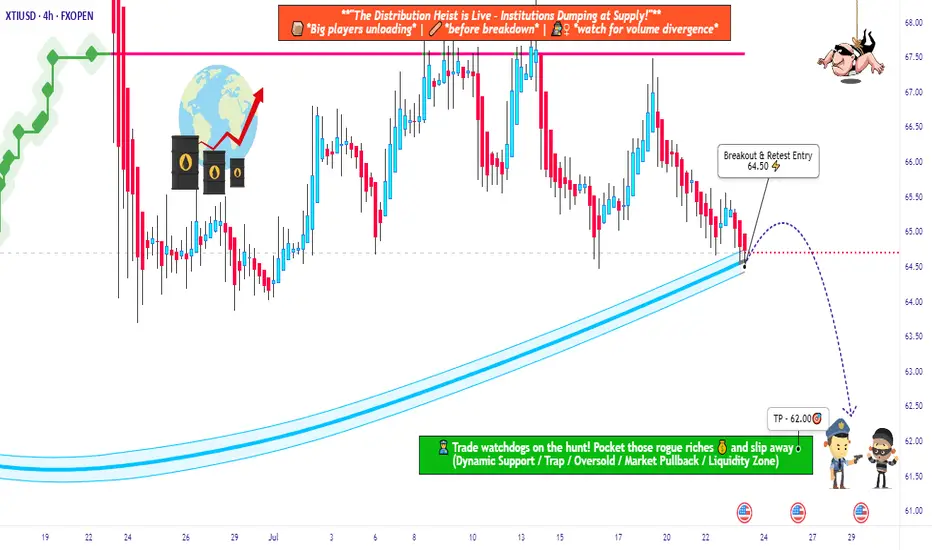
USOIL Robbery Alert! Smart Entry Plan Below Key MA Level🔐💥 “WTI Energy Heist: Thief Trader’s Bearish Master Plan” 💥🔐
The Official Robbery Blueprint for Smart Traders
🌟 Hi! Hola! Ola! Bonjour! Hallo! Marhaba! 🌟
💸 Welcome, Money Makers & Market Robbers! 💸
🚨 Get ready to break into the "US Oil Spot/WTI" market with precision-crafted bearish strategy from the one and only — Thief Trader Style!
📉💣 THE HEIST IS ON: SHORT PLAN LOADED! 💣📉
We’ve analyzed the charts using Thief Technicals + Fundamental Lockpick Tools and spotted a high-risk GREEN zone – a consolidation trap where greedy bulls usually get caught. This is where we strike.
🔑 ENTRY:
"Wait for the Neutral Moving Average to Break — Then Make Your Move!"
🎯 Focus zone: 64.50
☠️ Wait for the breakout – do NOT enter before it happens.
✅ Use sell stop orders above the MA line or place sell limit orders on the pullback after the breakout (target within the 15–30 min candle near swing high/low).
🧠 Thief Tip: Layer in entries using the DCA (layered attack strategy) to catch price on its way down. Set a chart alert so you don’t miss the strike moment.
🛑 STOP LOSS:
"Set it smart or don’t set it at all — you choose the fire you want to play with!"
📍 SL only gets placed AFTER breakout.
🎯 Recommended SL at 66.00 on the 4H swing level.
☠️ DO NOT place any orders or SL before confirmation breakout.
📊 Your SL depends on your risk %, lot size, and number of entries stacked.
🎯 TARGET ZONE: 62.50
💸 Lock profits before the bulls wake up. This level is based on market exhaustion zones and historical bounce areas.
🧠 WHY WE'RE SHORTING THIS?
This isn’t just a chart move — it’s backed by full-scale robbery research:
📰 COT Reports
📈 Macro & Seasonal Trends
🛢️ Crude Oil Inventories
💹 Sentiment & Intermarket Correlation
📉 Supply-Demand Dynamics
📚 Before pulling the trigger, educate yourself with the fundamentals. Dive into COT, Seasonal, and Macro reports. Don’t rob blindly — rob smart.
⚠️ Risk Management Alert:
Major news releases? Step back.
Trailing stops? Lock it in.
Position sizing? Know your risk.
Trade like a professional robber, not a street pickpocket.
💥💖 SUPPORT THE ROBBERY PLAN 💖💥
🧨 Smash that BOOST button to support this trading style and help more traders rob the market clean. Every like, every boost makes this community stronger.
💬 Drop a comment, share your entry levels, or post your winning trades.
This is a trading crew – we rob together, we profit together.
🔔 Stay tuned — more heist plans dropping soon.
Until then... Rob Smart. Trade Hard. Take Profits. 💰💪🎯
"NATURAL GAS PRICE THEFT IN PROGRESS – JOIN THE HEIST!"🔥 XNG/USD HEIST – BEARISH LOOT AWAITS! SWIPE & ESCAPE BEFORE THE COPS ARRIVE! 🔥
🌍 Greetings, Fellow Market Robbers! (Hola! Oi! Bonjour! Hallo! Marhaba!) 🚔💸
🚨 Mission Briefing:
Based on 🔥Thief Trading Intelligence™🔥, we’ve identified a prime robbery opportunity in the XNG/USD (Natural Gas) Energy Market. Our Bearish Heist Plan is locked & loaded—long entries are a trap, and the real loot lies in the downside escape.
🎯 Heist Strategy:
Entry (Swipe the Loot!) 🏦
"The vault is cracked! Bears are distracted—time to steal!"
Sell Limit Orders preferred (15m-30m pullback entries).
DCA/Layering Strategy for maximum loot efficiency.
Stop Loss (Escape Route) 🚨
SL at nearest swing high (4H basis) – 3.480 (Day/Swing Trade)
Adjust based on risk tolerance, lot size, & number of orders.
Target (Police Evasion Zone) 🎯 2.900 (or earlier if cops close in!)
🔪 Scalpers’ Quick Heist:
Short-side scalp ONLY!
Big money? Go direct. Small stack? Join the swing robbers.
Trailing SL = Your Getaway Car! 🚗💨
⚡ Why This Heist? (Bearish Forces at Play)
Fundamentals: Oversupply, weak demand, storage glut.
Technicals: Overbought, trend exhaustion, reversal signals.
Sentiment: Bulls are overconfident—perfect trap setup!
📰 Breaking News Alert (Stay Sharp!)
High-impact news = Volatility spikes!
Avoid new trades during releases.
Trailing SL = Your Shield. (Lock profits before the cops raid!)
💥 BOOST THIS HEIST!
👉 Hit LIKE & FOLLOW to fuel our next robbery! More loot = More strategies! 🚀💰
⚠️ WARNING (Legal Escape Plan):
Not financial advice!
Your risk, your loot.
Markets change—adapt or get caught!
🤑 NEXT HEIST COMING SOON… STAY TUNED, ROBBERS! 🐱👤🔥

Crude oil-----sell near 66.00, target 65.00-63.00Crude oil market analysis:
The recent daily crude oil line has been fluctuating slightly. It is still bearish to sell at a high price. Crude oil is unlikely to rebound or rise sharply without fundamental support. The hourly crude oil suppression position is 66.40 and 67.50. Today we are close to 66.00 to consider selling opportunities. The daily moving average of crude oil is starting to go down. If 64.00 is broken, it will start to fall sharply.
Operational suggestions
Crude oil-----sell near 66.00, target 65.00-63.00

WTI(20250723)Today's AnalysisMarket news:
White House officials plan to visit the Federal Reserve headquarters on Thursday local time.
Technical analysis:
Today's buying and selling boundaries:
65.22
Support and resistance levels:
66.22
65.85
65.61
64.84
64.60
64.22
Trading strategy:
If the price breaks through 65.61, consider buying, the first target price is 65.85
If the price breaks through 65.22, consider selling, the first target price is 64.84
XNGUSD Technical Update – What the Chart Is Telling Us NowIn this video, I break down the current XNGUSD (Natural Gas) chart using pure price action analysis on the daily timeframe.
This update builds on my previous post, where I shared a comprehensive outlook supported by fundamentals, including supply/demand imbalances, geopolitical risks, and long-term LNG export growth.
In this video, I focus purely on the technical picture—highlighting key levels, market structure, recent consolidation, and where I see potential opportunities unfolding next.
📈 If you're trading or investing in Natural Gas, this is a must-watch update to stay in tune with the current market dynamics.
Remember: This is not financial advice. Always do your own research and manage risk appropriately.

A Sleeping Giant in the Energy Sector?While everyone’s chasing the next hot AI stock, a quiet opportunity might be taking shape in the energy sector; and it could be a big one.
🔋 As AI data centers explode in size and number, the demand on our power grid is rising fast. Nuclear is still years away, and renewables are struggling to scale in time. That leaves oil and gas as the most reliable players; and one U.S. company may be perfectly positioned to ride that wave.
📊 Technical Analysis
NASDAQ:PROP PROP has been in a steady downtrend, moving within a falling wedge pattern (marked in green). Right now, it’s retesting the bottom of that wedge, typically where things get oversold.
Even more interesting, PROP bounced off a major monthly demand zone last week, a signal that buyers may be stepping in.
In the short term, if the blue demand zone holds, we could see a push toward the $7 mark, which lines up with the top of the wedge.
But to really confirm a medium-term reversal, we’ll need a clean break above the $8.3 resistance. If that happens, the door could open to a rally toward $15, a key level from early 2024.
🛢️ Why PROP? A Hidden Play With Room to Run
Prairie Operating Co. (NASDAQ: PROP) isn’t your typical small-cap oil stock. They own 65,000 acres in Colorado’s DJ Basin and use modern drilling tech to stay lean and efficient. That means they can still make money even when oil prices dip.
As energy demand continues to climb, PROP could be sitting in the sweet spot , especially with the world so focused on tech stocks. But behind every AI boom is a growing energy need, and companies like PROP are the ones powering it.
One well-known Wall Street firm recently gave PROP a Buy rating with a $21.75 price target; that’s a potential 281% upside from where it stands today. And that’s not even counting the potential boost from energy-friendly policies under the current administration.
📌 One to Watch in 2025
PROP might just be one of the most under-the-radar energy plays going into the new year.
The biggest moves often start quietly; and this one has all the ingredients to surprise.
➡️ As always, speak with your financial advisor and do your own research before making any investment decisions.
📚 Always follow your trading plan => including entry, risk management, and trade execution.
Good luck!
All strategies are good, if managed properly.
~ Richard Nasr

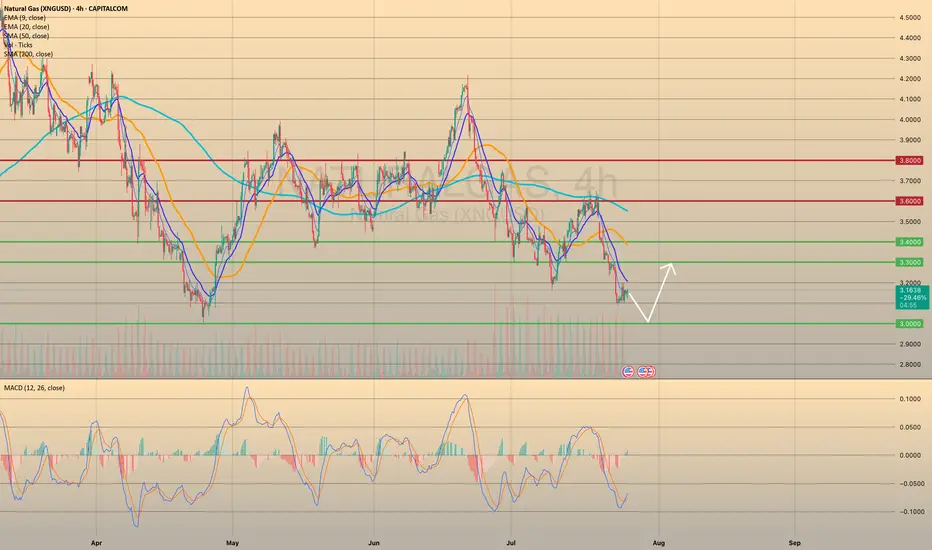
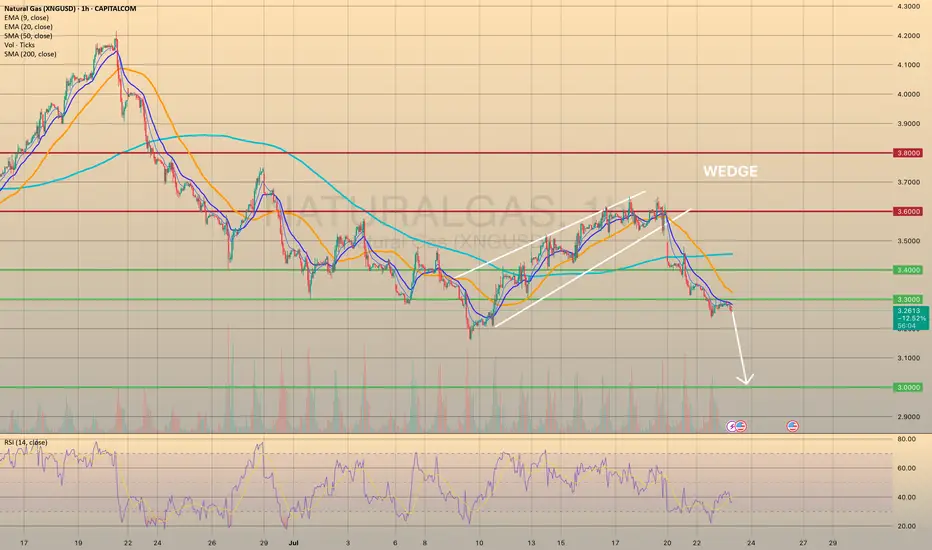
XNGUSD PULLED BACK FROM 3.3000 RESISTANCE LEVEL. WHERE TO GO NEXXNGUSD PULLED BACK FROM 3.3000 RESISTANCE LEVEL. WHERE TO GO NEXT?
This Monday natural gas prices have successfully broken down bearish wedge formation. As we may observe, the price went down through all major support levels, establishing a new short-term bearish trend. Recently the price broke through the 3.3000 and successfully retested it. It is crucial, due to this level is the last mid-term major support before the 3.000.
Additionally, the weather in the vast area U.S. is supposed to be milder at the end of July - beginning of August, which would curb nat-gas demand from electricity providers for air conditioning usage. To sum up, the decline towards 3.000 level is expected.
USOIL POTENTIAL LONG|
✅CRUDE OIL has retested a key support level of 65.00$
And as the pair is already making a bullish rebound
A move up to retest the supply level above at 66.27$ is likely
LONG🚀
✅Like and subscribe to never miss a new idea!✅
Disclosure: I am part of Trade Nation's Influencer program and receive a monthly fee for using their TradingView charts in my analysis.

Crude Oil Rebound Incoming? Key Demand Zone 📈 1. Technical Analysis – Daily Chart (CL1!)
The price has returned to a demand zone between 64.60 and 65.30, an area that previously triggered strong bullish reactions.
The July 22nd candle shows a clear lower wick, indicating potential buyer absorption and a possible short-term reversal.
The next key resistance lies between 67.80 and 68.80, which aligns with a well-defined supply zone.
Daily RSI remains weak but shows signs of bullish divergence, suggesting potential accumulation.
Bias: bullish from current levels, targeting 67.50 – 68.00. Invalidation on a daily close below 64.40.
2. Institutional Sentiment – COT Report (CFTC, July 15, 2025)
Non-Commercials (Speculators)
Long: 308,915 (↓ -24,223)
Short: 146,488 (↑ +22,724)
Net Position: sharply declining → bearish divergence in speculative sentiment
Commercials (Hedgers)
Long: 857,803 (↑ +66,342)
Short: 1,046,199 (↑ +18,118)
Net Position: still negative, but improving → reduced hedging = less downside pressure
📉 Interpretation:
Funds are closing longs and adding shorts, showing bearish positioning. However, commercials are slowly reducing their hedging exposure, which could indicate short-term stabilization if the technical support holds.
3. Seasonality
Periods analyzed: 20, 15, 10, 5, and 2 years
July historically shows negative average returns:
-0.71% (20Y)
-1.26% (15Y)
-1.37% (10Y)
The seasonal pattern indicates continued cyclical weakness into August.
📌 Interpretation:
The summer period typically brings seasonal bearish pressure, which aligns with current 2025 performance.
🌐 4. Macro & Fundamentals
EIA inventory builds for 3 consecutive weeks → demand weakness in the U.S.
No additional OPEC+ cuts announced → supply remains ample
Stable inflation data in the U.S. and China → no uptick in energy demand
Overall macro data is neutral with a slightly bearish short-term bias
USOIL Long From Support! Buy!
Hello,Traders!
USOIL made a retest of
The horizontal support
Level of 64.86$ from where
We are already seeing a bullish
Reaction so we will be expecting
A further local move up
Buy!
Comment and subscribe to help us grow!
Check out other forecasts below too!
Disclosure: I am part of Trade Nation's Influencer program and receive a monthly fee for using their TradingView charts in my analysis.
WTI OIL Extreme 1D MA50-200 squeeze to deliver break-out!WTI Oil (USOIL) has been consolidating for almost the past 30 days within the 1D MA50 (blue trend-line) and 1D MA200 (orange trend-line). The squeeze is now so tight that the trend will be revealed soon with a break-out.
Based on the 2-year Channel Down, that should be bearish, resembling the May 2024 consolidation that broke downwards and almost hit the 0.786 Fibonacci retracement level. Notice also the similar Sell Zone rejection on the 1W RSI.
As a result, we expect WTI to decline and target $61.00.
-------------------------------------------------------------------------------
** Please LIKE 👍, FOLLOW ✅, SHARE 🙌 and COMMENT ✍ if you enjoy this idea! Also share your ideas and charts in the comments section below! This is best way to keep it relevant, support us, keep the content here free and allow the idea to reach as many people as possible. **
-------------------------------------------------------------------------------
Disclosure: I am part of Trade Nation's Influencer program and receive a monthly fee for using their TradingView charts in my analysis.
💸💸💸💸💸💸
👇 👇 👇 👇 👇 👇

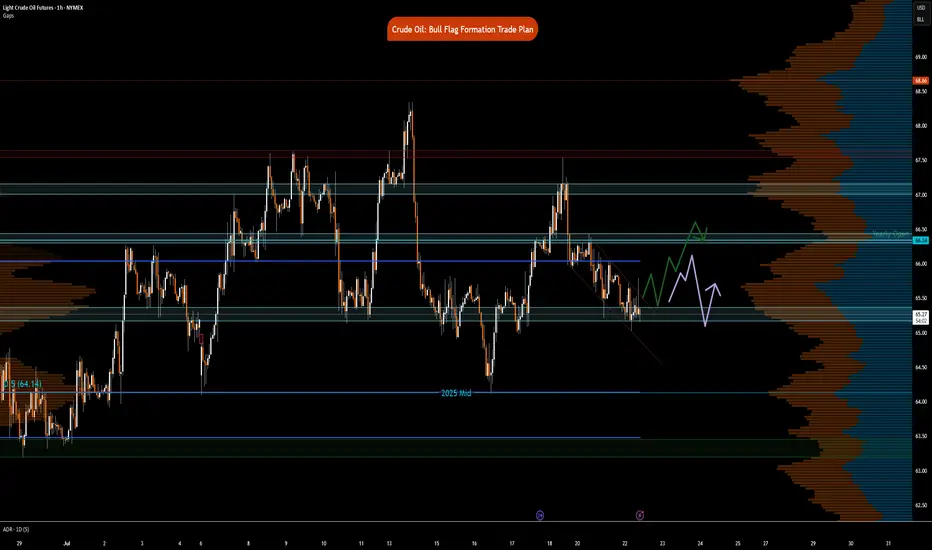
Crude Oil- Bull Flag formation Trade PlanNYMEX:CL1! NYMEX:MCL1!
Big Picture:
Let the price action and market auction be your guide
What has the market done?
The market has consolidated and pushed higher. There is an excess high at 67.87 from July 14th RTH. Market pushed lower, leaving behind excess with single prints above this showcasing strong area of resistance.
What is it trying to do?
The market is accepting prices in this range and building value. It has been in price discovery mode with a multi-distribution profile since June 24th.
How good of a job is it doing?
The market is currently forming a bull flag formation and attempting to push higher on the hourly time-frame.
What is more likely to happen from here?
Key Levels:
Neutral Zone 1: 67.16-67
Neutral Zone 2 : 66.45-66.30
Yearly Open: 66.34
Neutral zone 3 : 65.23-65.03
2025- Mid Range : 64.14
Scenario 1: False break, pull back and push higher
In this scenario, we expect prices to attempt to break bull flag formation, fail, however, neutral zone 3, acts as support for buyers to step back in to push prices towards yearly open and neutral zone 2.
Scenario 2: Break but fail to sustain push higher
In this scenario, we expect prices to break out of bull flag formation, however, fail around the 66 zone. Price reverts lower towards neutral zone 3 to further consolidate.