Brent and WTI: Is $100 oil just Around the corner?#Brent and #WTI prices are steadily climbing, now reaching $73.30 and $71.15 per barrel. The market is showing strong signs of an upward trend, similar to what we saw in 2021–2022. With global demand picking up and increased interest from major market participants, analysts believe prices could soon push past the $100 mark — especially amid ongoing global tensions and rising consumption.
Standard Chartered forecasts Brent reaching $95 by December 2025, while some outlooks go even higher. What’s fueling this potential rally? Top 5 reasons oil may surge in the coming months:
Global instability : Tensions in the Middle East and unrest in key producers like Venezuela and Nigeria raise concerns about supply disruptions. Any flare-ups could push prices to $90, $95 — or beyond.
Economic recovery : Asia and developing economies are bouncing back fast. With industrial activity rising, so does energy demand — including for oil.
OPEC+ tight supply policy : OPEC+ is likely to maintain production cuts to support prices and keep the market balanced.
Low reserves, limited expansion : Stockpiles remain tight, and exploration has lagged in recent years. If demand spikes, producers may struggle to scale output quickly.
Aviation and petrochemicals rebound : Global air traffic and plastic manufacturing are growing, increasing demand for jet fuel and oil-based feedstocks.
Together, these factors create a strong setup for upward momentum in Brent and WTI prices. According to FreshForex analysts , the current levels could mark the beginning of a new growth cycle.
Energy Commodities

Crude Oil Tests $74FenzoFx—Crude Oil climbed to $74.0, testing the bearish Fair Value Gap and a high-volume zone.
The Stochastic Oscillator signals an overbought market, suggesting possible consolidation. Oil could dip toward the previous daily low if $74.0 holds as resistance during the NY session.
A breakout above $74.0 would invalidate the short-term bearish outlook.

The latest long - short trading recommendations for crude oil.On Monday, the two benchmark oil prices fell by more than 1% due to media reports that Iran might seek to ease the situation. However, the market's short-term optimism proved unsustainable. Currently, oil price movements are driven primarily by geopolitics rather than fundamentals. Market sensitivity to the Middle East situation has surged to an extremely high level, with even the slightest development triggering violent volatility. The possibility of supply disruptions remains high in the short term, and close attention should be paid to Iran's oil export trends and the actual execution of OPEC+ after its meeting. Meanwhile, be wary of the risk of sharp consolidation amid mixed geopolitical and negotiation news.
In terms of momentum, the fast and slow lines of the MACD indicator have crossed below the zero axis, forming a golden cross with an upward divergence, indicating a stalemate between bullish and bearish momentum. In terms of patterns, a flag continuation pattern has emerged, with penetration of the upper edge of the flag, and the overall trend is in a secondary rhythm. It is expected that crude oil prices will mainly fluctuate and consolidate within the pattern.
you are currently struggling with losses,or are unsure which of the numerous trading strategies to follow,You have the option to join our VIP program. I will assist you and provide you with accurate trading signals, enabling you to navigate the financial markets with greater confidence and potentially achieve optimal trading results.
Trading Strategy:
buy@70.0-71.0
TP:74.0-75.0
Time for a Rise in Oil Prices $$$When analyzing the recent movements in oil prices through the lens of Elliott Wave Theory, it appears that the current structure is completing an ABC corrective formation.
Initially, the A wave has developed as a strong upward 1-5 impulse structure.
The B wave evolved through a classic ABC correction, pushing prices down to the support area marked as (B).
Following this correction, early signals indicate the initiation of the C wave.
In this context, the technical structure suggests a potential new upward momentum in oil prices with the activation of the C wave. The target zone for the C wave should be monitored in consideration of the existing trendlines and historical resistance levels.
Nevertheless, under the current market conditions characterized by high volatility, it is critical to monitor volume and momentum indicators to confirm the C wave and ensure key support levels are maintained.

Crude Oil - Cup and HandlePotential Cup and Handle
I have a trigger upper the top .. potential short before the new long wave
Actual we can have completed the 3 of 5.

Brent OilGiven the conflicts in the Middle East, I think oil could reach $90. I hope that doesn't happen. What do you think? This is my analysis of oil. I think the upward trend will continue.


WTI OIL Overbought RSI = best time to sell!WTI Oil (USOIL) has been trading within a 2-year Channel Down pattern and due to the recent Middle East geopolitical tensions, the price catapulted near its top (Lower Highs trend-line).
That made the 1D RSI overbought (>70.00) and every time that took place since September 2023, the pattern priced its Lower High and started a Bearish Leg. As a result, an overbought 1D RSI reading has been the strongest sell signal in the past 2 years.
The 'weakest' Bearish Leg after such sell signal has been -25.29%. As a result, we have turned bearish on WTI again, targeting $58.20 (-25.29%).
-------------------------------------------------------------------------------
** Please LIKE 👍, FOLLOW ✅, SHARE 🙌 and COMMENT ✍ if you enjoy this idea! Also share your ideas and charts in the comments section below! This is best way to keep it relevant, support us, keep the content here free and allow the idea to reach as many people as possible. **
-------------------------------------------------------------------------------
Disclosure: I am part of Trade Nation's Influencer program and receive a monthly fee for using their TradingView charts in my analysis.
💸💸💸💸💸💸
👇 👇 👇 👇 👇 👇

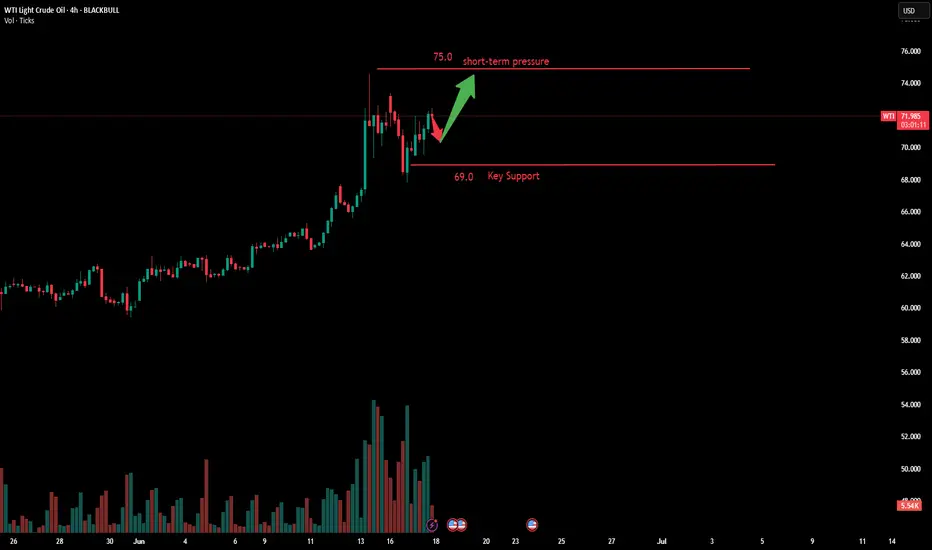
Oil Surges on Israel-Iran Nuclear Strike Fears🛢️ Israel’s attacks on Iran’s nuclear sites are pushing oil ( BLACKBULL:WTI , BLACKBULL:BRENT ) higher!
Bloomberg reports Trump’s G-7 exit and Tehran evacuation warning as Israel-Iran strikes intensify (June 17, 2025). Analysts warn of Strait of Hormuz risks, with 17M barrels/day at stake.
4H Chart Analysis:
Price Action: WTI ( BLACKBULL:WTI ) broke $75 resistance (June 2025 high), exiting a 3-week range. Brent ( BLACKBULL:BRENT ) mirrors at $78.
Volume: 4H volume spiked 15% vs. prior week, confirming breakout buying.
Key Levels:
Current Support: $75 (WTI), $78 (Brent) – former resistance, now support.
Next Support: $73 (WTI), $76 (Brent) – prior range lows, tested twice in June.
Context: Oil gained 2% this week, driven by Middle East supply fears, with WTI at a 1-month high.
Trading Insight: The $75/$78 breakouts signal bullish momentum. $73-$76 is a key support zone for dips. Watch Iran retaliation news and volume for supply disruption clues.
What’s your 4H oil trade? Post your setups! 👇 #OilPrice #WTI #Brent #IsraelIran #TradingView

Crude oil---Buy near 71.00, target 76.00-79.00Crude oil market analysis:
We still buy crude oil in the recent daily line, but yesterday's crude oil daily line closed with a big negative line. Short-term crude oil is about to start repairing. The retracement during the repair is our opportunity to buy again. Crude oil follows the long-term trend. In addition, the war between Iran and Israel is a long-term support for crude oil purchases. If the situation escalates, crude oil may easily stand above the 100 mark in the later period. Consider buying crude oil at 71.00 today.
Fundamental analysis:
Yesterday, Iran and Israel began to bomb each other again, and the situation began to escalate.
Operation suggestions:
Crude oil---Buy near 71.00, target 76.00-79.00

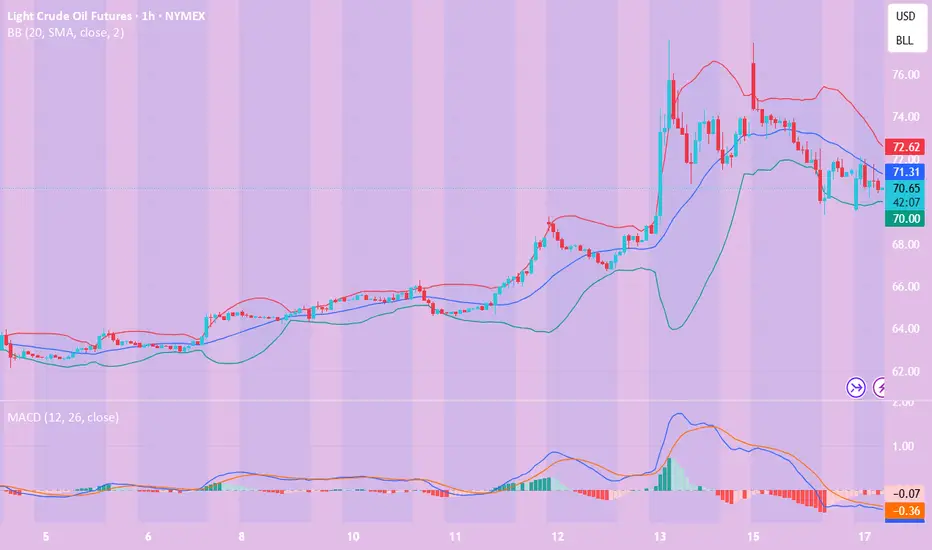
CL Futures Weekly Trade Setup — June 17, 2025🛢️ CL Futures Weekly Trade Setup — June 17, 2025
🎯 Instrument: CL (Crude Oil Futures)
📉 Strategy: Short Swing
📅 Entry Timing: Market Open
📈 Confidence: 68%
🔍 Model Insights Recap
🧠 Grok/xAI – Bearish due to overbought RSI + price stalling near MAs
🤖 Claude/Anthropic – Bearish pullback expected, despite recent strength
📊 Llama/Meta – Overextended Bollinger Band + RSI = short bias
🧬 DeepSeek – Supports downside via divergence + high volatility
⚠️ Gemini/Google – Bullish thesis based on momentum; diverges from consensus
📉 Consensus Takeaway
While short-term momentum is strong, most models forecast a pullback due to:
🔼 Overbought RSI readings
📈 Price extended well above key moving averages
🧨 High volatility and profit-taking zone near $73–$74
✅ Recommended Trade Setup
Metric Value
🔀 Direction Short
🎯 Entry Price $72.65
🛑 Stop Loss $74.20
🎯 Take Profit $68.80
📏 Size 1 contract
📈 Confidence 68%
⏰ Timing Market Open
⚠️ Key Risks & Considerations
🌍 Geopolitical events or OPEC news can cause unexpected surges
📉 If bullish momentum resumes, upside breakout could invalidate short thesis
📏 Risk management is critical—stick to stop-loss if price breaks above $74.20
🧾 TRADE_DETAILS (JSON Format)
json
Copy
Edit
{
"instrument": "CL",
"direction": "short",
"entry_price": 72.65,
"stop_loss": 74.20,
"take_profit": 68.80,
"size": 1,
"confidence": 0.68,
"entry_timing": "market_open"
}
💡 Watch price action at the open. If oil opens weak or fails to reclaim $73, this short setup has a strong edge.

WTI(20250617)Today's AnalysisMarket news:
Revised version of the Republican tax cut bill in the US Senate: It is planned to raise the debt ceiling to 5 trillion, and the overall framework is consistent with the House version.
Technical analysis:
Today's buying and selling boundaries:
70.41
Support and resistance levels:
75.98
73.90
72.55
68.27
66.92
64.84
Trading strategy:
If the price breaks through 72.55, consider buying, and the first target price is 73.90
If the price breaks through 70.41, consider selling, and the first target price is 68.27
This Just Went Nuclear - Explosive Move!Uranium prices have surged due to several key factors:
- Increased demand for nuclear energy – Many countries are expanding nuclear power to meet clean energy goals.
- Geopolitical tensions – Supply disruptions from Russia and Niger have tightened the market.
- Underinvestment in uranium mining – Years of low prices led to reduced production, creating a supply deficit.
- Government policies – The U.S. and other nations are prioritizing domestic uranium production for energy security.
- Rising uranium prices – Spot prices have climbed significantly, boosting mining stocks.
We are near some major resistance and expect some profit taking to occur.
Names Like NYSE:OKLO NYSE:SMR AMEX:URNM AMEX:URA NASDAQ:CEG should be on watch for a strong selloff.

WTI rebounds from key support as Middle East tensions intensifyThe latest escalation in the conflict between Israel and Iran initially didn't cause much panic in the oil market. After spiking initially to an overnight high of $75.70, WTI has since been on a decline, before hitting a low so far of $68.50. That represents a 9.5% drop from the overnight high, which is massive. Investors have been pricing out the risk of of oil supplies being meaningfully impacted. But the latest air strikes on Tehran and Israel declaring that it had "full aerial operational control" over Tehran means tension are rising another bombardment of Tel Aviv was most likely on the agenda for Iran. Oil has been bouncing back as a result. So far, it hasn't impacted equities, with major US indices remaining near their session highs. But will that change if oil extends it recovery?
Key support at $68.60 has been defended as we can see on the hourly chart. $70.00/$70.10 is now reclaimed, which is a bullish sign. Resistance is seen around $72.20. Above that, $73.00 will be in focus.
By Fawad Razaqzada, market analyst with FOREX.com

Crude oil continues to decline - latest market trend analysisThe international oil market is currently experiencing a classic upward cycle of "geopolitical risk premium". In the short term, oil prices will be highly sensitive to any news regarding the security of the Strait of Hormuz. Crude oil has continued its volatile upward trend in the short term, surging to test the price near $74. The moving average system is bullishly aligned with oil prices, and the objective short-term trend direction remains upward.
In early trading, oil prices hit a new high near $75.30, but then surged and fell, closing with a bearish real body K-line. The short-term momentum still favors the bulls, and it is expected that the intraday trend of crude oil will continue to maintain a high-level volatile upward rhythm.
you are currently struggling with losses,or are unsure which of the numerous trading strategies to follow,You have the option to join our VIP program. I will assist you and provide you with accurate trading signals, enabling you to navigate the financial markets with greater confidence and potentially achieve optimal trading results.
Trading Strategy:
buy@68.5.0-69.5
TP:73.0-74.0
WTI - ANALYSIS BUY AREA This week the ongoing conflict seems to bring more uptrend to this commodity
I believe that the last broken resistance now turning support at 67.300 will be tested prior to the OIL raising again
If the conflict doesn’t end and we don’t have a ceasefire we could see this commodity running to the 78.000 and 82.000 levels

Crude Oil Challenges 2-Year ChannelAmid rising summer demand, an inverted head and shoulders breakout from oversold 2020 levels, and the recent outbreak of war between Israel and Iran, crude oil has tested the upper boundary of the declining channel originating from the 2022 highs. This test comes as supply risks for the coming month intensify.
This upper boundary aligns with the $77 resistance level. A confirmed breakout and sustained hold above this level could shift momentum more decisively to the bullish side, potentially paving the way for a retest of the $80 and $83.50 levels.
On the downside, if oil fails to maintain its gains and resumes a pullback, key support zones are located around $69, $66, and $64, reestablishing bearish dominance within the channel.
— Razan Hilal, CMT

USOIL:Go long
USOIL: Short-term momentum is still dominant, the trend of crude oil is expected to maintain a high shock upward rhythm.
Trading Strategy:
BUY@70.5-71
TP: 73-73.6
↓↓↓ More detailed strategies and trading will be notified here ↗↗↗
↓↓↓ Keep updated, come to "get" ↗↗↗

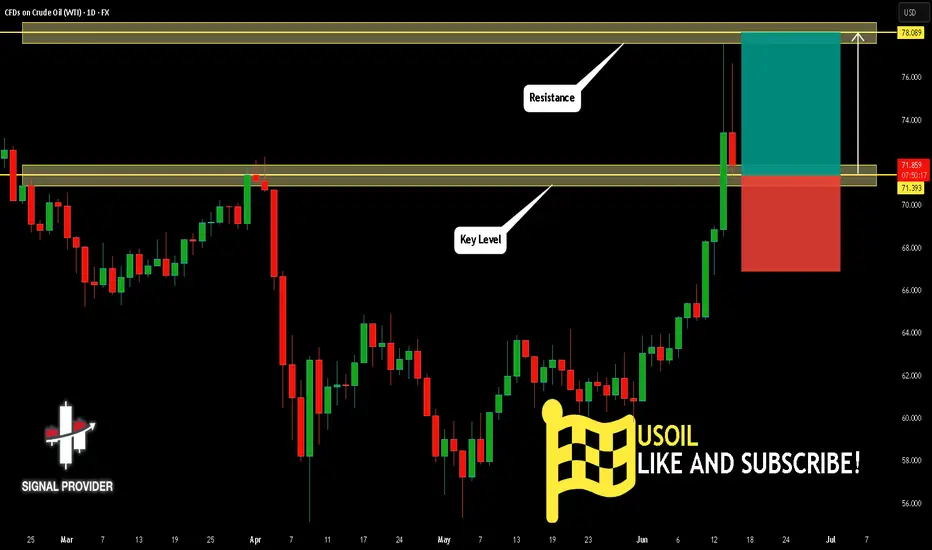
USOIL Will Move Higher! Buy!
Please, check our technical outlook for USOIL.
Time Frame: 1D
Current Trend: Bullish
Sentiment: Oversold (based on 7-period RSI)
Forecast: Bullish
The price is testing a key support 71.393.
Current market trend & oversold RSI makes me think that buyers will push the price. I will anticipate a bullish movement at least to 78.089 level.
P.S
Overbought describes a period of time where there has been a significant and consistent upward move in price over a period of time without much pullback.
Disclosure: I am part of Trade Nation's Influencer program and receive a monthly fee for using their TradingView charts in my analysis.
Like and subscribe and comment my ideas if you enjoy them!
USOIL Will Go Higher From Support! Buy!
Take a look at our analysis for USOIL.
Time Frame: 2h
Current Trend: Bullish
Sentiment: Oversold (based on 7-period RSI)
Forecast: Bullish
The market is testing a major horizontal structure 67.337.
Taking into consideration the structure & trend analysis, I believe that the market will reach 69.433 level soon.
P.S
The term oversold refers to a condition where an asset has traded lower in price and has the potential for a price bounce.
Overbought refers to market scenarios where the instrument is traded considerably higher than its fair value. Overvaluation is caused by market sentiments when there is positive news.
Disclosure: I am part of Trade Nation's Influencer program and receive a monthly fee for using their TradingView charts in my analysis.
Like and subscribe and comment my ideas if you enjoy them!

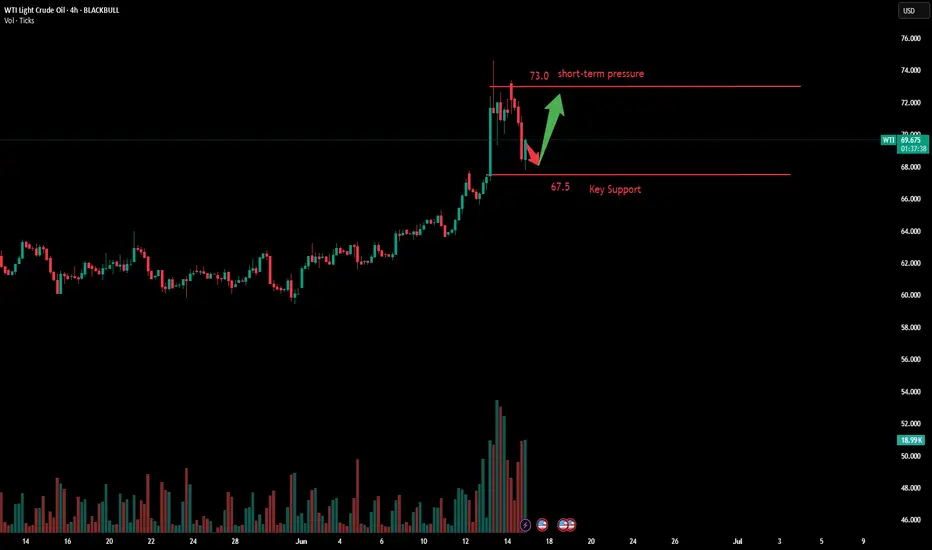
Positive market: OIL rises sharply - Important area to watch forThe recent escalation of tensions in the Middle East has had a strong ripple effect across all commodities market. Just as we observed with Gold, it’s no surprise we’ve seen oil prices climb as well, given this uncertainty.
If you’ve seen my latest Gold analysis, you’ll understand how market sentiment has turned uneasy, and in times like these are what people trust when everything else feels risky. And naturally, with everything going on, Gold is seeing stronger demand again, and I expect the price to steadily climb and reach new highs because the momentum is unmistakable.
On Friday the 13th, oil prices spiked abruptly before pulling back slightly, showing just how sensitive the market is to potential supply disruptions. What’s fueling this rally is obvious, and it’s the fear around supply from such an important oil-producing area. This creates a great opportunity to take a position.
As you can see in my analysis, the price has recently broken above a key resistance zone and may come back for a retest. If this level holds as support, it would really confirm the bullish bias and make the move towards my anticipated target of 77,50 high probability, towards the next resistance zone level at 77,50 and 79,50.
If the price remains over this support zone, my bullish outlook stays the same. But, if it doesn’t hold above this level we could see a slight pullback before another definitve move up.
In such times, it’s important to watch price action closely especially near key technical levels, and let the market show your next move.

Oil Rebounds to $59 as US Inventories Drop – Reversal Ahead?After recent declines, crude oil futures (CL1!) staged a modest recovery during Thursday’s session, trading near $59.10 per barrel. The rebound comes as US crude inventories unexpectedly dropped, easing concerns about oversupply and providing a short-term lift to prices.
Key Drivers Behind the Rebound
US Inventory Drawdown – The latest EIA report showed a decline in crude stockpiles, signaling stronger demand and helping prices stabilize.
Technical Support Holds Firm – The bounce aligns with a critical daily demand zone, which previously acted as a strong support level on the weekly chart.
Market Sentiment Shifts – While retail traders remain bearish, commercial traders (often considered "smart money") are increasing long positions, hinting at a potential trend reversal.
Traders should watch for follow-through buying to confirm whether this is a short-term correction or the start of a larger reversal.
Bottom Line: Oil’s rebound is fueled by fundamentals (lower inventories) and technicals (strong demand zone). With commercial traders betting on higher prices, the stage may be set for a bullish reversal—if buyers sustain momentum.
✅ Please share your thoughts about CL1! in the comments section below and HIT LIKE if you appreciate my analysis. Don't forget to FOLLOW ME; you will help us a lot with this small contribution.

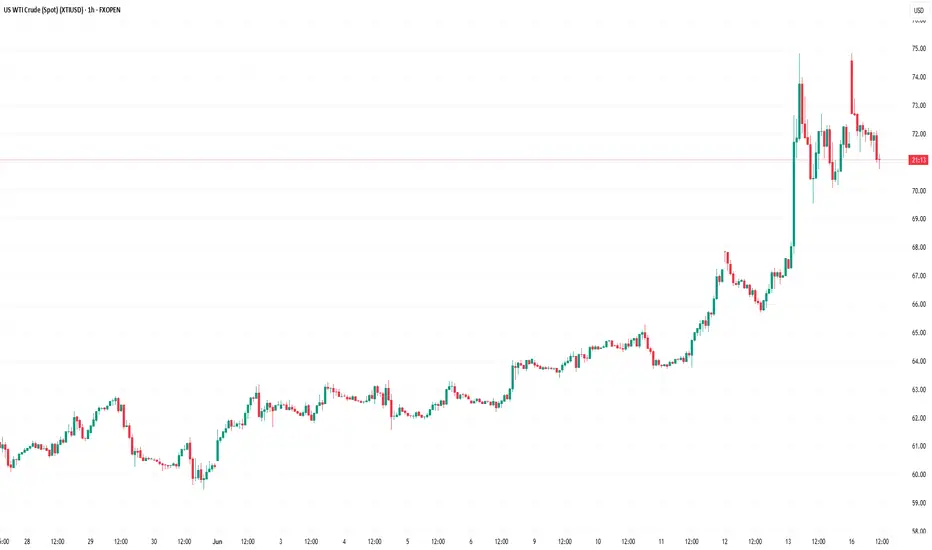
WTI Crude Oil Regains Bullish MomentumWTI Crude Oil Regains Bullish Momentum
WTI Crude oil prices climbed higher above $70.00 and might extend gains.
Important Takeaways for WTI Crude Oil Price Analysis Today
- WTI Crude oil prices started a decent increase above the $65.00 and $68.50 resistance levels.
- There is a major bullish trend line forming with support at $71.50 on the hourly chart of XTI/USD at FXOpen.
Oil Price Technical Analysis
On the hourly chart of WTI Crude Oil at FXOpen, the price started a decent upward move from $65.00 against the US Dollar. The price gained bullish momentum after it broke the $68.50 resistance and the 50-hour simple moving average.
The bulls pushed the price above the $69.50 and $71.50 resistance levels. The recent high was formed at $74.80 and the price started a downside correction. There was a minor move below the 50% Fib retracement level of the upward move from the $69.55 swing low to the $74.83 high.
The RSI is now below the 60 level. Immediate support on the downside is near the $71.50 zone. There is also a major bullish trend line forming with support at $71.50 and the 61.8% Fib retracement level of the upward move from the $69.55 swing low to the $74.83 high.
The next major support on the WTI crude oil chart is near the $69.50 zone, below which the price could test the $67.90 level. If there is a downside break, the price might decline toward $65.20. Any more losses may perhaps open the doors for a move toward the $63.75 support zone.
If the price climbs higher again, it could face resistance near $72.50. The next major resistance is near the $74.80 level. Any more gains might send the price toward the $78.50 level.
This article represents the opinion of the Companies operating under the FXOpen brand only. It is not to be construed as an offer, solicitation, or recommendation with respect to products and services provided by the Companies operating under the FXOpen brand, nor is it to be considered financial advice.