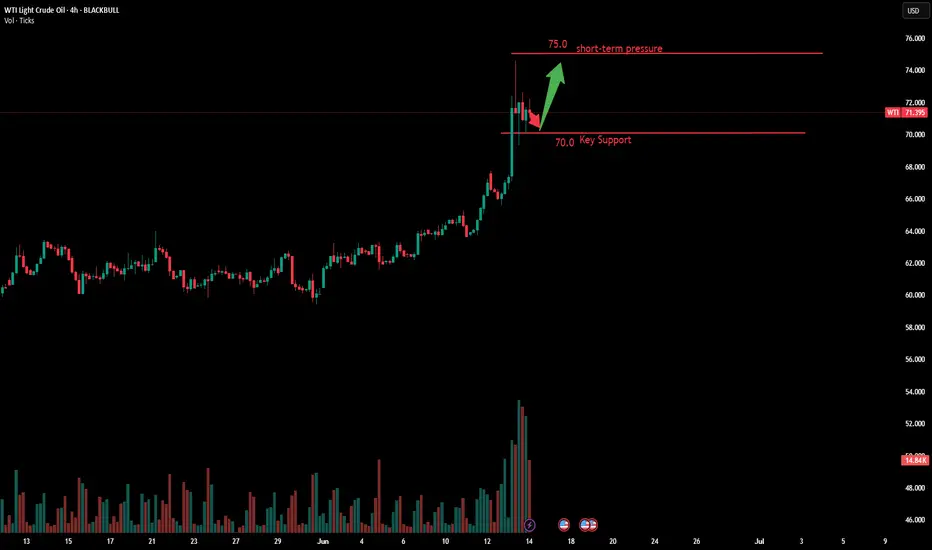
Today's Crude Oil Trend Analysis and Trading RecommendationsFrom a daily chart perspective, the violent rally in USOIL driven by external factors has completely disrupted prior technical expectations. The sharp surge has also significantly exhausted future upside potential, explaining today's gap-up and subsequent decline. With minimal likelihood of near-term de-escalation in the Iran situation, USOIL is likely to remain bullish. However, severe overbought conditions on technical charts have disrupted structural expectations, necessitating a price correction.
Technically, the $70-$75 range serves as a reasonable short-term consolidation zone, contingent on no severe escalation in Iran tensions. Given the high probability of worsening tensions, USOIL may retest $75 and even challenge $80 driven by geopolitical developments.
Thus, while the market remains focused on Iran-related risks, the short-term bias remains bullish. Avoid chasing the rally recklessly. Focus on the $70.5-$71.5 pullback zone early in the week—consider long entries only after price consolidation in this area.
USOIL
buy@70.50-71.50
tp:74-76-78
Investment itself is not the source of risk; it is only when investment behavior escapes rational control that risks lie in wait. In the trading process, always bear in mind that restraining impulsiveness is the primary criterion for success. I share trading signals daily, and all signals have been accurate without error for a full month. Regardless of your past profits or losses, with my assistance, you have the hope to achieve a breakthrough in your investment.
Energy Commodities

WTI Oil H1 | Potential bullish bounceWTI oil (USOIL) is falling towards a multi-swing-low support and could potentially bounce off this level to climb higher.
Buy entry is at 71.83 which is a multi-swing-low support.
Stop loss is at 68.50 which is a level that lies underneath a pullback support and the 50% Fibonacci retracement.
Take profit is at 77.60 which is a swing-high resistance.
High Risk Investment Warning
Trading Forex/CFDs on margin carries a high level of risk and may not be suitable for all investors. Leverage can work against you.
Stratos Markets Limited (tradu.com ):
CFDs are complex instruments and come with a high risk of losing money rapidly due to leverage. 63% of retail investor accounts lose money when trading CFDs with this provider. You should consider whether you understand how CFDs work and whether you can afford to take the high risk of losing your money.
Stratos Europe Ltd (tradu.com ):
CFDs are complex instruments and come with a high risk of losing money rapidly due to leverage. 63% of retail investor accounts lose money when trading CFDs with this provider. You should consider whether you understand how CFDs work and whether you can afford to take the high risk of losing your money.
Stratos Global LLC (tradu.com ):
Losses can exceed deposits.
Please be advised that the information presented on TradingView is provided to Tradu (‘Company’, ‘we’) by a third-party provider (‘TFA Global Pte Ltd’). Please be reminded that you are solely responsible for the trading decisions on your account. There is a very high degree of risk involved in trading. Any information and/or content is intended entirely for research, educational and informational purposes only and does not constitute investment or consultation advice or investment strategy. The information is not tailored to the investment needs of any specific person and therefore does not involve a consideration of any of the investment objectives, financial situation or needs of any viewer that may receive it. Kindly also note that past performance is not a reliable indicator of future results. Actual results may differ materially from those anticipated in forward-looking or past performance statements. We assume no liability as to the accuracy or completeness of any of the information and/or content provided herein and the Company cannot be held responsible for any omission, mistake nor for any loss or damage including without limitation to any loss of profit which may arise from reliance on any information supplied by TFA Global Pte Ltd.
The speaker(s) is neither an employee, agent nor representative of Tradu and is therefore acting independently. The opinions given are their own, constitute general market commentary, and do not constitute the opinion or advice of Tradu or any form of personal or investment advice. Tradu neither endorses nor guarantees offerings of third-party speakers, nor is Tradu responsible for the content, veracity or opinions of third-party speakers, presenters or participants.

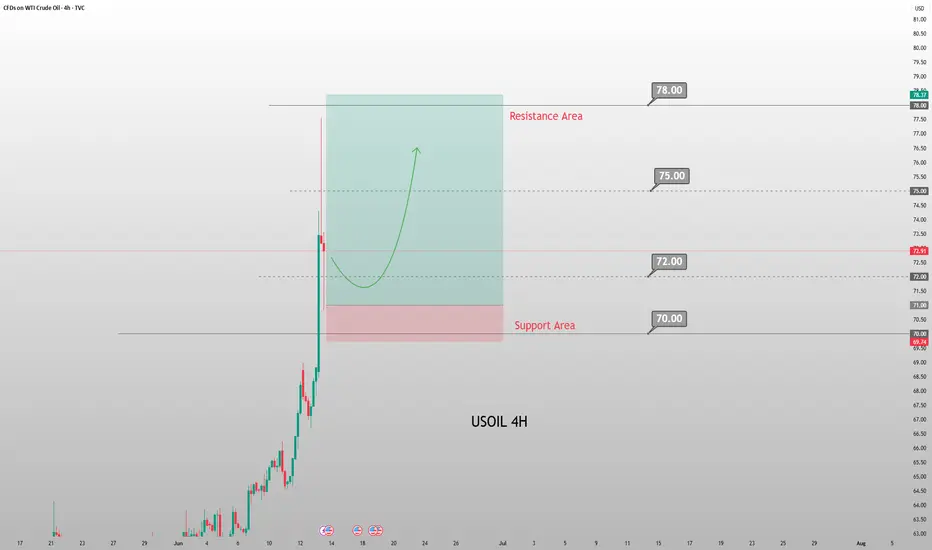
Next Week's Crude Oil Trend Analysis and Trading RecommendationsThe continued escalation of geopolitical tensions in the Middle East remains the core driver propelling oil prices higher. With U.S.-Iran relations at a critical juncture and the Ukrainian attack on the Crimean Bridge exacerbating the Russia-Ukraine conflict, markets are increasingly concerned about potential disruptions to Black Sea crude exports. As a key channel for 2% of global crude oil supplies, risks to Black Sea exports directly threaten supply chain security, triggering a surge in short-term market risk aversion and driving oil prices sustainably higher.
Since crude oil broke through the $64.8 resistance level with a solid candlestick last week, we have maintained a consistent bullish stance. After two weeks of consolidative oscillations, prices finally broke free from the trading range, fully demonstrating the dominance of bullish momentum. When oil prices pulled back to the $71.5–$72.0 range last Friday, we once again emphasized the short-term long strategy, which was subsequently followed by a sharp rally catalyzed by news developments. With the current trend clearly defined, we advise trading in line with the momentum: short-term long positions can be initiated above $71.0 at the start of the week.
USOIL
buy@71-72
tp:75-78
Investment itself is not the source of risk; it is only when investment behavior escapes rational control that risks lie in wait. In the trading process, always bear in mind that restraining impulsiveness is the primary criterion for success. I share trading signals daily, and all signals have been accurate without error for a full month. Regardless of your past profits or losses, with my assistance, you have the hope to achieve a breakthrough in your investment.
USOIL Remains Bullish Amid Geopolitical Tensions and Steady Fed USOIL – Bullish Outlook Amid Geopolitical and Policy Factors
The ongoing escalation in the Middle East, combined with Jerome Powell's stance on holding interest rates steady, continues to support bullish momentum across commodities, including oil.
Technical Outlook:
USOIL remains bullish as long as it trades above 72.72 and more firmly above 70.40, with upside potential toward 77.30 and 79.50. If bullish momentum persists, a further extension to 84.14 is possible, supported by geopolitical risks.
A bearish shift is only likely if significant de-escalation or negotiations between Israel and Iran take place.
Key Levels:
• Pivot Point: 72.90
• Resistance: 77.29, 79.50, 84.10
• Support: 66.87, 63.52, 59.00
Trend Outlook:
Bullish while price holds above 68.53

Natural Gas | Oil | Dollar | Silver | Gold Price Forecast.Natural Gas | Oil | Dollar | Silver | Gold Price Forecast.
COMEX:SI1! COMEX:GC1! NYMEX:CL1! AMEX:UNG

#202524 - priceactiontds - weekly update - wti crude oil futuresGood Day and I hope you are well.
comment: Good week for oil bulls but still a lower high below the April high 78.1. Now what? If this buying is the real thing and market is expecting higher prices for longer, the pullback will stay above 70. If bulls do that, we can expect at least a second leg up to retest 75+ or even 80+. We are seeing a full on war between Israel and Iran but you should not trade based on that. There are bulls who bought above 73 on Friday and lost Money so far.
current market cycle: trading range 54 - 78 on the weekly tf. Decent chance we are in a bull trend that could lead to 80/84 or higher.
key levels: 70 - 77
bull case: Bulls have all the arguments on their side. They now need to leave a big open gap to 69.3 and then we can do a measured move up. My lowest target for that is 80. Structure on the 1h chart is a textbook two-legged pullback and above 74.5 it’s a clear buy signal.
Invalidation is below 70.8 but can likely also be 70
bear case: Bears do not have much. They trapped late bulls on Friday and that’s a likely reason we sold off 677 ticks from the high. They need lower lows below 70.8 and close the gap to the Thursday high before the news-bomb hit. For that to happen they have to break 2 bull trend lines. I will not look for shorts on this tbh.
Invalidation is above 74.5
short term: Bullish. Maybe a bit more sideways but I have given two invalidation prices for bulls and couple of targets above. I don’t think looking for shorts makes any sense unless you are really good at scalping.
medium-long term - Update from 2025-06-15: Maybe we have seen the 2-year trading range coming to an end on Friday and we are in a new bull trend that could lead oil to 80 or higher. Right now it’s pure guesswork until we print higher highs above Friday’s 77.62. Oil above 80 is not something we have seen since end of 2023 so expect some ripples.

Crude Oil to Continue Breaking Higher HighsMiddle East Tensions Escalate Sharply: Israel Launches Preemptive Strike on Iran, Targeting Nuclear-related Facilities
Iran's state media confirmed that senior Revolutionary Guard leaders were killed in the attack, with nuclear scientists and facilities also suffering heavy damage. In the short term, geopolitical risks will continue to dominate market sentiment. Oil prices are likely to oscillate at high levels or even edge higher. From a daily chart perspective, crude oil's moving average system forms a bullish arrangement, confirming the unchanged short-term objective uptrend. The morning session K-line closes as a large bullish candlestick, aligning with the primary upward trend. The MACD indicator is bullishly diverging above the zero axis, with bullish momentum prevailing. Intraday crude oil is expected to continue breaking higher.
Humans need to breathe, and perfect trading is like breathing—maintaining flexibility without needing to trade every market swing. The secret to profitable trading lies in implementing simple rules: repeating simple tasks consistently and enforcing them strictly over the long term.
Trading Strategy:
buy@70.0-71.0
TP:74.0-75.0
CL ready for new move upBased on time fib and Feigenbaum constants, CL is closing in on the bottom for this swing, expected within marked timezone. The swing highs/lows follows the Feigenbaum projections for the last few swings. I expect a dip below $57 before a new run higher, at least to $72-73.

Nasdaq must hold its line, otherwise more downsideMarkets are on edge. The Nasdaq is hovering just above its 200-day moving average and with so much angst in the market, this line must hold. If it breaks, risk sentiment could unravel quickly, and we could see a retest of recent 2025 lows.
The trigger isn’t hard to find. Rising tensions in the Middle East are putting upward pressure on oil and energy. A sustained rally in crude would reignite inflation fears just as central banks begin easing. Powell was supposed to start cutting, but wars are always complicated.
Higher energy costs hit consumers, slow growth and force policymakers to rethink their next moves. That’s a headwind for tech and growth names.
Equities have enjoyed a solid run this year, pricing in a soft landing. But that assumption now feels shaky. Particularly for risky assets like the Nasdaq. The Dow might do better relative. The market isn’t just worried about geopolitics. It’s digesting the reality that inflation remains sticky. Bond yields are rising. Rate cuts are being pushed back. And oil isn’t helping.
If the Nasdaq holds its 200-day line, the bulls stay in control. But a break below will shift the momentum. That’s why this week matters.
We’re watching a simple but powerful signal. Stay above 20,500 and markets can stabilise. Break below, and volatility returns.
This trade is only for the brave. The story is shifting. Stay alert.
The forecasts provided herein are intended for informational purposes only and should not be construed as guarantees of future performance. This is an example only to enhance a consumer's understanding of the strategy being described above and is not to be taken as Blueberry Markets providing personal advice.

MGY: Technical Breakout + Fundamental Momentum = Quiet Winner?Magnolia Oil & Gas (MGY) is showing one of the cleanest technical breakouts in the energy sector — and the market hasn’t priced it in yet. After months of pressure, price has broken above both the 50-day and 200-day moving averages with rising volume, signaling a clear phase shift from distribution to accumulation. Recent candles confirm control shifting to the buyers, with a tight structure, rising lows, and bullish momentum building underneath resistance.
The fundamentals back the technical setup. In the latest earnings report, MGY delivered a 9.7% revenue increase, $110M in free cash flow, and continues to pay dividends with low leverage. UBS upgraded the stock with a $29 target, which aligns precisely with the post-breakout projection. Operationally, the company is expanding in key U.S. basins like Eagle Ford, while seeing growing demand from Australia and Latin America.
With oil prices pushing higher and geopolitical tensions rising, MGY stands out as a stable energy play in a volatile world. Holding above the $24.00–$24.30 zone keeps the breakout valid, with $29+ as a natural magnet for price. Most investors are still asleep on this name — but the structure is already telling a very different story.

PLAINS - LONG TERM BUY OPPORTUNITY FOR 25%+ GAINSPLAINS ALL AMERICAN PIPELINE, L.P. (PAA) has been recovering from all-time lows at $3.00 per share in 2020 with a nice upward channel forming over the past 5 years. Expect some choppy price movements around $20.00 per share but once price breaks above, the next price target is $30.00 per share over the next few years. With uncertainty and war in the middle east, oil and oil stocks can be considered great investments, especially when the U.S. decides to invest more in producing oil domestically. Don't be surprised if the rise moves faster than anticipated if more uncertainty arises in the middle east.

Buy OIL & GOLD, Sell Stocks Indices When Missiles Are Flying!In this Weekly Market Forecast, we will analyze the S&P 500, NASDAQ, DOW JONES, Gold and Silver futures, for the week of June 16-20th.
When missiles start flying in the Middle East, investors become reactively risk averse. Money goes from stocks to safe havens and oil. That's it. Expect oil prices to rise, Gold to reach new highs, and the equity markets to see more sellers than buyers.
This environment may last a few days or a few weeks. Keep an ear to the news.
Enjoy!
May profits be upon you.
Leave any questions or comments in the comment section.
I appreciate any feedback from my viewers!
Like and/or subscribe if you want more accurate analysis.
Thank you so much!
Disclaimer:
I do not provide personal investment advice and I am not a qualified licensed investment advisor.
All information found here, including any ideas, opinions, views, predictions, forecasts, commentaries, suggestions, expressed or implied herein, are for informational, entertainment or educational purposes only and should not be construed as personal investment advice. While the information provided is believed to be accurate, it may include errors or inaccuracies.
I will not and cannot be held liable for any actions you take as a result of anything you read here.
Conduct your own due diligence, or consult a licensed financial advisor or broker before making any and all investment decisions. Any investments, trades, speculations, or decisions made on the basis of any information found on this channel, expressed or implied herein, are committed at your own risk, financial or otherwise.

USOIL: Absolute Price Collapse Ahead! Short!
My dear friends,
Today we will analyse USOIL together☺️
The recent price action suggests a shift in mid-term momentum. A break below the current local range around 73.387 will confirm the new direction downwards with the target being the next key level of 72.481.and a reconvened placement of a stop-loss beyond the range.
❤️Sending you lots of Love and Hugs❤️

BRIEFING Week #24 : is Stagflation Coming next ?Here's your weekly update ! Brought to you each weekend with years of track-record history..
Don't forget to hit the like/follow button if you feel like this post deserves it ;)
That's the best way to support me and help pushing this content to other users.
Kindly,
Phil

USOIL Will Go Up From Support! Long!
Please, check our technical outlook for USOIL.
Time Frame: 12h
Current Trend: Bullish
Sentiment: Oversold (based on 7-period RSI)
Forecast: Bullish
The price is testing a key support 73.374.
Current market trend & oversold RSI makes me think that buyers will push the price. I will anticipate a bullish movement at least to 78.914 level.
P.S
The term oversold refers to a condition where an asset has traded lower in price and has the potential for a price bounce.
Overbought refers to market scenarios where the instrument is traded considerably higher than its fair value. Overvaluation is caused by market sentiments when there is positive news.
Disclosure: I am part of Trade Nation's Influencer program and receive a monthly fee for using their TradingView charts in my analysis.
Like and subscribe and comment my ideas if you enjoy them!

Israel VS Iran War: Oil Spike!Tensions between Israel and Iran have escalated dramatically, with both nations engaging in direct military strikes. Israel launched Operation Rising Lion, targeting Iran’s nuclear infrastructure, missile factories, and military personnel. In response, Iran retaliated with missile attacks on Israel, hitting Tel Aviv and wounding civilians
The conflict stems from long-standing hostilities, particularly over Iran’s nuclear program, which Israel views as an existential threat. The situation has drawn international attention, with the United States distancing itself from Israel’s actions while maintaining strategic interests in the region.
The escalation has raised concerns about a wider regional war, with analysts warning of unintended consequences and further retaliation. The global markets have also reacted, with oil prices surging amid uncertainty.

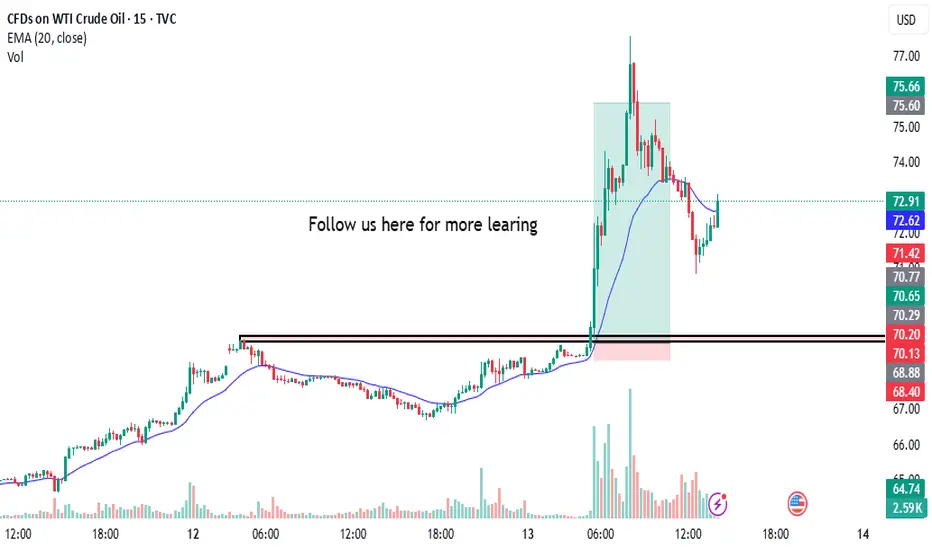
Captures 1:15 in US OIL Today i captures 1:15 in us oil
the annalysis was simple and clean as always i took trade on breakout of zone with proper research & annalysis and booom, as always we got our profit
follow us for more learing here
Israel creates a risk-off environmentThe current geopolitical tensions continue to escalate and this is creating a risk-off environment, forcing investors to worry. Let's dig in.
MARKETSCOM:OIL
TVC:USOIL
Let us know what you think in the comments below.
Thank you.
77.3% of retail investor accounts lose money when trading CFDs with this provider. You should consider whether you understand how CFDs work and whether you can afford to take the high risk of losing your money. Past performance is not necessarily indicative of future results. The value of investments may fall as well as rise and the investor may not get back the amount initially invested. This content is not intended for nor applicable to residents of the UK. Cryptocurrency CFDs and spread bets are restricted in the UK for all retail clients.

Oil Price Rally Stalls at $77.72, Just Below 2025 HighFenzoFx—Oil prices resumed their bullish trend, accelerating after geopolitical tensions in the Middle East. The rally paused at $77.72, just below the 2025 high.
RSI 14 indicates an overbought market, while volume accumulation at $73.7 suggests possible sell orders. A consolidation phase is likely before further gains.
If oil pulls back, key demand zones at $64.00 and $66.00 offer bullish opportunities, with a potential move toward the 2025 high at $80.59.

USOIL:Go long
Stay on the long side.
Trading Strategy:
BUY@71.8-72.3
TP: 74-74.3
↓↓↓ More detailed strategies and trading will be notified here ↗↗↗
↓↓↓ Keep updated, come to "get" ↗↗↗

USOIL || Geopolitical Spike Hits Major Resistance - Watch $77.77🛢️
📅 June 13, 2025
👤 By: MJTRADING
🔍 🧭 Fundamental Context – Risk Premium on the Rise:
Crude oil surged sharply today following reports of Israeli airstrikes on Iranian territory — a move that reawakens fears of broader Middle East escalation. Iran plays a crucial role in OPEC and controls the strategic Strait of Hormuz , through which ~20% of global oil passes.
While Iran has not officially responded yet, markets are pricing in the potential for:
* Military retaliation
* Disruption of oil exports or maritime routes
* Heightened volatility across global risk assets
=======================================================
📉 📊 Technical Structure – Tag of Key Resistance at $77.7:
Price exploded upward, piercing the descending channel that's been intact since mid-2022.
Today's daily wick tagged the $77.70 level, a major horizontal resistance and channel top.
This zone has repeatedly acted as a pivot in both bullish and bearish phases.
Volume confirmed the move – highest daily volume in months, suggesting institutional reaction.
💡 Trading Outlook:
🔼 Scenario A – Breakout & Close Above $77.7 = Bull Continuation
If tomorrow closes firmly above $77.70:
Target 1: $88.88 supply zone
Target 2: $90.00 psychological resistance
Setup: Conservative entries on retest of $75–77 area with tight invalidation
🔽 Scenario B – Failed Breakout → Fade Back Inside Channel
If this was a headline-driven spike with no follow-through, bears may re-enter strongly
A close below $75 could confirm bull trap
Support zone to watch: $66.66 (mid-channel, EMA confluence)
⚠️ Risk Factors to Monitor:
Iran’s response (military, diplomatic, strategic)
US/NATO reaction to potential escalation
Strait of Hormuz disruption
OPEC commentary or Saudi-led output adjustment
Market sentiment unwind (profit-taking from overbought spike)
💬 Markets love emotion, but traders survive with structure. This is not the time to be reckless — size down, be responsive, and respect both breakouts and fakeouts.
📎 #CrudeOil #Geopolitics #OilSpike #WTI #MiddleEastTensions #Iran #IranIsrael #TechnicalAnalysis #MJTRADING

California Resources Corporation (CRC) – Stock Analysis and ForeCalifornia Resources Corporation, a key player in crude oil production and carbon management, has recently experienced a notable uptick in investor interest.
This momentum appears to be supported by macroeconomic tailwinds, including renewed trade tensions between the United States and other major economies.
Historically, geopolitical uncertainty often leads to increased energy demand and price volatility, both of which tend to benefit domestic oil producers like CRC.
From a fundamental standpoint, investor sentiment toward CRC has grown increasingly positive. The company’s strategic positioning in California's energy transition—particularly its focus on carbon capture and storage (CCS)—is beginning to resonate more with institutional investors looking to align portfolios with sustainable yet profitable energy operations.
If these supportive fundamentals continue, there is potential for the stock to reach $56 in the coming months, assuming no major changes to current market dynamics or geopolitical influences.
Technical Outlook:
Entry Point: $44.68
Stop Loss: $42.73
Take Profit 1: $50.84
Take Profit 2: $55.88
As always, trade with care, apply proper risk management, and ensure your positions align with your overall investment strategy.
If you find this helpful, kindly follow me, subscribe, like, comment and share.

Crude Oil - Two Scenarios and about Brain PowerPrice retests the L-MLH.
VI. - Price breaks upward, target is the centerline
VII. - Price reverses again, then the target is the 1/4 line, with a subsequent extended target at the red centerline, and possibly even lower at the white dashed warning line.
On a personal note:
I was once again told that the price didn’t do what I had projected.
...yeah, really, that’s how it is §8-)
After over 30 years in the markets and hundreds of coaching sessions, I’m still amazed that people think you can predict price movements as if with a magic crystal ball.
The fact that this belief still persists (even though they don’t understand even the absolute basics of trading) deeply concerns me at the core of my trading soul.
Because this growing irrationality clearly indicates that far too little is being done in terms of education – or humanity might simply go extinct in the next 100 years due to rapidly declining intelligence!
...maybe I should just create a chart and apply a few median lines/forks?
Happy trading to all of you and I pray for those with lesser brain power.
