Thursday 5/8 Oil LONG ENTRY 12pm Thursday Oil Long,
retest of 78.6 Fib retracement level
Early close Friday before Market close
Oil could possibly hold bullish momentum
initial TP: 62,000
Energy Commodities

Oil Analysis: WTI Approaches the $60 Level AgainOver the past two trading sessions, oil has gained more than 4.5%, and is once again approaching the psychological barrier of $60 per barrel. This recent bullish movement persists despite OPEC+’s clear stance on increasing supply in June and the International Energy Agency’s (IEA) cautious outlook on global oil demand for the remainder of the year. As such, it appears that oil prices are currently benefiting from improving market sentiment, particularly as investors await the outcome of the upcoming U.S.–China trade negotiations.
Persistent Bearish Trend
Since mid-January, oil has maintained a steady downtrend, and so far, minor bullish retracements have not been strong enough to signal a meaningful reversal. Therefore, this downward technical formation remains the dominant structure to monitor in upcoming trading sessions.
RSI
The Relative Strength Index (RSI) continues to hover around the 50 level, indicating a sustained balance between bullish and bearish momentum. As long as this equilibrium remains, a neutral bias could dominate short-term price movements.
ADX
The Average Directional Index (ADX) remains close to the 40 mark, though the line has recently begun to flatten. This could be interpreted as a sign of weakening trend strength in the short term, likely due to the price currently testing a significant resistance zone.
Key Levels to Watch:
$60 – Nearby resistance: A short-term psychological level. A break above this zone could reactivate a bullish bias and potentially lead to the formation of a new short-term uptrend.
$63 – Main resistance: Aligned with the 50-period moving average. Sustained price action above this level could challenge the prevailing long-term bearish structure.
$57 – Nearby support: A zone that matches recent multi-week lows. A drop below this level could reinforce bearish momentum and provide more room for the current downtrend to extend.
Written by Julian Pineda, CFA – Market Analyst

NATURAL GAS Massive 1W MA50 rebound eyes $6.800Natural Gas (NG1!) is on 3 week bullish streak following the rebound on its 1W MA50 (blue trend-line), which came straight after a 1W MA50/100 Bullish Cross. This rebound manages to keep the long-term Channel Up valid and this rebound is technically the start of it new Bullish Leg.
This price action is similar to the previous 1W MA50/100 Bullish Cross, which also took place inside a Channel Up. As you can see the 1W RSI fractals among the two sequences are identical and the past one rose by +167.17% from that 1W MA50 bottom to the 2.5 Fibonacci extension.
If this time it 'only' hits the 2.5 Fib ext, then we are looking at a $6.800 Target around the end of the year.
-------------------------------------------------------------------------------
** Please LIKE 👍, FOLLOW ✅, SHARE 🙌 and COMMENT ✍ if you enjoy this idea! Also share your ideas and charts in the comments section below! This is best way to keep it relevant, support us, keep the content here free and allow the idea to reach as many people as possible. **
-------------------------------------------------------------------------------
💸💸💸💸💸💸
👇 👇 👇 👇 👇 👇

USOIL SENDS CLEAR BEARISH SIGNALS|SHORT
USOIL SIGNAL
Trade Direction: short
Entry Level: 61.08
Target Level: 55.63
Stop Loss: 64.68
RISK PROFILE
Risk level: medium
Suggested risk: 1%
Timeframe: 8h
Disclosure: I am part of Trade Nation's Influencer program and receive a monthly fee for using their TradingView charts in my analysis.
✅LIKE AND COMMENT MY IDEAS✅

USOIL:Strategic Analysis on ThursdayThe Ministry of Energy of Kazakhstan stated that the country has no plans to cut oil production in May. The country has continuously exceeded production limits, creating tensions within OPEC+. The Ministry of Energy in Astana said that the largest oil-producing country in Central Asia will have an average daily production of crude oil and condensate of 277,000 tons in May, remaining the same as in April, while the average daily production in March was 260,000 tons. OPEC+ has agreed to significantly increase production for two consecutive months, surprising traders and pushing down oil prices. This move is largely driven by Saudi Arabia, the leader of OPEC, which hopes to punish member states such as Kazakhstan that have continuously exceeded production limits. Crude oil has shown a trend of stabilizing and rebounding at a low level today, stabilizing and rising around $57.7, and showing a volatile upward trend. The key today is whether the upward trend of crude oil can continue to break above the level of $60.6.
you are currently struggling with losses, or are unsure which of the numerous trading strategies to follow, at this moment, you can choose to observe the operations within our channel.

WTI Oil H4 | Heading into resistanceWTI oil (USOIL) is rising towards a pullback resistance and could potentially reverse off this level to drop lower.
Sell entry is at 60.44 which is a pullback resistance that aligns close to the 50.0% Fibonacci retracement.
Stop loss is at 63.80 which is a level that sits above the 78.6% Fibonacci retracement and a swing-high resistance.
Take profit is at 56.05 which is a multi-swing-low support.
High Risk Investment Warning
Trading Forex/CFDs on margin carries a high level of risk and may not be suitable for all investors. Leverage can work against you.
Stratos Markets Limited (tradu.com):
CFDs are complex instruments and come with a high risk of losing money rapidly due to leverage. 63% of retail investor accounts lose money when trading CFDs with this provider. You should consider whether you understand how CFDs work and whether you can afford to take the high risk of losing your money.
Stratos Europe Ltd (tradu.com):
CFDs are complex instruments and come with a high risk of losing money rapidly due to leverage. 63% of retail investor accounts lose money when trading CFDs with this provider. You should consider whether you understand how CFDs work and whether you can afford to take the high risk of losing your money.
Stratos Global LLC (tradu.com):
Losses can exceed deposits.
Please be advised that the information presented on TradingView is provided to Tradu (‘Company’, ‘we’) by a third-party provider (‘TFA Global Pte Ltd’). Please be reminded that you are solely responsible for the trading decisions on your account. There is a very high degree of risk involved in trading. Any information and/or content is intended entirely for research, educational and informational purposes only and does not constitute investment or consultation advice or investment strategy. The information is not tailored to the investment needs of any specific person and therefore does not involve a consideration of any of the investment objectives, financial situation or needs of any viewer that may receive it. Kindly also note that past performance is not a reliable indicator of future results. Actual results may differ materially from those anticipated in forward-looking or past performance statements. We assume no liability as to the accuracy or completeness of any of the information and/or content provided herein and the Company cannot be held responsible for any omission, mistake nor for any loss or damage including without limitation to any loss of profit which may arise from reliance on any information supplied by TFA Global Pte Ltd.
The speaker(s) is neither an employee, agent nor representative of Tradu and is therefore acting independently. The opinions given are their own, constitute general market commentary, and do not constitute the opinion or advice of Tradu or any form of personal or investment advice. Tradu neither endorses nor guarantees offerings of third-party speakers, nor is Tradu responsible for the content, veracity or opinions of third-party speakers, presenters or participants.

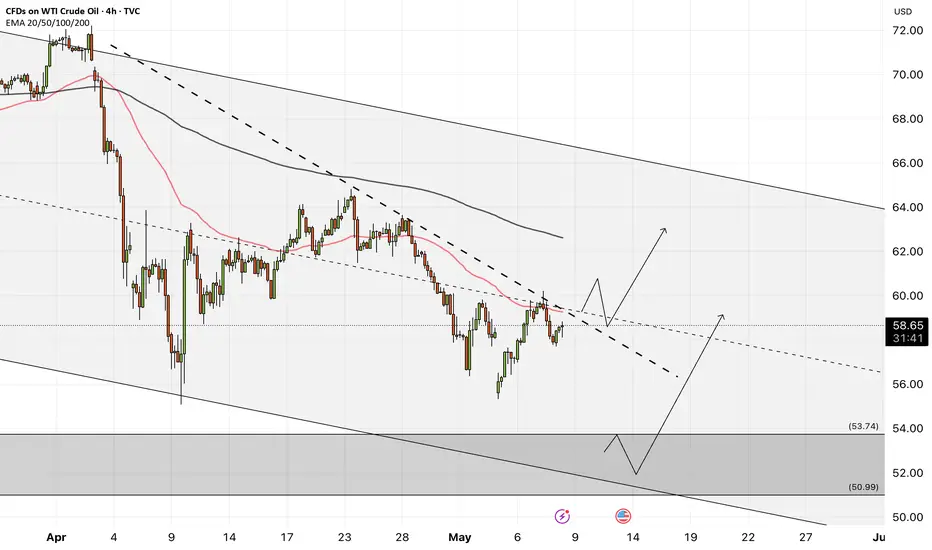
WTI - Will Oil Return to the Uptrend?!WTI oil is below the EMA200 and EMA50 on the 4-hour timeframe and is moving within its medium-term descending channel. If the downward trend continues towards the zone, the next opportunity to buy oil at a good price will be presented to us. A break of the drawn downtrend line will also be another confirmation to enter the oil buying process.
Goldman Sachs anticipates that the Federal Open Market Committee will maintain its pause on interest rate hikes. According to the bank’s asset management division, the continued strength of the labor market remains a crucial factor influencing the Federal Reserve’s decisions, prompting the central bank to adopt a cautious stance.
In a recent note, Goldman Sachs stated: “The Federal Reserve is currently in a holding pattern, waiting for economic uncertainties to diminish.” Although recent employment data have exceeded expectations, the bank believes that initiating a rate-cutting cycle would require clear signs of labor market weakening—a development that could take several months to materialize. The note further stated: “Since the labor market has yet to exhibit any significant softening, the likelihood of another hold decision in the next meeting is high.”
Meanwhile, U.S. President Donald Trump, ahead of his upcoming trip to Saudi Arabia, Qatar, and the United Arab Emirates, responded to a question about the potential renaming of the “Persian Gulf” to the “Arabian Gulf” in official U.S. documents. He stated that a decision would be made following his trip and a related discussion.
Trump acknowledged the sensitivities surrounding the issue, saying he does not wish to offend anyone. He also referenced his prior executive order to rename the “Gulf of Mexico” as the “Gulf of America,” which he described as a necessary move. He concluded by noting that a final decision regarding the name of the Persian Gulf would be made after the scheduled discussions.Additionally, the RIA Novosti news agency reported on Thursday that Chinese President Xi Jinping and Russian President Vladimir Putin had officially begun talks at the Kremlin. Prior to the discussions, Putin expressed his intention to engage with President Xi on “a broad range of bilateral relations,” emphasizing that the Russia-China partnership is mutually beneficial. He also expressed his willingness to visit Beijing for a celebration marking China’s victory over Japan.
According to the report, the two leaders are expected to issue joint statements and address the media following their talks. A correspondent from the TASS news agency reported that the agenda for the Xi-Putin discussions is likely to include bilateral cooperation in various sectors, such as energy, the conflict in Ukraine, and the development of the “Power of Siberia 2” gas pipeline project.
What’s America's Real Goal in a Possible India–Pakistan War?We are nearing the end of the petro-dollar era. The power balance of the new world order will be defined not by oil, but by the strategic resources essential for AI, electric vehicles, and cutting-edge technology.
Throughout the 20th century, the U.S. maintained its global dominance by controlling access to oil. From the Middle East to Latin America and Africa, wherever oil was found, the U.S. was there.
But today, the focus has shifted to rare earth elements, lithium, copper, and other strategic minerals.
Trump’s 2025 move to buy Greenland wasn’t a diplomatic joke—it was a signal. Behind-the-scenes deals in Ukraine for rare earth deposits tell the same story: whoever controls these "white gold" assets will lead the tech-driven world.
Now enters Pakistan, with mineral-rich lands spanning over 600,000 km², nearly three times the size of the UK. Experts estimate its underground reserves to be worth $8 trillion.
In Balochistan's Rekodik field alone, there are 12 million tons of copper and 20 million ounces of gold, with a copper purity of 0.53%, well above global standards. In the north, newly discovered lithium reserves could be a game-changer for the EV revolution.
This is no longer just about resources—this is about deciding the future balance of global power.

WTI CRUDE OIL: Short term rebound on RSI Bullish DivergenceWTI Crude Oil is bearish on its 1D technical outlook (RSI = 38.958, MACD = -2.110, ADX = 28.985) as it remains on a multi-month Low. The 1D RSI however displays a HL Bullish Divergence and this can cause a short term price rebound. The Resistance is the Pivot Zone and short term the LH trendline is what maintains the downtrend. Consequently, we are now bullish, TP = 64.90.
## If you like our free content follow our profile to get more daily ideas. ##
## Comments and likes are greatly appreciated. ##


USOIL seems to be in a potential bullish reversalWTI crude oil futures rose slightly. Traders weighed factors such as the optimistic sentiment in Sino - US trade, the decline in US production, and the technical position, while also considering the persistent concerns about supply surplus. The recent decline in oil prices is largely due to the decision of OPEC + to accelerate production increase for the second consecutive month. It is reported that the number of drilling rigs is being reduced, which implies that the future shale oil production may decline, providing support for the bullish view on oil prices. This supply restriction, together with the signs of strong demand from Europe and China, helps to stabilize market sentiment. Crude oil showed a trend of rising first and then falling today. After reaching $60.2, it showed a callback trend. After two consecutive positive days on the daily chart, the oil price adjusted, which may indicate that crude oil will continue to maintain a wide - range oscillation. Overall, the reduction in crude oil inventory is expected to support the rebound of oil prices.
you are currently struggling with losses, or are unsure which of the numerous trading strategies to follow, at this moment, you can choose to observe the operations within our channel.
Trading Strategy:
buy@57.4-58.4
TP:59.4-60.6

Natural Gas Slowed Down For A Correction Within UptrendEU Commission will propose in June banning Russian gas and LNG imports under new deals and existing spot contracts by end-2025.
Natural gas slowed down recently, but despite that retracement, we see it as an ABC correction after a potential leading diagonal formation from the lows. It actually stopped perfectly at the former wave 2 swing low and 61,8% Fibonacci support area, from where we may now see a bullish continuation, especially if it recovers back above 4.15 bullish confirmation level.

Oil - Short Term Sell Trade Update!!!Hi Traders, on April 17th I shared this idea "Oil - Looking To Sell Pullbacks In The Short Term"
I expected to see bearish continuation until the two Fibonacci resistance zones hold. You can read the full post using the link above.
Price moved lower as per the plan here!!!
Price respected the first Fibonacci resistance zone, created a false break of it and moved lower as expected!!!
If you enjoy this idea, don’t forget to LIKE 👍, FOLLOW ✅, SHARE 🙌, and COMMENT ✍! Drop your thoughts and charts below to keep the discussion going. Your support helps keep this content free and reach more people! 🚀
-------------------------------------------------------------------------------------------------------------------
Disclosure: I am part of Trade Nation's Influencer program and receive a monthly fee for using their TradingView charts in my analysis.

USOIL Trading strategiesOn Tuesday, due to the increase in demand from Asia and Europe, the decline in U.S. production, and the further escalation of the situation in Israel, international oil prices soared. After today's opening, oil prices have remained volatile at a high level, demonstrating strong resilience. The key dividing line between bulls and bears is at the crucial price level of $58.4. As long as this price level is not effectively broken, it will be difficult for the bullish trend of oil prices to change. Currently, oil prices are still within the bullish channel.
In terms of today's trading strategy, it is recommended to mainly place long orders on pullbacks, supplemented by a small number of short positions. Pay close attention to the resistance range of $60.8 - $61.6 above, and closely monitor the support area of $58.9 - $58.0 below.
USOIL
buy@58.80-59.30
tp:60.00-61.00

Hellena | Oil (4H): SHORT to support area of 54.00.Friends, what do we see after the recent downward movement? Most likely we see a continuation of the downward movement in a combined correction.
The hardest thing about compound corrections is to understand where the wave ends and begins.
I believe that the price is now in the middle wave “C” and will continue the downward movement to the target of 53.991.
Wave “B” is likely to reach the 60.00 area, but I do not recommend long positions. Work with pending limit orders.
Manage your capital correctly and competently! Only enter trades based on reliable patterns!

WTI on high time frame , price reach 53$?
"Hello traders, focusing on WTI on high time frames, the price is approaching the $60.50 level, which holds significant importance. There is a high probability of price rejection at this level due to fundamental analysis.
When the price reaches the $60.50 zone, it is advisable to observe candle formations, momentum, and other indicators. This could present a favorable opportunity for a short position targeting the $53 level."
If you have any further questions or need additional assistance, feel free to let me know!

USOIL H4 I Bearish reversal Based on the H4 chart, the price is approaching our sell entry level at 60.44, a pullback resistance that aligns with the 61.8% Fibo retracement.
Our take profit is set at 57.63, a pullback support.
The stop loss is set at 62.67, a pullback resistance.
High Risk Investment Warning
Trading Forex/CFDs on margin carries a high level of risk and may not be suitable for all investors. Leverage can work against you.
Stratos Markets Limited (tradu.com):
CFDs are complex instruments and come with a high risk of losing money rapidly due to leverage. 63% of retail investor accounts lose money when trading CFDs with this provider. You should consider whether you understand how CFDs work and whether you can afford to take the high risk of losing your money.
Stratos Europe Ltd (tradu.com):
CFDs are complex instruments and come with a high risk of losing money rapidly due to leverage. 63% of retail investor accounts lose money when trading CFDs with this provider. You should consider whether you understand how CFDs work and whether you can afford to take the high risk of losing your money.
Stratos Global LLC (tradu.com):
Losses can exceed deposits.
Please be advised that the information presented on TradingView is provided to Tradu (‘Company’, ‘we’) by a third-party provider (‘TFA Global Pte Ltd’). Please be reminded that you are solely responsible for the trading decisions on your account. There is a very high degree of risk involved in trading. Any information and/or content is intended entirely for research, educational and informational purposes only and does not constitute investment or consultation advice or investment strategy. The information is not tailored to the investment needs of any specific person and therefore does not involve a consideration of any of the investment objectives, financial situation or needs of any viewer that may receive it. Kindly also note that past performance is not a reliable indicator of future results. Actual results may differ materially from those anticipated in forward-looking or past performance statements. We assume no liability as to the accuracy or completeness of any of the information and/or content provided herein and the Company cannot be held responsible for any omission, mistake nor for any loss or damage including without limitation to any loss of profit which may arise from reliance on any information supplied by TFA Global Pte Ltd.
The speaker(s) is neither an employee, agent nor representative of Tradu and is therefore acting independently. The opinions given are their own, constitute general market commentary, and do not constitute the opinion or advice of Tradu or any form of personal or investment advice. Tradu neither endorses nor guarantees offerings of third-party speakers, nor is Tradu responsible for the content, veracity or opinions of third-party speakers, presenters or participants.

USOIL SHORT SIGNAL|
✅CRUDE OIL made a retest
Of the horizontal resistance level
Of 59.80$ and we are already seeing
A bearish reaction so we are bearish
Biased and we can enter a short trade
With the TP of 58.10$ and the
SL of 59.93$
SHORT🔥
✅Like and subscribe to never miss a new idea!✅
Disclosure: I am part of Trade Nation's Influencer program and receive a monthly fee for using their TradingView charts in my analysis.

Bearish reversal off pullback resistance?USO/USD is reacting off the resistance level which is a pullback resistance that is slightly below the 50% Fibonacci retracement and could drop from this level to our take profit.
Entry: 60.04
Why we like it:
There is a pullback resistance level that is slightly below the 50% Fibonacci retracement.
Stop loss: 62.00
Why we like it:
There is a pullback resistance level that is slightly below the 71% Fibonacci retracement.
Take profit: 56.89
Why we like it:
There is a pullback support level.
Enjoying your TradingView experience? Review us!
Please be advised that the information presented on TradingView is provided to Vantage (‘Vantage Global Limited’, ‘we’) by a third-party provider (‘Everest Fortune Group’). Please be reminded that you are solely responsible for the trading decisions on your account. There is a very high degree of risk involved in trading. Any information and/or content is intended entirely for research, educational and informational purposes only and does not constitute investment or consultation advice or investment strategy. The information is not tailored to the investment needs of any specific person and therefore does not involve a consideration of any of the investment objectives, financial situation or needs of any viewer that may receive it. Kindly also note that past performance is not a reliable indicator of future results. Actual results may differ materially from those anticipated in forward-looking or past performance statements. We assume no liability as to the accuracy or completeness of any of the information and/or content provided herein and the Company cannot be held responsible for any omission, mistake nor for any loss or damage including without limitation to any loss of profit which may arise from reliance on any information supplied by Everest Fortune Group.

Oil prices still face systemic downside risks.Although the geopolitical situation in the Middle East (the conflict between Israel and Iran) may support oil prices in the short term, market sentiment is still dominated by supply pressure. Technically, WTI has broken below the key support level of $60. The MACD death cross and the oversold RSI suggest that the bears are in the dominant position, and the next support level is expected to be $54.80. Barclays Bank has lowered its price forecast for Brent crude in 2025 to $66. Weak demand and the expectation of the resumption of shale oil production in the United States further suppress the medium - term trend.
you are currently struggling with losses, or are unsure which of the numerous trading strategies to follow, at this moment, you can choose to observe the operations within our channel.
Trading Strategy:
sell@58.8-59.1
TP:57.6-58.1

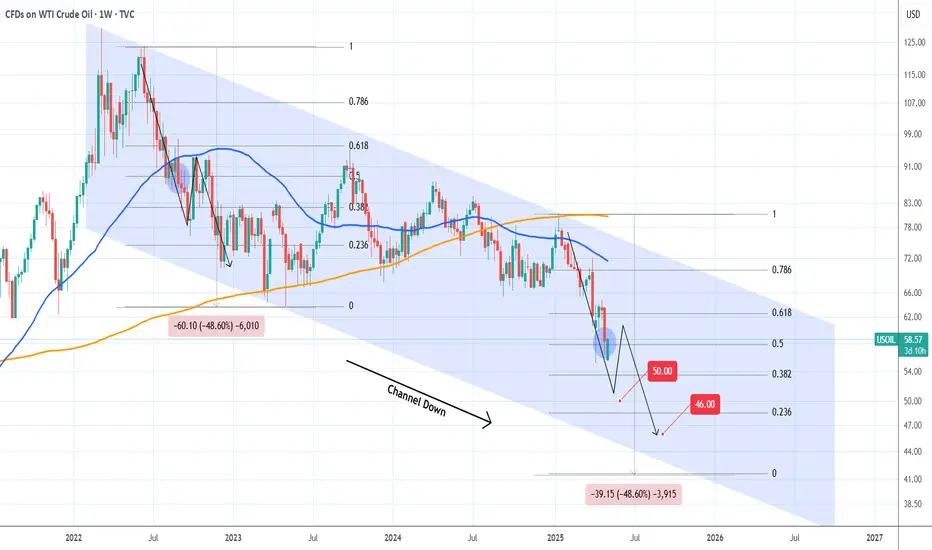
WTI OIL May be closer to $50 and below than a recovery.WTI Oil (USOIL) is having a strong green 1W candle but remains on a strong selling sequence since the January 13 2025 rejection on its 1W MA200 (orange trend-line). So far this is technically the Bearish Leg of the Channel Down that started after the March 07 2022 market top.
The Bearish Leg that was initiated then, declined by -48.60% so if the current one repeats this we are looking at prices close to $41 by the end of the year or beginning of 2026. Technically, as long as the 1W MA50 (blue trend-line) holds, the immediate Targets within a 3-month horizon are $50 and $46.
-------------------------------------------------------------------------------
** Please LIKE 👍, FOLLOW ✅, SHARE 🙌 and COMMENT ✍ if you enjoy this idea! Also share your ideas and charts in the comments section below! This is best way to keep it relevant, support us, keep the content here free and allow the idea to reach as many people as possible. **
-------------------------------------------------------------------------------
💸💸💸💸💸💸
👇 👇 👇 👇 👇 👇
Can it hit the bottom and rebound?Fundamental Analysis: Driven by the trade concerns sparked by Trump and the risk aversion sentiment arising from the global economic slowdown, the trajectory of oil prices has been shaped. Additionally, OPEC+ convened an early meeting on Saturday and confirmed an increase in production of 411,000 barrels per day in June. This decision has indubitably intensified the market's apprehensions regarding the oversupply of crude oil 📉.
Technical Analysis: Technically speaking, the price of crude oil has persistently lingered below the midline of the Bollinger Bands, distinctly indicating that the bearish trend is in the ascendancy 📉. Last week, on the weekly chart, it closed with a substantial bearish candlestick, exhibiting a downward tail pattern, and in the short term, the price has been fluctuating within a trading range 📊. As for the upcoming week's trend, whether the support level established by the previous double doji bottoming formation will be broken through effectively will be the focal point of market attention 👀. Nevertheless, once the price reaches the crucial support level, there exists the potential for a technical rebound. Investors should closely monitor the variations in trading volume and the response of the moving average system 📈.
Market Situation: It is crucial to note that due to the holiday factor in the Asian market next Monday, market liquidity is anticipated to decline significantly. Under such circumstances, the oil price is likely to encounter a higher risk of more pronounced volatility, further escalating the uncertainty of the market situation ⚠️.
⚡⚡⚡ USOIL ⚡⚡⚡
🚀 Buy@56.0 - 57.0
🚀 TP 59.0 - 60.0
Accurate signals are updated every day 📈 If you encounter any problems during trading, these signals can serve as your reliable guide 🧭 Feel free to refer to them! I sincerely hope they'll be of great help to you 🌟

WTI Oil H4 | Swing-high resistance at 50% Fibonacci retracementWTI oil (USOIL) is rising towards a swing-high resistance and could potentially reverse off this level to drop lower.
Sell entry is at 59.68 which is a swing-high resistance that aligns close to the 50.0% Fibonacci retracement.
Stop loss is at 62.30 which is a level that sits above an overlap resistance.
Take profit is at 56.05 which is a multi-swing-low support.
High Risk Investment Warning
Trading Forex/CFDs on margin carries a high level of risk and may not be suitable for all investors. Leverage can work against you.
Stratos Markets Limited (tradu.com):
CFDs are complex instruments and come with a high risk of losing money rapidly due to leverage. 63% of retail investor accounts lose money when trading CFDs with this provider. You should consider whether you understand how CFDs work and whether you can afford to take the high risk of losing your money.
Stratos Europe Ltd (tradu.com):
CFDs are complex instruments and come with a high risk of losing money rapidly due to leverage. 63% of retail investor accounts lose money when trading CFDs with this provider. You should consider whether you understand how CFDs work and whether you can afford to take the high risk of losing your money.
Stratos Global LLC (tradu.com):
Losses can exceed deposits.
Please be advised that the information presented on TradingView is provided to Tradu (‘Company’, ‘we’) by a third-party provider (‘TFA Global Pte Ltd’). Please be reminded that you are solely responsible for the trading decisions on your account. There is a very high degree of risk involved in trading. Any information and/or content is intended entirely for research, educational and informational purposes only and does not constitute investment or consultation advice or investment strategy. The information is not tailored to the investment needs of any specific person and therefore does not involve a consideration of any of the investment objectives, financial situation or needs of any viewer that may receive it. Kindly also note that past performance is not a reliable indicator of future results. Actual results may differ materially from those anticipated in forward-looking or past performance statements. We assume no liability as to the accuracy or completeness of any of the information and/or content provided herein and the Company cannot be held responsible for any omission, mistake nor for any loss or damage including without limitation to any loss of profit which may arise from reliance on any information supplied by TFA Global Pte Ltd.
The speaker(s) is neither an employee, agent nor representative of Tradu and is therefore acting independently. The opinions given are their own, constitute general market commentary, and do not constitute the opinion or advice of Tradu or any form of personal or investment advice. Tradu neither endorses nor guarantees offerings of third-party speakers, nor is Tradu responsible for the content, veracity or opinions of third-party speakers, presenters or participants.
