WTI - Positioning for Upside After Anticipated CorrectionThe US Light Crude 4-hour chart shows price action currently oscillating near the $68,60 level after recovering from early March lows. The recent price structure suggests we may see a short-term pullback before a stronger upward move develops. The chart indicates a potential bullish scenario with price expected to eventually rally toward the blue reaction zone (around $69,00-$69,50) after a possible retracement. This anticipated upside move is supported by the higher lows forming since mid-March and the overall recovery pattern from the $65,67 support level (marked by the red line). A prudent approach would be monitoring for reversal signs at lower levels before positioning for the higher probability move toward the blue reaction zone, with the orange resistance at $70,77 serving as the ultimate target if bullish momentum accelerates.
Disclosure: I am part of Trade Nation's Influencer program and receive a monthly fee for using their TradingView charts in my analysis.
Energy Commodities

USOIL Technical Analysis! SELL!
My dear friends,
My technical analysis for USOIL is below:
The market is trading on 68.25 pivot level.
Bias - Bearish
Technical Indicators: Both Super Trend & Pivot HL indicate a highly probable Bearish Bearish continuation.
Target - 67.21
Recommended Stop Loss - 68.91
About Used Indicators:
A pivot point is a technical analysis indicator, or calculations, used to determine the overall trend of the market over different time frames.
———————————
WISH YOU ALL LUCK

USOIL in Limbo: Will 66 Holdor70 Break? Next week, the trend of USOIL still remains highly uncertain. Technically, the current price is continuously fluctuating within a range. Around $70 serves as a strong resistance level, while $66.05 is a key support level.
Fundamentally, the tense geopolitical situation and the supply decisions of OPEC+ provide some support for oil prices. However, the slowdown in global economic growth, coupled with the increase in US crude oil production, exerts downward pressure on oil prices.
Barring unforeseen events, USOIL is likely to trade in the range of $66 - $70. Once the key levels are broken through, the direction of the trend will become clear. In terms of trading operations, it is recommended to adopt a "buy low and sell high" strategy within the range of $67.5 - $69.5.
I will share trading signals every day. All the signals have been accurate for a whole month in a row. If you also need them, please click on the link below the article to obtain them.

USOIL SHORT FROM RESISTANCE
USOIL SIGNAL
Trade Direction: short
Entry Level: 68.25
Target Level: 65.67
Stop Loss: 69.99
RISK PROFILE
Risk level: medium
Suggested risk: 1%
Timeframe: 9h
Disclosure: I am part of Trade Nation's Influencer program and receive a monthly fee for using their TradingView charts in my analysis.
✅LIKE AND COMMENT MY IDEAS✅

Just more analysis =)In this video I go through a bit quicker on what I'm looking for in price action for the USD(DXY), NZDUSD, USDCAD, OIL, and EURUSD.
I'm pretty confident in what i'm looking for and excited to see it unfolds.
- R2F Trading.

WATCH OUT FOR OIL'S DESCENDING TRIANGLE...A potential close above 70 will signal the likelihood of oil price to test trendline is sloping downward or the bearish order candle.
N.B!
- USOIL price might not follow the drawn lines . Actual price movements may likely differ from the forecast.
- Let emotions and sentiments work for you
- ALWAYS Use Proper Risk Management In Your Trades
#usoil
#wti
#ukoil
USoil Buy USOUSD buy signal on H1 chart. Price is on the top of daily resistance but h1 chart is bullish , we can try to catch this bullish move. Risk reward 1/3

WTI Crude Oil The Week Ahead 24th March '25WTI Crude Oil bearish & oversold, the key trading level is at 69.50
This communication is for informational purposes only and should not be viewed as any form of recommendation as to a particular course of action or as investment advice. It is not intended as an offer or solicitation for the purchase or sale of any financial instrument or as an official confirmation of any transaction. Opinions, estimates and assumptions expressed herein are made as of the date of this communication and are subject to change without notice. This communication has been prepared based upon information, including market prices, data and other information, believed to be reliable; however, Trade Nation does not warrant its completeness or accuracy. All market prices and market data contained in or attached to this communication are indicative and subject to change without notice.

BRIEFING Week #12 : Alt-Season might be coming soonHere's your weekly update ! Brought to you each weekend with years of track-record history..
Don't forget to hit the like/follow button if you feel like this post deserves it ;)
That's the best way to support me and help pushing this content to other users.
Kindly,
Phil

USOIL: Short Trade with Entry/SL/TP
USOIL
- Classic bearish formation
- Our team expects pullback
SUGGESTED TRADE:
Swing Trade
Short USOIL
Entry - 68.25
Sl - 68.94
Tp - 67.09
Our Risk - 1%
Start protection of your profits from lower levels
Disclosure: I am part of Trade Nation's Influencer program and receive a monthly fee for using their TradingView charts in my analysis.
❤️ Please, support our work with like & comment! ❤️

Weekly Market Analysis - 22nd Mar 2025Ok, here we go with another weekly market analysis!
So, what I'm feeling from my charting is that we may get a lower USD, but not before a little retracement first, particularly an iFVG on the 2W timeframe. After that, lower prices. This coincides with some of my analysis of other pairs, but not all of them. Whilst everything is not aligned yet, my instincts are usually pretty good. But, this not mean I am jumping into any trades yet. I have my own techniques for getting in and out of trades.
Check out the video and see if your own analysis flows with mine!
Analyzed pairs: DXY, EURUSD, NZDUSD, USDCHF, USDCAD, USDJPY, OIL, XPD, XPT, XAU, BTC.
Happy trading!
- R2F Trading

EWT Falling Wedge = Up up up We are finally nearing the end of the sadistic falling wedge and will skyrocket into the moon and then mars
Patience is key. Wait for the breakout.
Stochastic RSI and every indicator is looking fantastic
(not financial advice)

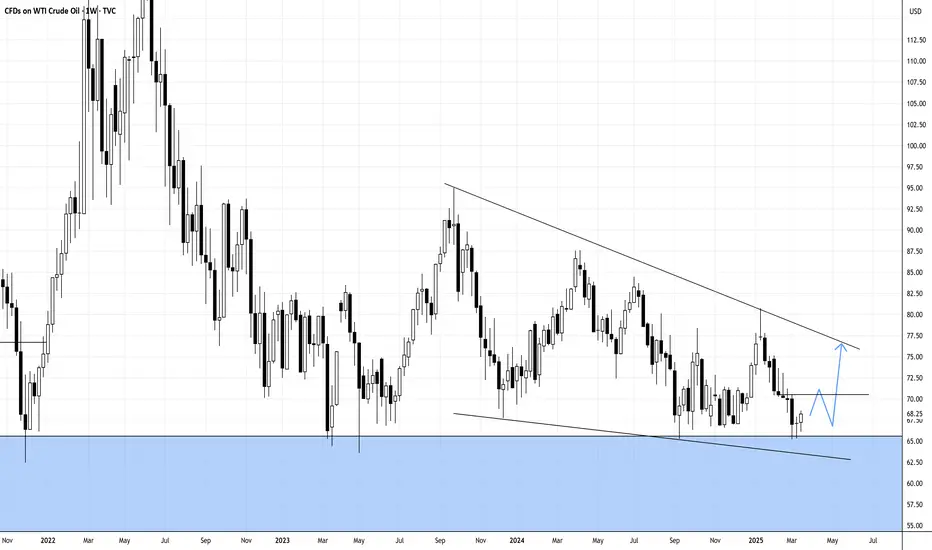
WTI CRUDE OIL: Hard rebound on 1.5 year support targeting $72.WTI Crude Oil is neutral on its 1D technical outlook (RSI = 48.748, MACD = -1.080, ADX = 23.603), which indicates the slow transition from a bearish trend to bullish. This started when the price hit the S1 level, a 1.5 year Support, and bottomed. The slow rebound that we're having since formed a Channel Up on a bullish 1D RSI, much like the one in September 2024, which eventually peaked after a +10.70% price increase. A similar rebound is expected to test the 1D MA200. The trade is long, TP = 72.00.
## If you like our free content follow our profile to get more daily ideas. ##
## Comments and likes are greatly appreciated. ##

USOil The Final dealBased on current market conditions, we predict an upward movement for USOil.
The first resistance level is set at 69.000. This level has proven to be a significant hurdle in previous price actions, with selling pressure often emerging as the price approaches it.
However, given the current positive momentum, there's a strong likelihood of breaking through this resistance.
On the downside, the primary support level stands at 67.000. This level has been tested multiple times and has held firm, acting as a floor for the price.
Below this, we have a second support at 66.500. This secondary support is crucial as it provides an additional buffer against significant price drops. If the price manages to stay above the 67.000 support, the upward trend is likely to continue towards the 69.000 resistance and potentially beyond.
💎💎💎USOil 💎💎💎
🎁 Buy@67.500 - 67.700
🎁 TP 68.800 - 69.000
The market has been extremely volatile lately. If you can't figure out the market's direction, you'll only be a cash dispenser for others. If you also want to succeed,Follow the link below to get my daily strategy updates

Crude oil is coiling on a Friday. What could possibly go wrong?Intraday Update: Another strong rejection of the 68.50 level. Since it is the end of the week, the risk is building for a big move either back to the 65.20 support or perhaps a break of the key 68.50 level.

OIL Today's strategyCurrently, crude oil prices are fluctuating near the resistance level. Recently, the increase in US crude oil inventories has affected the supply dynamics and exerted certain pressure on oil prices. However, overall, the geopolitical tensions and supply risks have a relatively significant supporting effect on oil prices at present.
OIL Today's strategy
sell@68.5-68.8
buy:67.2-67.6
There are risks in trading. If you are not sure about the timing, it is best to leave me a message. This will better confirm the timing of the transaction, It can also better expand profits and reduce losses

MCX Crudeoil intraday analysis for March 21, 2025According to my technical analysis, MCX Crudeoil is showing a bullish trend during intraday on March 21, 2025. Trade with Stop-Loss.

Crude oil ------- sell around 70.00, targeCrude oil market analysis:
Yesterday's crude oil daily line closed with a big positive, is it a buying opportunity? In fact, looking at the pattern, it has been hovering at this position for a long time, and the short-term is basically a snake. If the position of 70.00 is not broken, it is difficult to form a buying opportunity. The idea of crude oil today is still bearish. Continue to sell on the rebound. The previous contract delivery of crude oil has not changed the trend. I think it still needs to fluctuate.
Operation suggestion:
Crude oil ------- sell around 70.00, target 68.00-66.00

CRUDE OIL Free Signal! Sell!
Hello,Traders!
CRUDE OIL made a sharp
And sudden move up
And it seems that it will
Soon hit a horizontal
Resistance level of 68.80$
From where we can go short
On Oil with the TP of 67.67$
And the SL of 68.87$
Sell!
Comment and subscribe to help us grow!
Check out other forecasts below too!
Disclosure: I am part of Trade Nation's Influencer program and receive a monthly fee for using their TradingView charts in my analysis.

Oil Market at Risk: Potential Breakdown Below Key SupportThe oil market is showing signs of weakness, with a technical triangle formation on the verge of breaking down. Key support at USD 66.50 per barrel is under threat, and several fundamental and macroeconomic factors suggest further downside risks.
Some Key Bearish Factors for Oil
1. Weakening Global Economy
Economic indicators across major economies are flashing warning signs. A slowdown in global growth, particularly in China and Europe, is reducing industrial demand for oil. Weaker economic activity typically translates to lower energy consumption, putting pressure on oil prices.
2. Stronger U.S. Dollar
A rising USD makes oil more expensive for buyers using other currencies, leading to lower demand. If the Federal Reserve maintains its hawkish stance on interest rates, a stronger dollar could continue weighing on oil prices.
3. Supply Overhang and Shale Resilience
Despite OPEC+ production cuts, oil supply remains ample. U.S. shale producers have kept output steady, while global inventories are rising. If supply continues to outpace demand, downward pressure on prices is likely.
4. China’s Slowing Recovery
China, the world’s largest oil importer, has struggled with weaker-than-expected economic data. Lower manufacturing activity and sluggish domestic demand are reducing the country’s need for crude oil, further dampening market sentiment.
5. Geopolitical De-escalation
A potential ceasefire in Ukraine could ease concerns over energy supply disruptions. Lower geopolitical risk would reduce the war-driven risk premium on oil, potentially triggering a price decline.
6. Growth in Alternative Energy
The increasing adoption of electric vehicles (EVs) and renewable energy is gradually reducing structural demand for crude oil. As governments push for greener energy solutions, long-term oil consumption trends may continue declining.
7. Speculative Unwinding
Traders and hedge funds could accelerate the sell-off if USD 66.50 support breaks. Technical breakdowns often lead to increased short-selling and stop-loss triggers, intensifying downward momentum.
Conclusion: More Downside Ahead?
With a weakening economy, strong dollar, and growing supply concerns, oil faces multiple headwinds. If key technical support at USD 66.50 breaks, the market could see further declines in the short term. Unless demand picks up or supply constraints emerge, the bearish trend may persist.
#OilMarket #CrudeOil #BearishOutlook #Energy

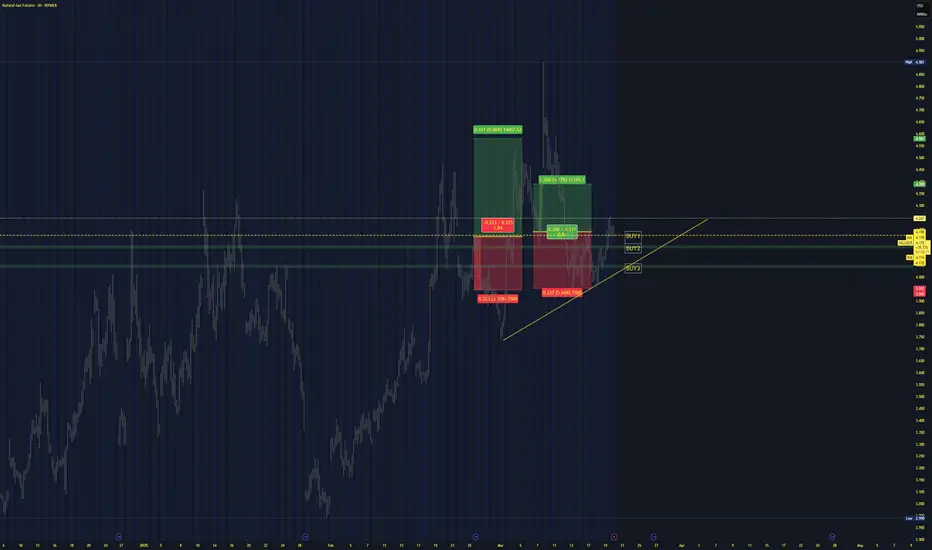
NG1! NATURAL GAS SHORT TERM TARGETNatural Gas Price Forecast: Rises to Five Day High
Natural gas strengthened on Wednesday and reached a five-day high of $4.25. The high for the day was a successful test of resistance around a trendline
Following a breakdown from the trendline last week natural gas consolidated in a relatively narrow four-day price range, largely below the trendline and the 20-Day MA.
Short term entry and targets
We can chose ,because of volatility and high uncertainty,tariffs,news... between 2 profit targets
If the 1st profit target hits,and NG reverses,possibility 1 to take profit
If it passes through, we take profit at 2nd target.
Entries:
In case to entry currently Buy1
If pullback Buy2
If pullback deep Buy3 level.
Alternatives:
Entry 1 Buy1
Entry2 cover
Entry3 Cover2
CL1! Crude Oil Short TermTrump Letter Gave Iran Two-Month Deadline for Nuclear Deal
Intraday short term Entry+Prfofit Target
Sell1 Entry
Sell2-5 Incase missing the first entry or to cover

Bearish potential detected for WHCEntry conditions:
(i) lower share price for ASX:WHC along with swing up of the DMI indicators and swing down of the RSI indicator, and
(ii) observation of market reaction at the support level at $5.55.
Stop loss for the trade would be, dependent of risk tolerance:
(i) above the resistance level from the open of 21st February (i.e.: above $5.80),
(ii) above the resistance level from the open of 13th January (i.e.: above $5.91), or
(iii) above the resistance level from the open of 30th December (i.e.: above $6.00).
