WTI Possible Scenarios:
1- Bullish Scenario:
If the price holds above 66.160, it could push towards 67.900, filling the Fair Value Gap.
A break above 67.900 could confirm further upside potential.
2-Bearish Scenario:
If price breaks below 65.800, it could signal further downside towards 65.500 or lower.
The trendline resistance could push price lower if rejection occurs.
Entry Zone: Around 66.160.
Stop Loss: Around 65.800.
Target Price: Around 67.895.
Energy Commodities

USOIL.. Near resistance? hold or not??#USOIL.. market just near to his current resistance area that is around 67.52-55
keep close that area and if market hold it in that case we can expect a drop from here.
keep close and stay sharp..
good luck
trade wisely

#CRUDEOIL SUPPLY ZONE A supply zone at 5923 indicates a potential area of selling pressure, where price may reverse or stall. Traders can consider shorting on price rejection at this zone, with a stop loss above 5923 (e.g., 5950) and a target at the next support level (e.g., 5750).

#NATURAL GAS (Supply Zone)In technical analysis, a Supply Zone is an area on a price chart where selling pressure is expected to be strong, causing the price to potentially reverse or stall. This concept is often used in trading strategies to identify potential areas where price might decline.

OIL Today's strategyIn the short term, there is a simultaneous advance of the long positions in crude oil. The price has tested the vicinity of $68.5 several times but encountered resistance. Moreover, after reaching around $65.2 at the lower level, it rebounded rapidly. The market still needs further testing. In the short term, it is advisable to sell high and buy low within the range of $68.5 to $65.2.
OIL Today's strategy
sell@67.5-67.9
buy:65.7-66.2
If you don't know how to do it, you can refer to my transaction.

Oil head and shoulder ( must read caption)This chart shows a Head and Shoulders pattern on a Crude Oil Futures (4H) timeframe, which is a bearish reversal signal.
Key Points:
1. Pattern Formation:
The Left Shoulder, Head, and Right Shoulder are clearly marked.
A resistance level is identified around $68.00, where the price previously failed to break higher.
2. Breakdown Confirmation:
Price has broken the neckline (support level), confirming the bearish pattern.
The breakdown suggests further downside movement.
3. Price Targets:
First target: $64.84 (-2.58%)
Second target: $63.66 (-1.89%)
Final target: $63.00 (-1.93%)
Trading Strategy:
Bearish Bias: Traders may look for short opportunities below the neckline.
Stop Loss: Above the right shoulder (~$68.00) to limit risk.
Take Profit: Scaling out near $64.84, $63.66, and $63.00.
This setup aligns with technical analysis principles, indicating a likely continuation of the downtrend. However, traders should monitor volume and external factors like oil supply data and geopolitical events for confirmation.

USOIL Strategy AnalysisInternational crude oil prices have been trending sideways-to-downward recently. As of March 19, WTI crude oil was priced at $66.58/barrel, marking a cumulative decline of over 7% since the beginning of the year. The current core market contradiction focuses on the dual pressures of loose supply expectations and divergent demand prospects.
Oil trading strategy:
sell @ 68.2
buy @ 66
If you are currently unsatisfied with your crude oil trading performance and need daily accurate trading signals, you can visit my profile for free strategy updates every day.

USOIL BULLISH BIAS RIGHT NOW| LONG
USOIL SIGNAL
Trade Direction: long
Entry Level: 66.30
Target Level: 67.73
Stop Loss: 65.34
RISK PROFILE
Risk level: medium
Suggested risk: 1%
Timeframe: 4h
Disclosure: I am part of Trade Nation's Influencer program and receive a monthly fee for using their TradingView charts in my analysis.
✅LIKE AND COMMENT MY IDEAS✅

Defensive Sector with Growth PotentialSupporting Arguments
Current Market Uncertainty Sustains Demand for the Defensive Sector. NEE represents the defensive utility sector. Given the current political and economic uncertainty in the market, there could be an additional catalyst for the company's stock price growth.
Demand for Green Energy from the IT Sector. More than 80% of the company's portfolio consists of renewable energy sources (RES). Demand from data centers in the IT sector may allow the company to outperform competitors.
Attractive Valuation Levels and Technical Outlook
Investment Thesis
NextEra Energy (NEE) has strong long-term growth prospects due to the increasing demand for RES and the electrification of various sectors. Their integrated business model, combining the regulated utility business FPL and the competitive renewable energy business NEER, ensures both stability and growth opportunities. NEE's leadership in RES production, along with investments in battery energy storage and gas infrastructure, allows the company to benefit from the growing demand for clean energy solutions.
Current Market Uncertainty Could Drive Stock Price Growth. Tariffs imposed by the administration on imports and their potential impact on the U.S. economy remain in investors' focus. The market has responded to high uncertainty with a significant correction in overheated sectors, and pressure may persist for some time. As a representative of the utility sector, NEE benefits from uncertainty and may continue its growth.
Demand for Green Energy from the IT Sector. The largest public companies continue to increase capital expenditures on AI infrastructure to stay competitive. A key component of such infrastructure is data centers, which consume large amounts of energy and contribute to increased environmental pollution. As a result, data center owners create strong demand for companies that provide access to RES. More than 80% of the company’s portfolio consists of renewable energy sources. Already, the company’s annual profit growth rate is twice as high as that of its competitors.
Attractive Valuation Levels and Technical Outlook. The company's stock is trading at the 200-day moving average and recently rebounded from the resistance line at the 50-day moving average, which could serve as a strong catalyst for movement toward the previous peak of $84.8. Based on the forward PEG ratio, the company is trading at about the same level as companies engaged in traditional energy sources for household supply, while maintaining profitability 5-15% higher than competitors. Based on the forward P/E ratio, the company appears cheaper than its closest direct competitors (18x vs. 20.5x).
Our target price is $82, with a "Buy" recommendation. We recommend setting a stop-loss at $64

Will Mixed Geopolitical News Limit the Downside of Oil Prices?Macro:
- Oil prices continued their decline following an agreement between the US and Russia to halt attacks on energy infrastructure, though without implementing a complete ceasefire.
- The market turned bearish amid expectations that Russian sanctions may be eased, potentially increasing the oil supply surplus.
- Uncertainty lingered as geopolitical tensions in the Middle East sent mixed signals. While the possibility of increased supply pushed prices down, fears of conflict disrupting oil production kept some upward pressure.
Technical:
- USOIL retested its descending channel's upper bound before rejecting the boundary and forming a bearish Engulfing Candlestick, which may provide a hint that bears are in control. The price is below both EMAs, indicating persistent bearish momentum.
- Breaking below the support at 65.80 may prompt another plunge to the 100% Fibonacci Extension at 64.00.
- Closing above 68.40 and breaking the descending channel's upper bound may shift the current structure sideways before retesting the following resistance at 70.20.
Analysis by: Dat Tong, Senior Financial Markets Strategist at Exness

USOIL BREAKOUT FROM THE WEDGE|SHORT|
✅CRUDE OIL is trading in a
Downtrend and the price broke
Out of the bearish wedge pattern
And the breakout is confirmed
Because the 4H candle closed
Way below the wedge's support
So we are bearish biased and
We will be expecting a
Further bearish move down
SHORT🔥
✅Like and subscribe to never miss a new idea!✅
Disclosure: I am part of Trade Nation's Influencer program and receive a monthly fee for using their TradingView charts in my analysis.

Crude oil turns lower on Putin-Trump callBoth oil contracts are now lower on the day, giving up earlier gains. From the day's high, WTI is now 2.8% lower and counting as prices test the day's lows. Oil prices moved lower on hints/hopes of peace from the just-finished Trump & Putin talks. The rationale here is that any peace progress would increase the chances of removing sanctions on Russian oil shipments, increasing global supplies.
WTI has held the trend resistance and old support-now-resistance at $68.45. The inverted daily hammer candle, if completed, would point to more weakness in the days ahead. As such, we could see prices dip down to test waters below recent lows of just north of $65.00 handle - a level last tested back in September 2024. A potential break below that could pave the way for a test of the May 2023 low of $63.60.
By Fawad Razaqzada, market analyst with FOREX.com

Buy directlySupply and Demand Aspect
Supply: In 2025, the expected increment in global crude oil supply has been generally lowered. The production increase in non-OPEC+ countries is limited, and the actual effect of OPEC+'s gradual lifting of production cuts is lower than expected. However, the US shale oil production is on a strong upward trend. The EIA predicts that the total US crude oil production in 2025 will reach 13.61 million barrels per day, making it the largest source of supply growth in the world. If OPEC+ continues to increase production, the IEA predicts that the global crude oil supply surplus in 2025 may expand to 1 million barrels per day. At the same time, the uncertainties in the US sanctions policies against oil-producing countries such as Iran and Venezuela, and the fact that Russia's crude oil exports have climbed to a yearly high of 5.7 million barrels per day further increase the pressure on the supply side.
Demand: The demand side shows a differentiated trend. In March, the IEA lowered the global crude oil demand growth rate in 2025 by 70,000 barrels per day to 1.03 million barrels per day, mainly reflecting the impact of the escalation of trade frictions on the macro economy. On the other hand, OPEC maintains an optimistic forecast of 1.45 million barrels per day, emphasizing the resilience of air travel and consumption in emerging economies. The EIA has raised the demand growth rate to 1.37 million barrels per day and expects the growth rate to further rise to 1.61 million barrels per day in 2026.
USOil
🎁 Buy@66.80 - 66.90
🎁 SL 66.50
🎁 TP 68.80 - 69.00
Traders, if you liked this idea or if you have your own opinion about it, write in the comments. I will be glad
If you also aspire to achieve financial freedom,Follow the link below to get my daily strategy updates

USOILHello friends
Due to the price falling in the identified support area, buyers were able to support the price, but given the weakness of the trend we are witnessing, it seems that sellers have more power...
Now, for the price to rise, the identified resistance must be broken, and for the price to fall, if the support is broken, the price will continue to fall.
*Trade safely with us*

Will Oil Prices Ignite Amid a Middle East War?The global oil market is critical, with geopolitical tensions in the Middle East potentially leading to significant price fluctuations. Recent military actions by the U.S. against Yemen's Houthi group have contributed to rising oil prices, as Brent crude futures reached $71.21 per barrel and U.S. West Texas Intermediate crude futures hit $67.80 per barrel. Positive economic indicators from China, including increased retail sales, have supported oil prices despite global economic slowdown concerns.
The Middle East remains a focal point for oil price volatility due to its strategic importance in global oil supply. Iran, a major oil producer, could face disruptions if tensions escalate, potentially driving prices higher. However, global spare capacity and demand resilience might cap long-term increases. Historical events like the 2019 Saudi oil facility attacks demonstrate the market's sensitivity to regional instability, with prices spiking by $10 following the incident.
Analysts predict that if the conflict escalates to close the Strait of Hormuz, oil prices could exceed $100 per barrel. Nevertheless, historical data suggests that prices may stabilize within a few months if disruptions prove temporary. The delicate balance between supply shocks and market adjustments underscores the need to closely monitor geopolitical developments and their economic ripple effects.
As global economic uncertainties overshadow geopolitical risks, maintaining market confidence will depend on sustained positive economic data from countries like China. The potential for peace negotiations in Ukraine and changes in U.S. sanctions could also impact oil prices, making this a pivotal moment for global energy markets.

WTI OIL turned the 4H MA50 into Support and aiming higher.WTI Oil (USOIL) has broken above the bearish trend of the former Lower Highs and a Channel Up emerged. The 4H MA50 (blue trend-line) broke for the first time in almost a month and has now been turned into Support.
As long as this holds, we expect Oil to target the 4H MA200 (orange trend-line) at $70.
-------------------------------------------------------------------------------
** Please LIKE 👍, FOLLOW ✅, SHARE 🙌 and COMMENT ✍ if you enjoy this idea! Also share your ideas and charts in the comments section below! This is best way to keep it relevant, support us, keep the content here free and allow the idea to reach as many people as possible. **
-------------------------------------------------------------------------------
Disclosure: I am part of Trade Nation's Influencer program and receive a monthly fee for using their TradingView charts in my analysis.
💸💸💸💸💸💸
👇 👇 👇 👇 👇 👇

Next Week's Trading Blueprint for USOILThis week, U.S. crude oil closed at $67.18, with a weekly increase of 0.2%. Next week, there is sufficient upward momentum. The United States has tightened sanctions on Iran, and there is a risk of supply contraction. Moreover, the decline in U.S. gasoline inventories far exceeds expectations, indicating strong demand. Technically, if the key resistance level of $69.00 is breached, an upward space will be opened, and the bullish forces are expected to push up the price of U.S. crude oil.
USOIL Trading Strategy for Next Week:
buy@ 65-66.5
tp:69-70
I firmly believe realized profit and a high win - rate are the best measures of trading skill. Daily, I share highly precise trading signals. These include clear entry points, stop - loss levels for risk control, and profit - taking targets from in - depth analysis. Follow me for big financial market returns. Click my profile for a trading guide on trends, strategies, and risk management.

Weekly Market Forecast WTI CRUDE OIL: Bearish! Wait For SellsThis forecast is for the week of March 17 - 21st.
WTI Crude Oil is in consolidation, but forming a wedge pattern. As the market condenses, we no watch out for a breakout that could go in either direction. But if we take note of the Weekly bearish FVG that formed last week, we simply wait for price to sting into it and use it to move lower. The market is weak, and has been trending down for over two months now. Using the trend and the -FVG, the higher probability is for price to continue lower, as long as the -FVG holds.
Check the comments section below for updates regarding this analysis throughout the week.
Enjoy!
May profits be upon you.
Leave any questions or comments in the comment section.
I appreciate any feedback from my viewers!
Like and/or subscribe if you want more accurate analysis.
Thank you so much!
Disclaimer:
I do not provide personal investment advice and I am not a qualified licensed investment advisor.
All information found here, including any ideas, opinions, views, predictions, forecasts, commentaries, suggestions, expressed or implied herein, are for informational, entertainment or educational purposes only and should not be construed as personal investment advice. While the information provided is believed to be accurate, it may include errors or inaccuracies.
I will not and cannot be held liable for any actions you take as a result of anything you read here.
Conduct your own due diligence, or consult a licensed financial advisor or broker before making any and all investment decisions. Any investments, trades, speculations, or decisions made on the basis of any information found on this channel, expressed or implied herein, are committed at your own risk, financial or otherwise.

Nasdaq 100 (NQ1!) - Key Levels and Market Outlook 📌 Market Structure
🔹 Key Support Zone (~19,170 USD)
The price recently bounced off this level, which has acted as a significant support area.
The highlighted gray-blue zone represents a demand area where buyers stepped in.
🔹 Intermediate Resistance (~19,800 - 20,200 USD)
The price is currently testing this zone, which was previously a key breakdown area.
A strong rejection here could push the index back towards the 19,170 USD support.
🔹 Major Supply Zone (~21,500 - 22,400 USD)
The previous peak around 22,400 USD saw strong selling pressure, leading to a sharp drop.
The red-shaded area represents a heavy supply zone where sellers were dominant.
📉 Bearish Scenario
A rejection at 19,800 - 20,200 USD could lead to another retest of 19,170 USD.
A break below 19,170 USD would expose the index to further downside, possibly towards 18,500 - 18,200 USD.
📈 Bullish Scenario
A break and close above 19,800 - 20,200 USD could trigger a move towards 21,000 - 21,500 USD.
A sustained breakout above 22,400 USD would invalidate the bearish structure and signal a continuation of the uptrend.
🔎 Conclusion:
The Nasdaq is at a pivotal moment, hovering around key resistance at 19,800 - 20,200 USD.
A breakout or rejection from this zone will determine the short-term direction.
Key factors to watch include economic data, Fed policy, and overall market sentiment.

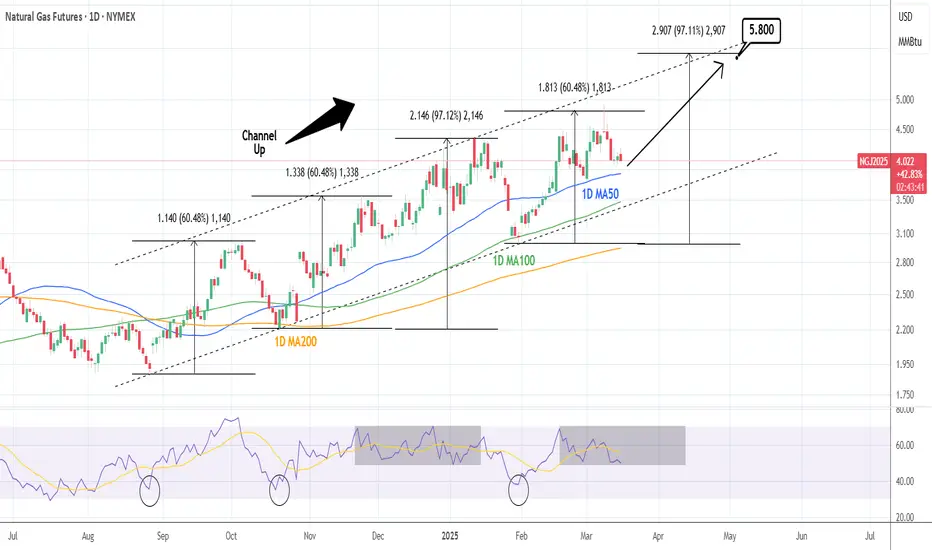
NATURAL GAS: One more technical push.Natural Gas is neutral on its 1D technical outlook (RSI = 49.489, MACD = 0.098, ADX = 23.222), which is the ideal buy opportunity inside its 8 month Channel Up, as long as the 1D MA100 holds. The last HH peaked at +97.12% before pulling back to the 1D MA100. The trade is long, TP = 5.800.
See how our prior idea has worked out:
## If you like our free content follow our profile to get more daily ideas. ##
## Comments and likes are greatly appreciated. ##
Potential bearish drop?USO/USD has reacted off the resistance level which is a pullback resistance that lines up with the 61.8% Fibonacci retracement and could drop from this level to our take profit.
Entry: 68.43
Why we like it:
There is a pullback resistance level that lines up with the 61.8% Fibonacci retracement.
Stop loss: 69.26
Why we like it:
There is a pullback resistance level that aligns with the 50% Fibonacci retracement.
Take profit: 66.46
Why we like it:
There is a pullback support level.
Enjoying your TradingView experience? Review us!
Please be advised that the information presented on TradingView is provided to Vantage (‘Vantage Global Limited’, ‘we’) by a third-party provider (‘Everest Fortune Group’). Please be reminded that you are solely responsible for the trading decisions on your account. There is a very high degree of risk involved in trading. Any information and/or content is intended entirely for research, educational and informational purposes only and does not constitute investment or consultation advice or investment strategy. The information is not tailored to the investment needs of any specific person and therefore does not involve a consideration of any of the investment objectives, financial situation or needs of any viewer that may receive it. Kindly also note that past performance is not a reliable indicator of future results. Actual results may differ materially from those anticipated in forward-looking or past performance statements. We assume no liability as to the accuracy or completeness of any of the information and/or content provided herein and the Company cannot be held responsible for any omission, mistake nor for any loss or damage including without limitation to any loss of profit which may arise from reliance on any information supplied by Everest Fortune Group.

BRENT SELL/SHORTBy utilizing Fibonacci retracement levels, historical patterns, , we can formulate a hypothesis that the market might follow a similar trajectory if bearish sentiment prevails.

USOIL Analysis of TodayThe global economic situation has a significant impact on the demand for crude oil.
During periods of economic prosperity, industrial production and transportation activities are frequent, leading to an increase in the demand for crude oil, which in turn drives up the price of USOIL.
For example, during the period of rapid development of emerging economies, the demand for energy was robust. When there is an economic recession, the demand decreases, and the price may drop. Just like after the global financial crisis in 2008, the demand for crude oil plummeted sharply, and the price also crashed accordingly. In terms of supply, the changes in production output of major oil-producing countries are of vital importance.
The adjustment of production capacity and production disruptions in major oil-producing countries such as the United States, Saudi Arabia, and Russia will all affect the global crude oil supply. For instance, the development of the shale oil industry in the United States has significantly increased the country's crude oil production, having a major impact on the global crude oil market supply pattern.
🎁 Buy@66.90 - 67.00
🎁 SL 66.80
🎁 TP 67.15 - 67.20
Traders, if you liked this idea or if you have your own opinion about it, write in the comments. I will be glad
If you also aspire to achieve financial freedom,Follow the link below to get my daily strategy updates
