Crude Oil Prices: Double-Edged Sword for Indian Marketers
The global crude oil market, a volatile beast, dictates the energy landscape for nations worldwide.1 For India, a nation heavily reliant on oil imports, the fluctuations in crude oil prices carry significant implications.2 While a dip in crude oil prices might seem like a welcome relief, especially for consumers, it presents a complex and often challenging scenario for oil marketing companies (OMCs) operating within the Indian market. This seemingly beneficial drop in prices acts as a double-edged sword, bringing with it a unique set of complexities that stem from market dynamics, government policies, and the intrinsic characteristics of the oil and gas sector.3
The initial and seemingly positive impact of lower crude oil prices is the potential for reduced import costs.4 For a country like India, where a substantial portion of its energy needs are met through imports, this can lead to a decrease in the overall expenditure on crude oil. This reduction can, in turn, alleviate pressure on the nation's current account deficit and theoretically translate to lower fuel prices for consumers. However, this potential benefit is often overshadowed by the ever-present threat of government intervention through excise duty hikes.
Governments, seeking to bolster their revenue, often capitalize on falling crude oil prices by increasing excise duties on petrol and diesel.5 This strategic move allows them to capture a significant portion of the savings that would otherwise be passed on to consumers. For OMCs, this translates to a reduction in the potential for increased margins. While they still benefit from reduced raw material expenses, the extent of the gain is substantially diminished. This delicate dance between market forces and government policies creates a complex environment for OMCs to navigate.
Furthermore, the expectation of price cuts for end consumers becomes a significant challenge for OMCs. Consumers naturally anticipate a corresponding reduction in fuel prices when crude oil prices decline. However, OMCs must carefully balance this expectation with the need to maintain their financial health. Rapid and substantial price cuts can strain their profitability, especially when coupled with excise duty adjustments. This balancing act requires a delicate approach, as OMCs must ensure their financial stability while remaining responsive to consumer demands.
Beyond the immediate impact on OMCs, lower crude oil prices pose a significant challenge to the upstream oil and gas sector. Upstream companies, involved in exploration and production, are directly affected by the decline in realized prices for their crude oil. This can lead to reduced profitability, delayed or cancelled investment projects, and even financial distress for some companies. The economic viability of many oil and gas fields is contingent on a certain price threshold. When prices fall below this level, production becomes less attractive, potentially hindering future energy security.
The impact on the gas sector is particularly noteworthy. Natural gas economics are often intertwined with crude oil prices, with gas prices sometimes linked to oil price benchmarks.6 A decline in crude oil prices can thus indirectly affect gas prices, making gas production and distribution less profitable. This can have broader implications for the energy sector, as natural gas is increasingly seen as a cleaner alternative to other fossil fuels.7 Reduced investment in gas infrastructure and production can hinder the transition towards a more sustainable energy mix.
Moreover, the volatility associated with fluctuating crude oil prices creates uncertainty for OMCs and the entire energy sector.8 Long-term planning and investment decisions become more difficult when the market is subject to rapid and unpredictable price swings. This uncertainty can deter investment in new projects and hinder the development of a stable and reliable energy supply. This volatility necessitates a robust and adaptable strategy for OMCs to navigate the unpredictable market.
From a macroeconomic perspective, while lower crude prices can potentially stimulate economic activity by reducing fuel costs for businesses and consumers, the potential for reduced government revenue due to lower oil prices (if excise duties are not increased) must be considered. In a country like India, where government revenue is crucial for funding infrastructure projects and social programs, a significant decline in oil-related revenue can have far-reaching consequences. This highlights the need for a balanced approach to fiscal policy, ensuring that government revenue remains stable while providing relief to consumers.
The challenges posed by lower crude oil prices highlight the need for a balanced and nuanced approach to energy policy. Governments must strike a delicate balance between providing relief to consumers, maintaining fiscal stability, and supporting the long-term health of the oil and gas sector. This requires careful consideration of excise duty adjustments, pricing mechanisms, and investment incentives. A coherent and forward-looking energy policy is essential to navigate the complexities of the global crude oil market and ensure the nation's energy security.
In conclusion, while lower crude oil prices may appear to be a boon, they present a complex set of challenges for OMCs and the broader Indian oil and gas sector. The potential for excise duty hikes, concerns about price cuts, and the impact on upstream realisations and gas economics create a double-edged sword scenario. Navigating this complex landscape requires careful policy decisions and a comprehensive understanding of the intricate dynamics of the global energy market. OMCs must remain adaptable and resilient, while governments must implement policies that balance consumer needs with fiscal stability and long-term energy security.
Energy Commodities
The Inevitable Descent of UKOILIn the shadow of a market that continues to revel in its own delusions, I find myself compelled to address the elephant in the room – or rather, the oil in the barrel that is UKOIL. We stand on the precipice of what I predict to be a significant correction, one that will see UKOIL prices plummeting to the region of $48 per barrel.
Why the Fall?
OPEC+'s decision to phase out additional output cuts by September 2025, announced in June last year, is a clear signal. The return of 2.2 million barrels per day to the market, should market dynamics permit, will flood an already saturated market. Despite the rhetoric of control, the reality is that OPEC+'s spare capacity, currently at 5.9 million barrels per day, limits any significant price increase. This, coupled with near-record production levels from non-OPEC countries like the United States, sets the stage for an oversupply scenario. The notion that demand will continue to grow unchecked is flawed. Global oil consumption growth is expected to slow dramatically from 2.3 million barrels per day in 2023 to 1.1 million in 2024, with similar levels in 2025. This deceleration is driven by multiple factors including the rise of electric vehicles, increasing efficiency in traditional vehicles, and a stuttering economic recovery in major markets like China. The market's current bullishness is more sentiment than substance. Indicators like the Stoch RSI currently at 77.9 suggest we are nearing overbought territory, a strong indication that a reversal could be imminent. This high reading, combined with the parabolic SAR signaling an upward trend now, might just be the last gasp before a significant correction.
The technical and fundamental analyses converge on a bearish outlook. Long Forecast anticipates Brent oil, which closely tracks UKOIL, to hover around $60-$65 by 2026 before a potential rebound. This, combined with other forecasts suggesting a further decline in demand, paints a picture not of a soft landing, but of a sharp descent. If we extrapolate current trends and market sentiment shifts, $48 is not just a possibility but a probable near-term floor.
Investors should consider reducing exposure to oil-related equities or hedge against the risk through diversification into non-correlated assets. For those with the stomach for risk, this scenario presents a unique opportunity to short UKOIL CFDs. In closing, let us not be swayed by the siren song of current market highs. The fundamentals, much like gravity, will eventually pull prices back to earth. Prepare for the storm, for it's not a matter of if, but when.
Horban Brothers.
Alex Kostenich

CRUDE is looking weak. Price connection is expected#CRUDE #Analysis
Description
---------------------------------------------------------------
+ Crude has formed a nice descending triangle pattern and price has broken down the support line which formed over the years.
+ A clear breakdown from this support would push down the prices further.
+ Next target is 50-40$ range.
---------------------------------------------------------------
Enhance, Trade, Grow
---------------------------------------------------------------
Feel free to share your thoughts and insights. Don't forget to like and follow us for more trading ideas and discussions.
Best Regards,
VectorAlgo

CRUDE OIL Swing Long! Buy!
Hello,Traders!
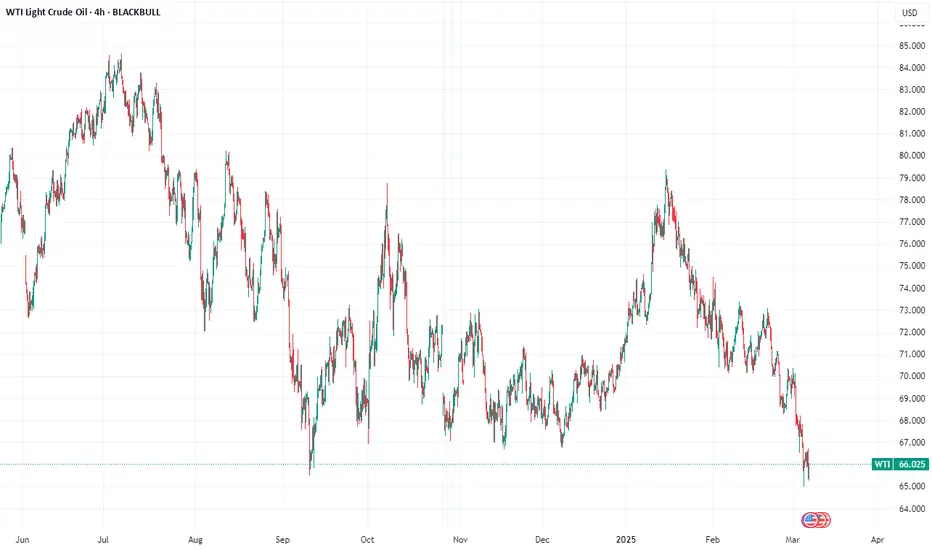
CRUDE OIL fell down
Sharply but the a horizontal
Support was hit around 65.25$
And the price established a
Double bottom pattern so
We will be expecting a
Local bullish rebound
Buy!
Comment and subscribe to help us grow!
Check out other forecasts below too!

Treasury Secretary Bessent: Make Iran broke again Treasury Secretary Scott Bessent, speaking at the Economic Club of New York, said the U.S. is enforcing sanctions on Iran for “immediate maximum impact,” warning that Iranians should move their money out of the rial.
The goal is to cut Iran’s oil exports from 1.5 million barrels per day to near zero.
His comments came as oil prices fell to multiyear lows on Wednesday, driven by concerns that tariffs on Canada, Mexico, and China could slow economic growth and weaken crude demand.
Following Bessent’s remarks, both U.S. crude and Brent prices turned positive, with JP Morgan analysts noting that a decline in Iranian supply is currently the only bullish factor for oil prices.
Bessent also signaled that the administration is prepared to impose full-scale sanctions on Russian energy if it helps lead to a ceasefire in Ukraine. This is a welcome shift from the Trump administration, who so far has only been pressuring the victim of the war rather than the perpetrator.

USOIL Will Go Lower From Resistance! Sell!
Please, check our technical outlook for USOIL.
Time Frame: 1D
Current Trend: Bearish
Sentiment: Overbought (based on 7-period RSI)
Forecast: Bearish
The market is approaching a key horizontal level 6,657.4.
Considering the today's price action, probabilities will be high to see a movement to 6,198.3.
P.S
The term oversold refers to a condition where an asset has traded lower in price and has the potential for a price bounce.
Overbought refers to market scenarios where the instrument is traded considerably higher than its fair value. Overvaluation is caused by market sentiments when there is positive news.
Like and subscribe and comment my ideas if you enjoy them!

Oil Prices Plummet as Trade Tensions RiseOil prices took a hit after Trump's tariffs were announced, and it's essential to understand the reasoning behind this drop.
When US imposed tariffs on Chinese goods, China retaliated by placing tariffs on US goods, including oil. This move led to a decrease in oil demand from China, which is the world's largest oil importer. As a result, oil prices plummeted.
◉ Key Factors Behind the Decline
● Trade Tensions: The escalation of trade tensions between the US and China led to a decrease in oil demand, causing prices to drop.
● China's Tariffs on US Oil: China's decision to impose tariffs on US oil imports reduced demand for US oil, contributing to the price decline.
● Global Economic Slowdown: The ongoing trade tensions and tariffs have led to a slowdown in global economic growth, further reducing oil demand and prices.
● Increased Oil Production: The US has been increasing its oil production, leading to a surplus in the market and contributing to the decline in oil prices.
◉ Technical Observations
● A notable decline in oil prices has been observed since mid-January 2025.
● Prices are currently hovering near the critical support zone around $66, a level that has historically provided a floor for prices.
● If this support level is breached, it may trigger a further decline in oil prices.

WTI CRUDE OIL: Major bullish signal on 1W.WTI Crude Oil turned oversold on its 1D technical outlook (RSI = 30.839, MACD = -1.280, ADX = 30.692) as it entered the 2 year S1 Zone. This is where all major rebounds took place. In the meanwhile a 1W RSI below 40.000 (like now) has been the strongest buy signal in the same period of time. Buy and target the LH Zone (TP = 76.00).
## If you like our free content follow our profile to get more daily ideas. ##
## Comments and likes are greatly appreciated. ##

WTI crude looks set to break $65 handleCrude oil prices have dropping another 4% with Brent reaching its lowest levels since December 2021, after breaking the September 2024 low of $68.60. If Brent is anything to go by, WTI looks like it too will break its corresponding September 2024 low of $64.95 - and therefore the $65.00 psychological level - soon.
Oil price prices have dropped on concerns about the economic impact of Trump's tariffs and after the OPEC+ decided to proceed with a planned April output increase.
Is WTI heading down to $60?
By Fawad Razaqzada, market analyst with FOREX.com

Recap: Short below LIS/Yearly Open Crude OilNYMEX:CL1!
Another day and EdgeClear brings you another recap where one of the highlighted scenarios in our weekly plan for WTI crude oil, published on February 24, 2025 , played out as expected.
Our Scenario 3 looked at price discovery extending the 2025 range into Q4 2024 lower distribution. Our analysis indicated an initial move lower bouncing from CVPOC 2022 support. The key was price moving below key LIS/yearly open. We did not see a bearish head and shoulders pattern develop, however, the rest of the plan played out as expected.
Note the price action till Friday, 28th Feb 2025.
We have been consistently providing traders with a roadmap for WTI crude oil with our thoughts and opinions on the market. WTI crude oil is a fundamental product that is affected by several factors, such as: macro, geopolitical, economic, supply, demand, and oil production dynamics.
Our analysis considers these developments along with auction market theory and key indicators that may be important to watch at times. As an example, for our January 13, 2025, blog , we noted increased volume with increased open interest that drove bullish sentiment in crude oil prices. We also highlighted potential short opportunities that played out per our plan.
For last week’s blog, we noted the overall trend in volume and open interest falling, indicating a potential move lower. This combined with multiple tests of our key LIS/ yearly open, strengthened our thesis for further price discovery lower.
In our blog, we have highlighted two key ranges:
$70 - $75 - Q1 2025 Value Area
$65 - $70 - Q4 2024 Lower Distribution
Focus is shifting towards oil market fundamentals i.e., supply, demand, and production outlook.
While headline news may drive short-term and intraday volatility, investors and market participant’s focus will shift towards oil market fundamentals. On March 3rd, 2025, OPEC+ reaffirmed its decision from December 5, 2024, to proceed with gradual and flexible return of 2.2 mbpd voluntary cuts, starting April 1, 2025. It provided a detailed table along with a cautious approach should this decision require any amendments. In our analysis, while trade war and tariff tantrum create uncertainty around demand outlook, any news providing clarity on tariffs will be considered net positive.

USOIL BUY PositionChart and lines talk to you...
Manage your risk...
R/R4 or more...
Do you think does it worth to risk on this position??

USOIL reaching the vital decision-making point... Are you a Buyer or a Seller at this point?
Chart is clean and clear...

USOIL WTI The price was in a downward trend, moving within a descending channel. A breakout from this channel indicates potential trend reversal or correction.
Consolidation Zone Identified:
The price is currently in a consolidation phase (marked in orange).
A breakout above this zone could confirm bullish momentum, while rejection could push it lower.
Key Resistance Levels for Upside Targets:
If the price breaks above the consolidation zone, it could rally toward 71.246 and 72.103 as potential resistance levels.
Green arrows indicate bullish breakout targets.
Key Support Levels for Bearish Move:
If the price fails to break above the consolidation zone, A further breakdown below this support level could push the price toward 68.400 and 66.888, the next major support.
Conclusion:
The next major move will depend on how price reacts to the consolidation zone. A breakout above could lead to bullish targets, while failure could send prices lower toward the next major support. Traders should watch for confirmation before entering trades. 🚀📉

Oil Under Pressure Amid Tariff Tensions and OPEC+ UncertaintyMacro:
- Oil prices stabilised after hitting multi-month lows as the market weighed potential output increases in Apr and escalating tariff tensions among Canada, Mexico, China, and the EU.
- Meanwhile, the halted US military aid to the Eastern Europe conflict, and OPEC+ production decisions continue to pressure oil.
Technical:
- USOIL remains in a downtrend, consistently making lower lows while trading below both EMAs, signalling persistent bearish momentum. However, the price is nearing the oversold zone, supported by multiple key levels.
- If USOIL continues declining, it may retest 66.90 and 65.80, aligning with the 78.6% Fibonacci Extension.
- Conversely, holding above 66.90 could lead to a short-term sideways movement, with a potential retest at 70.20, confluence with EMA21, and the descending channel’s upper bound.
Analysis by: Dat Tong, Senior Financial Markets Strategist at Exness

WTI Oil H1 | Strong overhead pressuresWTI oil (USOIL) is rising towards an overlap resistance and could potentially reverse off this level to drop lower.
Sell entry is at 68.46 which is an overlap resistance that aligns with the 50.0% Fibonacci retracement level.
Stop loss is at 69.40 which is a level that sits above the 61.8% Fibonacci retracement and an overlap resistance.
Take profit is at 66.82 which is a swing-low support.
High Risk Investment Warning
Trading Forex/CFDs on margin carries a high level of risk and may not be suitable for all investors. Leverage can work against you.
Stratos Markets Limited (www.fxcm.com):
CFDs are complex instruments and come with a high risk of losing money rapidly due to leverage. 63% of retail investor accounts lose money when trading CFDs with this provider. You should consider whether you understand how CFDs work and whether you can afford to take the high risk of losing your money.
Stratos Europe Ltd (www.fxcm.com):
CFDs are complex instruments and come with a high risk of losing money rapidly due to leverage. 63% of retail investor accounts lose money when trading CFDs with this provider. You should consider whether you understand how CFDs work and whether you can afford to take the high risk of losing your money.
Stratos Trading Pty. Limited (www.fxcm.com):
Trading FX/CFDs carries significant risks. FXCM AU (AFSL 309763), please read the Financial Services Guide, Product Disclosure Statement, Target Market Determination and Terms of Business at www.fxcm.com
Stratos Global LLC (www.fxcm.com):
Losses can exceed deposits.
Please be advised that the information presented on TradingView is provided to FXCM (‘Company’, ‘we’) by a third-party provider (‘TFA Global Pte Ltd’). Please be reminded that you are solely responsible for the trading decisions on your account. There is a very high degree of risk involved in trading. Any information and/or content is intended entirely for research, educational and informational purposes only and does not constitute investment or consultation advice or investment strategy. The information is not tailored to the investment needs of any specific person and therefore does not involve a consideration of any of the investment objectives, financial situation or needs of any viewer that may receive it. Kindly also note that past performance is not a reliable indicator of future results. Actual results may differ materially from those anticipated in forward-looking or past performance statements. We assume no liability as to the accuracy or completeness of any of the information and/or content provided herein and the Company cannot be held responsible for any omission, mistake nor for any loss or damage including without limitation to any loss of profit which may arise from reliance on any information supplied by TFA Global Pte Ltd.
The speaker(s) is neither an employee, agent nor representative of FXCM and is therefore acting independently. The opinions given are their own, constitute general market commentary, and do not constitute the opinion or advice of FXCM or any form of personal or investment advice. FXCM neither endorses nor guarantees offerings of third-party speakers, nor is FXCM responsible for the content, veracity or opinions of third-party speakers, presenters or participants.

Hellena | Oil (4H): SHORT to the area of 67,037 (Wave C).The price is still in a downtrend and I believe that before the price starts an upward movement it needs to complete a big “ABC” correction and a small five-wave formation.
I think the price will reach the level of 67,037. This level is quite important, because in its area we need to look carefully for reversal patterns.
Manage your capital correctly and competently! Only enter trades based on reliable patterns!
