USOIL LONG FROM SUPPORT
USOIL SIGNAL
Trade Direction: long
Entry Level: 64.84
Target Level: 70.03
Stop Loss: 61.37
RISK PROFILE
Risk level: medium
Suggested risk: 1%
Timeframe: 9h
Disclosure: I am part of Trade Nation's Influencer program and receive a monthly fee for using their TradingView charts in my analysis.
✅LIKE AND COMMENT MY IDEAS✅
Energy Commodities

Oil Price Falls Below $69Oil Price Falls Below Pre-Escalation Levels of Middle East Conflict
According to the XBR/USD chart:
→ Prior to Israel’s airstrikes on Iran on 13 June, the price of Brent crude was hovering around the $69.00 mark;
→ Following US bombings in Iran, the price spiked at the Monday market open, reaching a high of approximately $77.77 (as we reported on 23 June).
However, after President Trump announced a ceasefire between Iran and Israel — later confirmed by statements from both sides — oil prices dropped sharply. This morning, Brent is trading around $68, which is even lower than the level seen before the initial strikes.
Media outlets report that analysts broadly agree that fears have eased, even if the ceasefire appears fragile. Market participants seem to view the likelihood of the conflict escalating into a full-scale ground war — involving US troops and the closure of the Strait of Hormuz — as low. Shipping through the strait is reportedly returning to normal.
Technical Analysis of the XBR/USD Chart
Interestingly, the $69 level — from which prices surged on 13 June — acted as resistance yesterday (as indicated by the arrow on the chart).
It can be assumed that the longer the ceasefire holds, the less relevant the fears that have served as bullish drivers. In that case, Brent crude prices may continue fluctuating within a downward channel, outlined in red, with the possibility of a short-term rise toward its upper boundary.
Nevertheless, the key drivers for oil prices will remain the fundamental backdrop and official statements regarding the situation in the Middle East and other geopolitical factors.
This article represents the opinion of the Companies operating under the FXOpen brand only. It is not to be construed as an offer, solicitation, or recommendation with respect to products and services provided by the Companies operating under the FXOpen brand, nor is it to be considered financial advice.

Is WW3 Coming? Crude Waves Flash Warning which I DO NOT LIKE ITI’m getting a knot in my stomach looking at this chart, it feels like a warning about what’s coming.
Chart Context
• WTI jumped from the pandemic low of 6.62 up to 131.02 on March 6, 2022.
• It then retraced to 59.86 (38 % Fib) by June 4, 2025.
• That pullback seems complete, and now price is pressing against a descending wedge.
Wave Map
• Wave 3 could extend toward 207
• A full five-wave run points up near 330
• The pattern is squeezed in a tightening channel that looks ready to break any day
Why It Feels Risky
Breaking above 200 normally requires a major supply shock—think trouble at the Strait of Hormuz, surprise OPEC cuts, or a hit to U.S. shale. The Iran–Israel cease-fire is shaky, drones are still buzzing storage sites, and even a brief chokepoint shutdown would send tanker traffic into chaos. To me, the chart is flashing that tail risk.
Trading Plan
• I’ll watch the wedge’s upper trendline around 83 for my first signal
• A weekly close above 93 would clear the path to 117, then 145
• If price closes below 51 on the week, this thesis is off
Your Thoughts?
Does this wave count make sense, or am I reading too much into it? Drop your views—especially if you’ve got the geopolitical angle covered. I hope this wave doesn’t play out, but pretending it’s not there feels reckless.
(Not financial advice)

WTI Oil H4 | Continuation of downward trajectory?WTI oil (USOIL) is rising towards a pullback resistance and could potentially reverse off this level to drop lower.
Sell entry is at 67.15 which is a pullback resistance that aligns with the 23.6% Fibonacci retracement.
Stop loss is at 70.30 which is a level that sits above a pullback resistance.
Take profit is at 62.49 which is a swing-low support.
High Risk Investment Warning
Trading Forex/CFDs on margin carries a high level of risk and may not be suitable for all investors. Leverage can work against you.
Stratos Markets Limited (tradu.com ):
CFDs are complex instruments and come with a high risk of losing money rapidly due to leverage. 63% of retail investor accounts lose money when trading CFDs with this provider. You should consider whether you understand how CFDs work and whether you can afford to take the high risk of losing your money.
Stratos Europe Ltd (tradu.com ):
CFDs are complex instruments and come with a high risk of losing money rapidly due to leverage. 63% of retail investor accounts lose money when trading CFDs with this provider. You should consider whether you understand how CFDs work and whether you can afford to take the high risk of losing your money.
Stratos Global LLC (tradu.com ):
Losses can exceed deposits.
Please be advised that the information presented on TradingView is provided to Tradu (‘Company’, ‘we’) by a third-party provider (‘TFA Global Pte Ltd’). Please be reminded that you are solely responsible for the trading decisions on your account. There is a very high degree of risk involved in trading. Any information and/or content is intended entirely for research, educational and informational purposes only and does not constitute investment or consultation advice or investment strategy. The information is not tailored to the investment needs of any specific person and therefore does not involve a consideration of any of the investment objectives, financial situation or needs of any viewer that may receive it. Kindly also note that past performance is not a reliable indicator of future results. Actual results may differ materially from those anticipated in forward-looking or past performance statements. We assume no liability as to the accuracy or completeness of any of the information and/or content provided herein and the Company cannot be held responsible for any omission, mistake nor for any loss or damage including without limitation to any loss of profit which may arise from reliance on any information supplied by TFA Global Pte Ltd.
The speaker(s) is neither an employee, agent nor representative of Tradu and is therefore acting independently. The opinions given are their own, constitute general market commentary, and do not constitute the opinion or advice of Tradu or any form of personal or investment advice. Tradu neither endorses nor guarantees offerings of third-party speakers, nor is Tradu responsible for the content, veracity or opinions of third-party speakers, presenters or participants.

CRUDE OIL (WTI): Bullish Move From Support
WTI Crude Oil may continue rising from an underlined blue support cluster.
As a confirmation, I see a quick liquidity grab below that and a consequent
bullish imbalance candle on an hourly time frame.
I expect a rise to 66.24
❤️Please, support my work with like, thank you!❤️

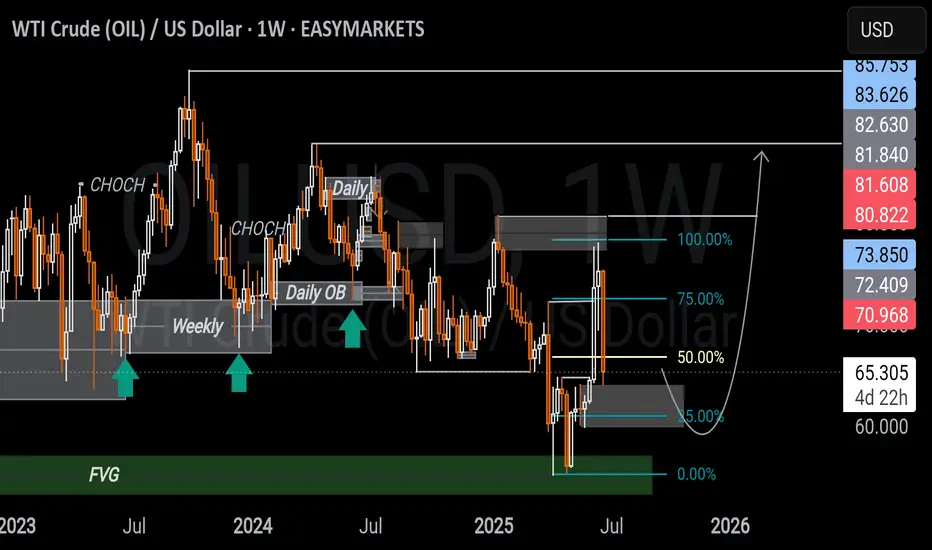
WTI CRUDE OIL USD WEEKLY ANALYSIS Price is reacting from a weekly FVG just below the 50% of a larger range, with some bullish momentum possibly fueled by recent geopolitical tensions.
But price is still within a bearish range acting as resistance, so upside may remain limited unless structure shifts.
A daily bullish OB below the 50% of that range could offer a solid pullback entry if price retraces which is aligning with the broader narrative and upside liquidity. Im having a neutral view of this and leveraging on both sides.
What are your thoughts?
Will crude oil prices continue to decline?On Tuesday, oil prices fell by 6%, hitting a two-week low, as market expectations that a ceasefire between Israel and Iran would reduce the risk of supply disruptions in Middle Eastern oil. WTI crude oil fell below $64 per barrel intraday, eventually closing down 3.35% at $64.96 per barrel; Brent crude oil closed down 3.7% at $67.73 per barrel. With the easing of the Israel-Iran conflict, the trading logic of the crude oil market will return to fundamentals. For now, the consumption peak season has hedged the pressure from OPEC+ production increases. Although U.S. crude oil demand has not shown eye-catching performance, OPEC+ production increases have also fallen short of expectations. In the later stage, attention needs to be paid to the geopolitical situation and the landing of OPEC+ production increases. Looking ahead to the second half of the year, factors such as continued OPEC+ production increases, weak demand, and supply surplus will still dominate oil price movements. The daily chart of crude oil closed with a bearish hammer line, in a two-day bearish pattern. After breaking the high, crude oil fell rapidly, indicating signs of the end of the oil price rally. Today, the focus is on whether the oil price continues to break down.
you are currently struggling with losses,or are unsure which of the numerous trading strategies to follow,You have the option to join our VIP program. I will assist you and provide you with accurate trading signals, enabling you to navigate the financial markets with greater confidence and potentially achieve optimal trading results.
Trading Strategy:
sell@67.0-68.0
TP:63.0-64.0

NATGAS SUPPORT AHEAD|LONG|
✅NATGAS is going down now
But a strong support level is ahead at 3.450$
Thus I am expecting a rebound
And a move up towards the target of 3.600$
LONG🚀
✅Like and subscribe to never miss a new idea!✅
Disclosure: I am part of Trade Nation's Influencer program and receive a monthly fee for using their TradingView charts in my analysis.

CRUDE set to fire 82 $ 90 $ 104 $ ????Crude Daily Elliot waves count suggest big UP setup in progress right now
55 $ key level to watch for buyer Extension point
Due to amid middle-east war situation may trigger Up move impulse wave towards 82 $ to 104 $ range
EW count are keeping changing during different price action in different time frame & multiple forecast .
this educational based chart as per EW theory method

CRUDE OIL poised to go UP AGAIN? Usually my posts on crude oil are short. but here’s a longer one for a change.
Back in December, I predicted that crude oil would hit the highlighted zone around $57. That’s exactly what happened, hit the target and bounced.
Over the past two weeks, we’ve seen wild swings in crude oil prices as tensions between Iran and Israel escalated. But now, following the ceasefire announcement brokered by President Trump, and considering Iran’s response over the past couple of days, crude oil has dropped below its pre-conflict price levels.
While I truly hope for a peaceful world where no innocent lives are harmed, my personal view is that this ceasefire feels fragile and may not last long.
So, what’s next for crude oil? Up or down?
If the ceasefire holds and we don’t see further conflict in the Middle East, I think crude oil could hover in the $65–$75 range. There’s even a slim chance we dip as low as $45.
However, based on my technical analysis model, and my doubts about the durability of the ceasefire, I expect oil prices to rise in the next 6 to 9 months. My targets? $78 and $85.
Of course, I might be wrong this time. :)
Cheers!

Crude Oil Gets Trapped Back Inside 3-Year Down trending ChannelAfter failing to close above the upper border and the 78 resistance level, and amid renewed hopes for a Middle East ceasefire, oil prices dropped sharply back toward the neckline of the inverted head and shoulders formation—initially broken ahead of the recent war escalation—at 64.70.
A sustained move below that neckline could target crude prices toward the mid-zone of the established channel, near 63.40 and 61.40, where another rebound may take shape.
On the upside, if a clear recovery re-emerges above the 72-mark, the potential for a breakout above the 78-resistance could return, opening the door to revisit the 80 and 83.50 highs.
— Razan Hilal, CMT

Oil Price: Breakout or Fakeout? Watch This Zone Closely Technical Overview:
The current price action is testing the upper boundary of a descending wedge, a bullish reversal pattern. The recent strong green candle indicates a potential breakout attempt, yet price is hovering near a critical resistance level at $74.20 (Fib 0.5).
Key levels from the Fibonacci retracement are:
🔼 Resistance at $74.20 (0.5), then $78.16 (0.618)
🧲 Local support at $69.78 (0.382)
🛡️ Strong demand zone near $63.81 (0.236) if rejection occurs
Structure + Patterns:
Price has been compressing inside a falling wedge, which statistically resolves to the upside.
The breakout candle broke above the 20 EMA and touched the upper wedge resistance — signaling a decision point.
Volume is rising on bullish candles — initial confirmation of buyer interest, but not yet decisive.
Scenarios to Watch
Bullish Case:
Break and close above $74.20 on higher volume → likely move toward $78–$86 resistance zone.
Confirmation of wedge breakout could trigger trend reversal, aligning with bullish fib levels.
Momentum could accelerate if macro factors support demand (see geopolitics below).
Bearish Case:
Failure to close above $74.20 = fakeout risk → price may reject down to $69.78 or even retest $63.81.
Bearish rejection wick on the daily/4H would be an early signal.
Macro & Geopolitical Factors to Monitor:
Middle East Tensions: Any escalation (especially around Iran or shipping lanes) could spike oil due to supply fears.
US Strategic Reserves & Elections: Moves to refill reserves or control inflation could support demand.
China Demand Recovery: Data showing improved industrial output or stimulus from PBoC may strengthen global oil outlook.
Final Thoughts:
Price is at a pivot zone — breaking this wedge with strength could shift the short-to-midterm trend. Until then, this remains a "show me" breakout . Watch how the next 1–2 weekly candles close around the $74–$75 area to confirm direction.


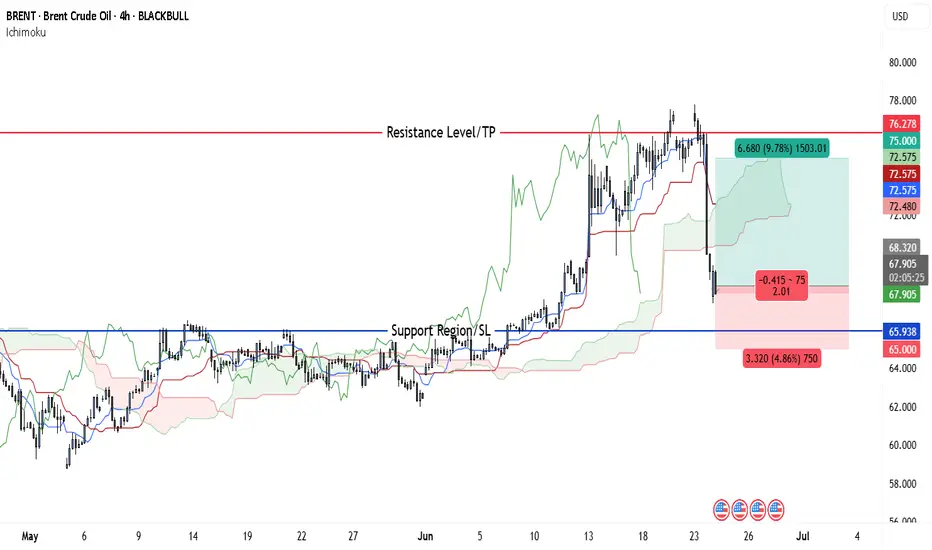
Crude Could Rally to $75 — Entry Opportunity Still Alive at $68Brent Crude Oil is setting up for a potential bullish continuation on the 4-hour timeframe. After a sharp pullback from its recent high near $76.28, price found support around the $65.93–$66 zone—an area that previously acted as strong resistance and now serves as a bullish flip level. The price is consolidating above this reclaimed support and forming a base within the Ichimoku cloud, indicating a possible accumulation phase before the next leg higher.
Ichimoku components support the bullish outlook: the cloud remains green, the Tenkan-sen is curling upward, and price is stabilizing above both the Kijun-sen and the flat Senkou Span A. These are typically early signs of a bullish continuation. The bullish thesis is further strengthened by broader geopolitical risks, particularly Iran’s increased influence over the Strait of Hormuz, which remains a critical oil transit route. Any disruption in this corridor could immediately pressure global supply and send oil prices higher.
This aligns with recent bullish projections (not exactly with the pricing but with the intent): Citi forecasts Brent could reach $75–78 if Iran related disruptions cut 1.1 mbpd, while Goldman and JPMorgan warn $100–120+ spikes if the Strait of Hormuz is threatened. The Guardian notes the shipping chokepoint transports ~20% of global oil, and even brief disruptions could add $8–30 / barrel in volatility.
Trade Setup:
• Entry: $67–$68
• Stop-Loss: $65
• Take Profit: $75
This provides a risk-reward ratio of 1:4, with nearly 12% upside potential. Given the convergence of strong technical structure and real-world catalysts, this setup offers a compelling opportunity for bullish Brent traders aiming to catch the next breakout.
The latest layout for crude oil today.With geopolitical risks gradually easing, oil prices have deviated significantly from macroeconomic and fundamental guidance. While Iran's situation has shown signs of mitigation, the single-day decline in oil prices was excessive. We believe current oil prices have reached a reasonable range: short positions can still be held, but chasing further shorting is no longer advisable.
On the daily chart, crude oil formed a large bearish candlestick with both no upper and lower shadows, directly breaking below support and continuing to decline. After breaking above the previous high, the breakdown of support indicates that oil prices are falling back again to seek a new trading range. Today, the focus remains on the sustainability of the bearish momentum.
you are currently struggling with losses,or are unsure which of the numerous trading strategies to follow,You have the option to join our VIP program. I will assist you and provide you with accurate trading signals, enabling you to navigate the financial markets with greater confidence and potentially achieve optimal trading results.
Trading Strategy:
sell@68.5-69.0
TP:64.5-64.0

USOIL Potential UpsidesHey Traders, in tomorrow's trading session we are monitoring USOIL for a buying opportunity around 72.00 zone, USOIL is trading in an uptrend and currently is in a correction phase in which it is approaching the trend at 72 support and resistance area.
Trade safe, Joe.

Crude oil is displaying serious weaknessCrude oil is trapped in a descending triangle after a blow off top. might take some time to play out but target for crude oil based on the triangle is 42-40 crude oil.

Is the oil market signalling de-escalation?After an initial 6% spike at the open, U.S. crude oil futures reversed sharply—falling into negative territory—as markets priced in the possibility that Iran's latest retaliation may be more symbolic than escalatory.
According to President Donald Trump, Iran gave advance notice before launching missiles at a U.S. base in Qatar, allowing defences to intercept the attack and resulting in no reported casualties.
While Tehran publicly described the strike as “devastating and powerful,” the lack of impact on the ground and the pre-warning have fuelled speculation that Iran was aiming to save face without triggering a broader conflict.
The swift reversal in oil prices reflects that sentiment. For now, the market appears to be signaling that escalation may pause here.

Brent Crude still in controlled yr 2025 range ~ 75 - 71 - 63 USThe Brent crude oil price today underwent a technical correction in the D1 / Day time frame as seen from a technical analysis standpoint. It has not yet broken out to indicate Panic in markets of while being within controlled thresholds .
2025 opening price level : USD 75 ;
MAY face support at USD 71 which is JUNE resistance ; can range around this price line
Next drop below June 2025 opening price : USD 63
Experience in markets also say that in order to go Up , markets need a timely Correction (preliminary down move )too !!
Time to Wait and Watch !

WTI CRUDE OIL: Massive 4H MA50 bearish breakout.WTI Crude Oil has turned neutral again on its 1D technical outlook (RSI = 48.933, MACD = 2.900, ADX = 47.682) as it just broke with force under the 4H MA50. Every time this has taken place in the recent past, a strong downtrend followed. The last such selling sequence dropped by -23.71%. The 4H RSI is on the exact same spot as then. We are bearish, TP = 59.00.
See how our prior idea has worked out:
## If you like our free content follow our profile to get more daily ideas. ##
## Comments and likes are greatly appreciated. ##

KOG - OILQuick look at Oil. There is a pivot here in the golden zone around the 70.5 level which we can dip into. Above that level, we would be looking for higher oil with the potential target level on the chart. Note, oil is due a huge pull back, so rejection from one of these resistance levels can give us that pull back in order to get better pricing to long.
We've added the red boxes from the indicator to help you navigate the move.
Please do support us by hitting the like button, leaving a comment, and giving us a follow. We’ve been doing this for a long time now providing traders with in-depth free analysis on Gold, so your likes and comments are very much appreciated.
As always, trade safe.
KOG

Yen slides on oil supply jitters after US attack on IranThe Japanese yen has started the week with sharp losses. In the European session, USD/JPY has jumped 1.2% on the day and is trading at 147.82. The yen has fallen to five-week lows against the US dollar.
The fallout from the US attack on Iranian nuclear facilities over the weekend is being felt in the currency markets. The Japanese yen, traditionally a safe-haven currency, continues to depreciate, in response to rising oil prices.
Oil prices rose to their highest level since January on Monday after the US attack on Iranian nuclear facilities. Iran has threatened to close the Straits of Hormuz, a critical trade route through which 20% of the world's oil supply passes through each day. Oil prices have jumped about 10% since the Israel-Iran war started on June 13 and fears of a disruption to oil supply could further boost oil prices.
As oil prices have climbed, the yen has lost ground, declining 3.0% since the Israel-Iran war started. Japan imports almost all of its oil and the rise in oil prices is hurting Japan's trade balance.
Japan's core inflation rate climbed 3.7% y/y in May, up from 3.5% in April. Core CPI has accelerated for a third straight month and hit its highest level since Jan. 2023. This was above the market estimate of 3.6%. Headline inflation ticked lower to 3.5% from 3.6% in April, below the forecast of 3.6%.
The rise in core CPI supports the case for the Bank of Japan to boost interest rates, but the uncertainty over tariffs and the Israel-Iran war will likely mean that the BoJ will stay on the sidelines in the coming months.
There is resistance at 146.91. Next, USD/JPY is testing resistance at 147.61
146.51 and 145.81 are the next support levels

Brent oilOil prices fell! Trump's tweet sent oil prices lower. But the last three candles were probably because the market was expecting a stronger reaction from Iran, but it is likely that the US will not respond again.
