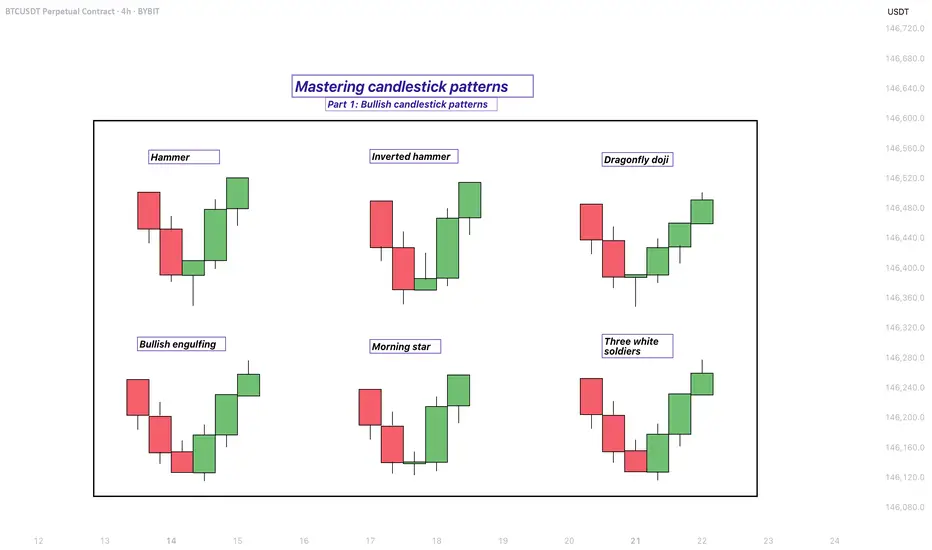
Mastering bullish candlestick patterns - How to use it!In this guide, we will explore some of the most important bullish candlestick patterns used in technical analysis. These patterns are essential tools for traders and investors who want to better understand market sentiment and identify potential reversal points where prices may start moving upward.
What will be explained:
- What are bullish candlestick patterns?
- What is the hammer?
- What is the inverted hammer?
- What is the dragonfly doji?
- What is the bullish engulfing?
- What is the morning star?
- What is the three white soldiers?
- How to use bullish candlestick patterns in trading?
What are bullish candlestick patterns?
Bullish candlestick patterns are specific formations on a candlestick chart that signal a potential reversal from a downtrend to an uptrend. These patterns are used by traders and investors to identify moments when the market sentiment may be shifting from bearish to bullish. Recognizing these patterns can help traders time their entries and make more informed decisions based on price action and market psychology. While no single pattern guarantees success, they can provide valuable clues when combined with other forms of analysis such as support and resistance, trendlines, and volume.
What is the Hammer?
The Hammer is a single-candle bullish reversal pattern that typically appears at the bottom of a downtrend. It has a small real body located at the upper end of the trading range, with a long lower shadow and little to no upper shadow. The long lower wick indicates that sellers drove the price lower during the session, but buyers stepped in strongly and pushed the price back up near the opening level by the close. This shift in momentum suggests that the downtrend could be coming to an end, and a bullish move might follow.
What is the Inverted Hammer?
The Inverted Hammer is another single-candle bullish pattern that also appears after a downtrend. It has a small body near the lower end of the candle, a long upper shadow, and little to no lower shadow. This pattern shows that buyers attempted to push the price higher, but sellers managed to bring it back down before the close. Despite the failure to hold higher levels, the buying pressure indicates a possible reversal in momentum. Traders usually look for confirmation in the next candle, such as a strong bullish candle, before acting on the signal.
What is the Dragonfly Doji?
The Dragonfly Doji is a special type of candlestick that often indicates a potential bullish reversal when it appears at the bottom of a downtrend. It forms when the open, high, and close prices are all roughly the same, and there is a long lower shadow. This pattern shows that sellers dominated early in the session, pushing prices significantly lower, but buyers regained control and drove the price back up by the end of the session. The strong recovery within a single period suggests that the selling pressure may be exhausted and a bullish reversal could be imminent.
What is the Bullish Engulfing?
The Bullish Engulfing pattern consists of two candles and is a strong indication of a reversal. The first candle is bearish, and the second is a larger bullish candle that completely engulfs the body of the first one. This pattern appears after a downtrend and reflects a shift in control from sellers to buyers. The bullish candle’s large body shows strong buying interest that overpowers the previous session’s selling. A Bullish Engulfing pattern is even more significant if it occurs near a key support level, and it often signals the beginning of a potential upward move.
What is the Morning Star?
The Morning Star is a three-candle bullish reversal pattern that occurs after a downtrend. The first candle is a long bearish one, followed by a small-bodied candle (which can be bullish, bearish, or a doji), indicating indecision in the market. The third candle is a strong bullish candle that closes well into the body of the first candle. This formation shows a transition from selling pressure to buying interest. The Morning Star is a reliable signal of a shift in momentum, especially when confirmed by high volume or a breakout from a resistance level.
What is the Three White Soldiers?
The Three White Soldiers pattern is a powerful bullish reversal signal made up of three consecutive long-bodied bullish candles. Each candle opens within the previous candle’s real body and closes near or at its high, showing consistent buying pressure. This pattern often appears after a prolonged downtrend or a period of consolidation and reflects strong and sustained buying interest. The Three White Soldiers suggest that buyers are firmly in control, and the market may continue moving upward in the near term.
How to use bullish candlestick patterns in trading?
To effectively use bullish candlestick patterns in trading, it’s important not to rely on them in isolation. While these patterns can signal potential reversals, they work best when combined with other technical tools such as support and resistance levels, moving averages, trendlines, and volume analysis. Traders should also wait for confirmation after the pattern forms, such as a strong follow-through candle or a break above a resistance level, before entering a trade. Risk management is crucial—always use stop-loss orders to protect against false signals, and consider the broader market trend to increase the probability of success. By integrating candlestick analysis into a comprehensive trading strategy, traders can improve their timing and increase their chances of making profitable decisions.
Thanks for your support. If you enjoyed this analysis, make sure to follow me so you don't miss the next one. And if you found it helpful, feel free to drop a like 👍 and leave a comment 💬, I’d love to hear your thoughts!
Engulfing Candle
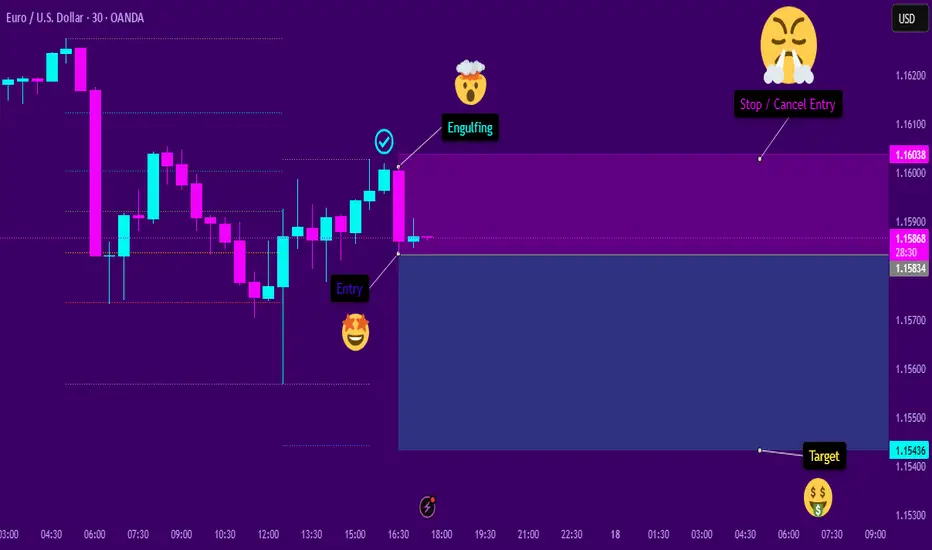
How to Use Engulfing Candles in TradingViewEngulfing patterns are among the most powerful candlestick formations because they signal strong momentum shifts and can help you spot dramatic trend reversal opportunities.
What You'll Learn:
• How to identify valid engulfing formations where one candle completely covers another's body
• The two types: bullish engulfing (green candle engulfs red) and bearish engulfing (red candle engulfs green)
• Psychology behind engulfing patterns: when one side completely overwhelms the other
• Using volume analysis to confirm engulfing pattern validity
• Finding meaningful engulfing patterns at trend highs and lows for reversal setups
• Timeframe considerations for engulfing analysis on any chart period
• Step-by-step trading strategy for engulfing reversal setups
• Setting proper stop losses above engulfing candle highs
• Determining profit targets below engulfing candle lows
• Managing wide-range drawdowns common with strong momentum shifts
• Advanced entry technique: waiting for retracements to improve risk-reward ratios
This tutorial may help futures traders and technical analysts who want to use powerful candlestick patterns to identify significant momentum changes.
The strategies covered could assist you in creating effective reversal setups when strong buying or selling pressure appears at key price levels.
Learn more about futures trading with Tradingview: optimusfutures.com
Disclaimer:
There is a substantial risk of loss in futures trading. Past performance is not indicative of future results. Please trade only with risk capital. We are not responsible for any third-party links, comments, or content shared on TradingView. Any opinions, links, or messages posted by users on TradingView do not represent our views or recommendations. Please exercise your own judgment and due diligence when engaging with any external content or user commentary.
This video represents the opinion of Optimus Futures and is intended for educational purposes only. Chart interpretations are presented solely to illustrate objective technical concepts and should not be viewed as predictive of future market behavior. In our opinion, charts are analytical tools—not forecasting instruments. Market conditions are constantly evolving, and all trading decisions should be made independently, with careful consideration of individual risk tolerance and financial objectives.

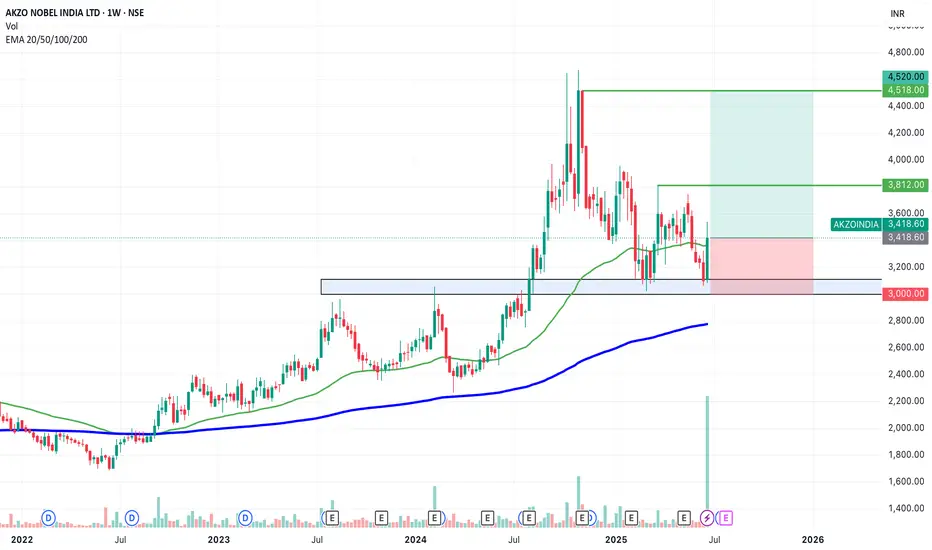
SWING IDEA - AKZO NOBEL INDIA Akzo Nobel India , a subsidiary of the global paints and coatings giant AkzoNobel N.V., is a leading player in India’s decorative and industrial paints market. Known for its premium brand Dulux , the company has strong brand recall, a wide distribution network, and consistent profitability.A strong brand, steady margins, and a bullish chart make this a candidate to watch for a short- to medium-term swing trade.
Reasons are listed below :
Bullish engulfing candle spotted on the weekly timeframe, signaling a potential trend reversal.
Accompanied by the highest-ever volume spike, adding strong conviction to the move.
Price is bouncing off the golden Fibonacci support (0.618), a classic retracement zone where strong reversals often occur.
The level of 3100 acted as a solid support.
The stock is trading above its 50 & 200 EMA on the weekly chart — a sign of long-term strength.
Target - 3812 // 4520
Stoploss - weekly close below 3000
DISCLAIMER -
Decisions to buy, sell, hold or trade in securities, commodities and other investments involve risk and are best made based on the advice of qualified financial professionals. Any trading in securities or other investments involves a risk of substantial losses. The practice of "Day Trading" involves particularly high risks and can cause you to lose substantial sums of money. Before undertaking any trading program, you should consult a qualified financial professional. Please consider carefully whether such trading is suitable for you in light of your financial condition and ability to bear financial risks. Under no circumstances shall we be liable for any loss or damage you or anyone else incurs as a result of any trading or investment activity that you or anyone else engages in based on any information or material you receive through TradingView or our services.
@visionary.growth.insights
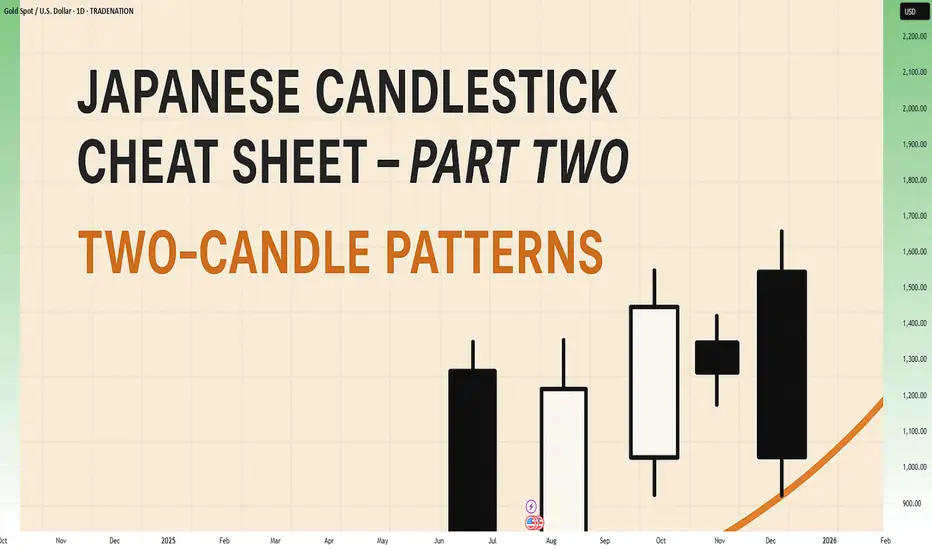
Japanese Candlestick Cheat Sheet – Part Two- 2 candle patternsTwo-Candle Patterns That Signal Shifts in Sentiment
Single candles whisper…
But two candles talk to each other — and when they do, they often reveal the first signs of a reversal or continuation.
In this second part of the series, we go deeper.
From engulfings to haramis, tweezer tops to piercing lines — these patterns don’t just look good on charts… they capture the psychological tug-of-war between buyers and sellers.
Price doesn’t lie.
And two candles in a row can say: “Something just changed.”
Learn to spot them early. Learn to listen when the chart speaks.
This is Part Two of your practical guide to mastering candlestick formations.
BULLISH KICKER
Bias: Bullish
What is the Bullish Kicker pattern?
The Bullish Kicker forms when a strong bullish candle follows a bearish one with no overlap between the two, indicating a sudden shift in sentiment. This pattern is a powerful indicator of a reversal as buyers take control. The sharp contrast between the bearish and bullish candles reflects a dramatic shift in market psychology, where bears are caught off-guard and forced to cover their positions.
Bullish Kickers are rare but extremely telling, providing a clear signal that sentiment is favoring buyers. Recognizing such decisive patterns can be a game-changer.
Meaning:
Found after downtrends or sell-offs; suggests a sudden shift in sentiment, indicating strong buying interest and potential trend reversal.
BULLISH ENGULFING
Bias: Bullish
What is the Bullish Engulfing pattern?
The Bullish Engulfing pattern occurs when a large bullish candle fully engulfs the previous smaller bearish candle, signaling a potential trend reversal. This pattern highlights a moment when buyers overpower sellers, often marking the beginning of upward momentum. Psychologically, it suggests that buyer confidence is returning, and sellers are losing their grip.
For traders, understanding Bullish Engulfing patterns can provide crucial entry points into emerging trends. Learning to identify and trade such patterns is essential for capturing momentum and new trends.
Meaning:
Typically found in downtrends, this pattern signals a potential bullish reversal as buyers overpower sellers, often indicating a shift toward upward momentum.
BULLISH HARAMI
Bias: Bullish
What is the Bullish Harami pattern?
The Bullish Harami consists of a small bullish candle within a preceding larger bearish one, indicating a pause in downward momentum and hinting at a potential reversal. This pattern shows that sellers are beginning to weaken as buyers cautiously test the waters. The Harami reflects a shift in sentiment from bearish to neutral, often marking a transitional phase in the market.
Interpreting the Bullish Harami helps traders spot moments when sentiment is shifting, potentially signaling the start of a trend change.
Meaning:
Seen in downtrends, it suggests indecision, with possible bullish reversal if the following candles confirm buying strength, indicating a weakening bearish trend.
PIERCING LINE
Bias: Bullish
What is the Piercing Line pattern?
The Piercing Line forms when a bullish candle opens below the previous bearish candle’s low but closes over halfway into it. Found in downtrends, this pattern reflects strong buying pressure as buyers step in at lower prices, creating a potential bullish reversal. The Piercing Line pattern suggests that sentiment may be shifting as buyers gain confidence.
This pattern’s strength lies in its psychological impact, revealing moments when buyers are willing to take risks. Recognizing these signs early can provide valuable insights for traders looking to time entries.
Meaning :
Found in downtrends, this pattern suggests a possible bullish reversal if buying continues, as sellers lose control to buyers.
TWEEZER BOTTOM
Bias: Bullish
What is the Tweezer Bottom pattern?
The Tweezer Bottom pattern is characterized by two consecutive candles with nearly identical lows, one bearish and one bullish. This pattern often signals the end of a downtrend, as the matching lows suggest a strong support level where buyers are stepping in. The Tweezer Bottom highlights market psychology at work, with sellers unable to push prices lower, reflecting renewed buying interest.
Tweezer Bottoms are ideal for traders looking to identify support zones and potential reversal points. By understanding this pattern’s significance, traders can make informed decisions.
Meaning:
Found in downtrends, it signals potential reversal, showing strong support at the matching low, suggesting buyers are stepping in.
BEARISH KICKER
Bias: Bearish
What is the Bearish Kicker pattern?
The Bearish Kicker is the inverse of the Bullish Kicker, forming when a strong bearish candle follows a bullish one without overlap, indicating a sharp sentiment shift. This pattern often marks a sudden reversal, with sellers taking control after an initial bullish period. Psychologically, Bearish Kickers are powerful, signaling that buyers are caught off-guard and losing momentum.
Recognizing Bearish Kickers provides traders with insights into sudden shifts in market dynamics, helping them avoid buying into weakening trends.
Meaning:
Found after uptrends; indicates a sudden sentiment shift, signaling potential trend reversal and intensified selling pressure.
BEARISH ENGULFING
Bias: Bearish
What is the Bearish Engulfing pattern?
The Bearish Engulfing pattern forms when a large bearish candle engulfs the previous smaller bullish candle, suggesting a potential reversal in an uptrend. This pattern signals that sellers have regained control, often marking the start of downward momentum. The Bearish Engulfing reveals a psychological shift, as selling pressure overtakes buying interest.
This pattern is a powerful tool for traders who aim to catch trend reversals, allowing them to align with emerging downward momentum.
Meaning:
Typically found in uptrends, this pattern signals a potential bearish reversal as sellers overpower buyers, often indicating a downward momentum shift.
BEARISH HARAMI
Bias: Bearish
What is the Bearish Harami pattern?
The Bearish Harami consists of a small bearish candle contained within a larger preceding bullish one, reflecting indecision and a potential trend reversal. Found in uptrends, it hints that buyers are losing strength, while sellers are cautiously testing the market. This pattern highlights moments when buyer momentum begins to wane, suggesting caution.
Interpreting the Bearish Harami allows traders to spot potential shifts in sentiment, helping them manage risk and time their exits.
Meaning:
Seen in uptrends, it suggests indecision with a potential bearish reversal if following candles confirm, indicating a weakening bullish trend.
DARK CLOUD COVER
Bias: Bearish
What is the Dark Cloud Cover pattern?
The Dark Cloud Cover appears when a bearish candle opens above the previous bullish candle but closes over halfway into it, reflecting a shift in control from buyers to sellers. This pattern suggests that bullish momentum may be fading, hinting at a potential reversal. Dark Cloud Cover patterns reveal moments when sentiment shifts from optimism to caution.
For traders, understanding this pattern helps them anticipate reversals at the top of uptrends.
Meaning:
Found in uptrends; signals potential bearish reversal if selling continues, as buyers lose control to sellers.
TWEEZER TOP
Bias: Bearish
W hat is the Tweezer Top pattern?
The Tweezer Top is formed by two candles with matching or nearly matching highs, typically one bullish and one bearish. This pattern signals potential resistance, as sellers are consistently pushing back against the same level. The Tweezer Top reflects a moment of seller strength, often marking the end of an uptrend.
Recognizing Tweezer Tops helps traders spot resistance zones and potential reversal points, allowing them to avoid buying into weakening trends or even shorting the asset.
Meaning:
Found in uptrends, it signals potential reversal, showing strong resistance at the matching high, suggesting selling pressure.
🧭 Final Thought
Two-candle formations often appear at key turning points — right where most traders hesitate or get trapped.
Learn to read them not just as patterns, but as conversations between candles — one pushing, the other reacting.
And if this is your first time reading the series, don’t miss Part One – where we covered single-candle signals like dojis, hammers, and marubozus — the very foundations of candlestick reading.
Engulfing SellThe asset shows signs of continuation in a downtrend. After a significant retracement at a favorable Fibonacci level, a bearish engulfing pattern appeared. This engulfing pattern resulted in a behavioral shift, causing the temporary pullback to resume its decline. I believe this will be the case, provided that the subsequent candlesticks confirm the entry signal.
ATM_GS : We are nearing...
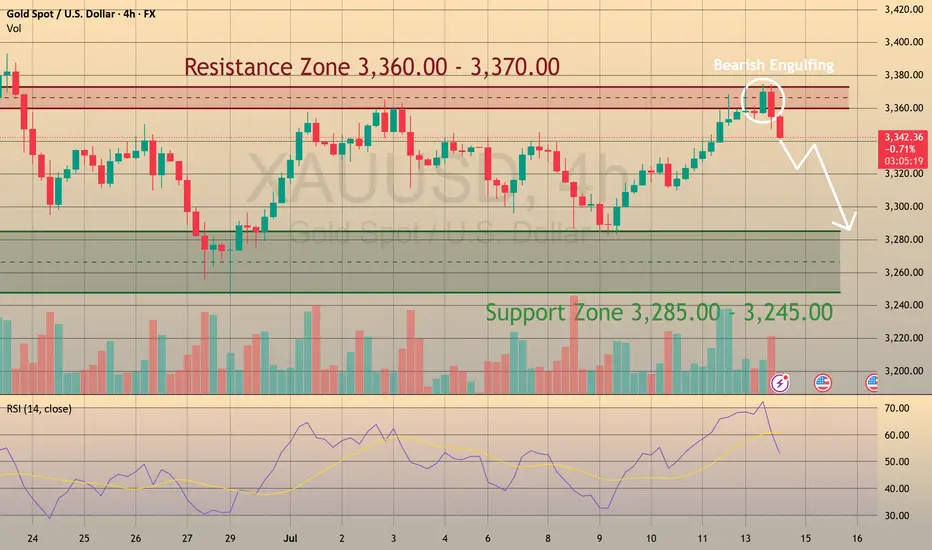
Big Week for Markets: U.S. CPI Tomorrow – What It Means for GoldThis week is packed with news, but the main focus is the U.S. CPI report dropping tomorrow.
🗓 Key Event: U.S. CPI Report
📍 July 15, 2025 | 12:30 p.m. UTC
The CPI report measures inflation and heavily influences the Fed’s rate decisions. Last month’s CPI came in at 2.4% vs. 2.5% expected, following 2.3% vs. 2.4% in April. While it seems inflation is rising, the bigger picture shows stable annual inflation in the 2.3%–3.0% range, keeping things under control—likely the reason Trump is pressuring Powell to cut rates.
Market expects June CPI to be 2.7%.
🤔 Possible Scenarios:
1️⃣ CPI > 2.7%: Bullish for DXY 📈. The stronger the print, the bigger the spike, but I see this scenario as less probable.
2️⃣ CPI < 2.7%: Bearish for DXY 📉. We may see a USD dump, though likely shallow since CPI could still be higher than previous months.
✨ What About Gold?
I don’t expect a major reaction in gold:
✅ Higher CPI? Gold often benefits as an inflation hedge.
✅ Lower CPI? Also supportive for gold as it weighs on the USD.
🔍 Technical Outlook:
Gold has been trading within a triangle since April 22, forming lower highs and higher lows. We may currently be in Wave D (Elliott Wave), aiming toward the triangle’s upper boundary slightly above $3,400 resistance. After that, Wave E may develop – but that’s a story for another post.
SWING IDEA - JK LAKSHMI CEMENT JK Lakshmi Cement , a key player in India’s cement sector under the JK Group showing strong technical confluence making this a swing-worthy setup.
Reasons are listed below :
Formation of a bullish engulfing candle on the weekly chart, indicating a potential trend reversal
Strong support from the 50-week EMA , reinforcing medium-term trend strength
Breakout from a consolidation range that lasted over a year, suggesting renewed momentum
Inverse Head & Shoulders breakout , a classic bullish pattern
Target - 1000
Stoploss - weekly close below 795
DISCLAIMER -
Decisions to buy, sell, hold or trade in securities, commodities and other investments involve risk and are best made based on the advice of qualified financial professionals. Any trading in securities or other investments involves a risk of substantial losses. The practice of "Day Trading" involves particularly high risks and can cause you to lose substantial sums of money. Before undertaking any trading program, you should consult a qualified financial professional. Please consider carefully whether such trading is suitable for you in light of your financial condition and ability to bear financial risks. Under no circumstances shall we be liable for any loss or damage you or anyone else incurs as a result of any trading or investment activity that you or anyone else engages in based on any information or material you receive through TradingView or our services.
@visionary.growth.insights

$BTC Bullish Engulfing Weekly CloseCRYPTOCAP:BTC closes the Week with a Big Bullish Engulfing candle back within the POI.
Should retest ATH soon.

$SOL Bullish Engulfing On WeeklyCRYPTOCAP:SOL closes the week with a Bullish Engulfing candle.
50WMA at $170 next target to smash.

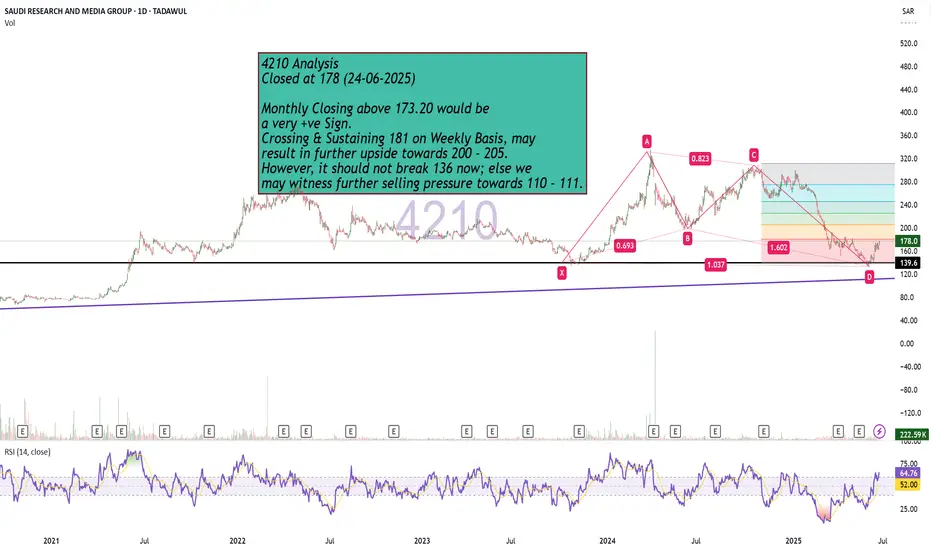
Bullish Monthly Candle Expected?4210 Analysis
Closed at 178 (24-06-2025)
Monthly Closing above 173.20 would be
a very +ve Sign.
Crossing & Sustaining 181 on Weekly Basis, may
result in further upside towards 200 - 205.
However, it should not break 136 now; else we
may witness further selling pressure towards 110 - 111.
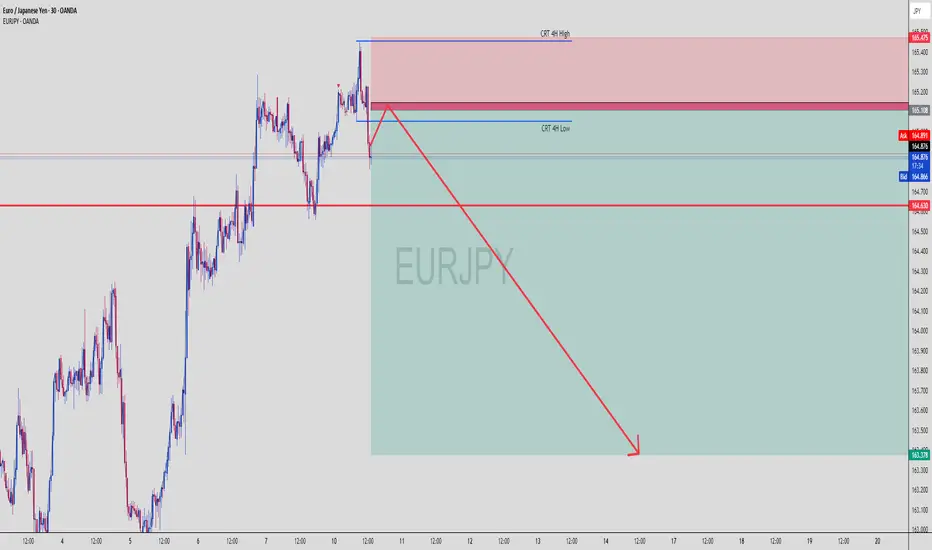
EURJPY Tapped 4H Supply – Massive Drop Loading?EURJPY | 30-Min View with 4H CRT Zones
🔥 This is where Smart Money sharpens their blades…
🧊 New Confluence Just Dropped:
🔴 CRT 4H High Zone: 165.108–165.475
Price wicked right into the 4H Compression Reversal Top (CRT) — ideal Smart Money trap zone
This area aligns perfectly with the bearish OB/supply from previous screenshot
🔵 CRT 4H Low Zone: Around 164.630
Strong structure level where liquidity is sitting
Price respected it as temporary support before likely break-and-retest continuation
🔍 Price Action Logic:
✅ Price faked out above CRT 4H High, grabbing liquidity
✅ Immediate rejection candle with wick rejection signals institutional selling
🔁 Now price is retesting the mid-OB / lower CRT, likely forming a breaker pattern
🟥 Huge clean imbalance to the downside — marked by that juicy green TP box
🔽 Expectation: price fills inefficiency and heads to 163.378 minimum
🎯 Trade Parameters:
🔻 Entry Zone 165.100 – 165.397 (Red Supply / CRT High)
🛡 SL Above 165.475 (CRT 4H High)
🎯 TP Target 163.378 (bottom imbalance fill)
⚖️ RRR Over 1:4 potential — high precision entry zone
🧠 Chart Ninja Analysis:
“When CRT zones align with OBs and liquidity sweeps,
that’s a Smart Money feast waiting to happen.” – 🥷
This chart is a classic reversal blueprint. If you missed the first tap — wait for the retest. If this holds below CRT Low (164.630), expect full bearish momentum into midweek.
📊 Confirmation Tactics:
🔄 M15 bearish engulfing / shift in structure after tap into CRT
🔻 Break of 164.630 = confirmation of bearish intent
⏳ Optional: use FVG + volume spike as further entry triggers
🚨 Save this chart — it's one of those sniper moments where everything aligns!
Types of Engulfing Candles!In trading, an Engulfing candle (or Engulfing pattern) is a two-candle reversal pattern that can indicate a potential change in market direction. It is commonly used in technical analysis in both bullish and bearish contexts.
Types of Engulfing Candles
1. Bullish Engulfing Pattern:
Occurs during a downtrend.
The first candle is bearish (red or black), showing continued selling pressure.
The second candle is bullish (green or white) and completely engulfs the body of the first candle (its open is lower and close is higher).
This pattern signals a potential reversal to the upside.
2. Bearish Engulfing Pattern:
Occurs during an uptrend.
The first candle is bullish.
The second candle is bearish and completely engulfs the first candle's body (its open is higher and close is lower).
This pattern signals a potential reversal to the downside.
Key Characteristics
The second candle’s body must fully engulf the first candle’s body (wicks/tails are not necessary to engulf).
The stronger the engulfing candle (in terms of size and volume), the more significant the signal may be.
Often more reliable when confirmed with volume or used in conjunction with other technical indicators (e.g., RSI, support/resistance levels).
Example:
Bullish Engulfing Example:
Day 1: Bearish candle opens at $100 and closes at $95.
Day 2: Bullish candle opens at $94 and closes at $101 — it completely engulfs Day 1's body.
This would suggest a potential shift from sellers to buyers.

Below the current price, several demand zones have been marked!Gold Analysis (1H Timeframe):
On the 1-hour chart, Gold has previously formed a bearish engulfing candlestick pattern, which signaled a potential reversal and has since led to a downward move in the market. At present, another bearish engulfing pattern has formed, suggesting renewed selling pressure. If the price retraces back to this level, there is a high probability that it may continue to decline from there.
Below the current price, several demand zones have been marked. These zones correspond to areas where bullish engulfing patterns have previously formed or are likely to form. These zones have been carefully filtered for quality and relevance.
The recommended approach is to patiently wait for the price to enter these demand zones. If the market provides a valid bullish confirmation signal (such as bullish candlestick formations, divergence, or volume confirmation) within these zones, it could present a high-probability buying opportunity.
> ⚠️ Disclaimer: This analysis is for educational purposes only. Always conduct your own research (DYOR) before making any trading decisions. This is not financial advice.

CADCHF - Sell Short - Trendline and Candle stick confluences. Market is making a series of LH and LLs- Market has rejected from trend line resistance. Bearish Engulfing candle formation is a strong confluence of market bearish trend.
we can instant enter in the market, SL would be slightly above Last confirmed LH and TPs would be with R:R of 1:1 and 1:2 respectively.

Bullish Engulfing Pattern: A Strong Reversal SignalBullish Engulfing Pattern: A Strong Reversal Signal
The bullish engulfing pattern is a two-candlestick formation that suggests a possible reversal from a downtrend to an uptrend in the financial market. This particular pattern holds immense value for traders and technical analysts as it equips them with the means to discern potential buying opportunities. In this article, we will explain how traders implement this pattern in their trading strategies.
What Is a Bullish Engulfing Pattern?
The bullish engulfing is a technical analysis pattern consisting of two candles. This formation emerges when a large bearish candlestick is succeeded by a larger green one that entirely engulfs it.
What does the bullish engulfing mean? The bullish engulfing indicates a potential shift in market sentiment, suggesting that buying pressure might surpass selling pressure in the near future and highlighting a possible reversal from a downtrend to an uptrend.
Traders can find the bullish engulfing candlestick pattern across various financial instruments, including currencies, stocks, cryptocurrencies*, ETFs, and indices.
Bearish Engulfing vs Bullish Engulfing
The bullish engulfing pattern has a counterparty - bearish engulfing. The bearish engulfing pattern occurs during an uptrend, indicating a change in market sentiment and potential price reversal to the downside. It consists of two candles, where the second is larger and bearish and completely engulfs the body of the preceding candlestick.
How Can You Trade the Bullish Engulfing Pattern?
Here are some steps traders consider when trading with the bullish engulfing:
- Identification: Look for a clear bullish engulfing setup on a price chart at the end of a downtrend.
- Entry Point: Although candlestick patterns don't provide precise entry and exit points as chart patterns do, there are general rules you could use.
The entry point could be set slightly above the high of the bullish engulfing formation. In the conservative approach, traders enter the market after several candles close higher. In a risky approach, traders open a buy position after the pattern is formed.
- Exit Point: A stop-loss level could be below the low of the engulfing candle or below a nearby support level. A take-profit level could be based on a trader’s risk/reward ratio or key resistance levels.
- Risk Management: You can consider a risk management strategy to potentially limit losses. Traders focus on appropriate position sizing and risk-to-reward ratios to maintain a balanced approach to trading.
- Trade Monitoring: Once you have entered the trade, monitor price action and market conditions. Pay attention to any sign of reversal confirmation or potential obstacles that may invalidate the signal.
- Stop-Loss and Take-Profit Adjustment: As the trade progresses, you may consider adjusting your stop-loss level to protect potential returns. Similarly, you may consider adjusting your take-profit level if the price signals a strong uptrend.
Live Market Example
Let's consider an example of a bullish engulfing on the forex chart. The bullish engulfing candle in the example below is marked with 1 and 2. The trader sets the entry point above the green candle and a stop-loss level below it. The take profit is at the closest resistance level.
How Do Traders Confirm a Bullish Engulfing Candlestick Pattern?
Confirming this pattern enhances the reliability of its signals and helps traders make informed decisions. Here are key steps to confirm it:
- Volume Analysis: Traders typically look for increased buying trading volume accompanying the candle. Higher volume suggests stronger buyers’ interest and validates the reversal signal.
- Follow-Up Candlesticks: Waiting for subsequent closes can confirm the upward momentum. A series of higher closes strengthens its credibility.
- Support Levels: If it forms near a significant support level, this adds context to the reversal, as buyers are stepping in at a critical price point.
- Technical Indicators: Complementary indicators like the Relative Strength Index (RSI), Stochastic Oscillator, or a pair of moving averages can confirm the shift in sentiment.
- Market Context: Traders assess the overall market trend and news to ensure the formation aligns with broader market conditions.
Bullish Engulfing and Other Patterns
Let’s take a closer look at how this pattern compares to other chart formations, like the piercing and harami.
What Is the Difference Between a Bullish Engulfing and a Piercing Pattern?
A bullish engulfing pattern occurs when a large bearish bar is followed by a larger candlestick that completely overtakes the former's body. This indicates a strong potential reversal from a downtrend to an uptrend.
In contrast, a piercing formation also signals a potential reversal but is slightly weaker. It forms when a bearish candle is followed by a bullish candle that closes above its midpoint but doesn’t envelop it entirely.
What Is the Difference Between a Bullish Engulfing Pattern and a Bullish Harami Pattern?
The bullish harami pattern consists of a large red candle followed by a smaller green candle that is completely contained within the body of the red candle. This formation suggests a potential reversal but is generally considered less strong than the bullish engulfing candle pattern, as the latter completely envelops the previous bearish bar, showing more decisive buying pressure.
Final Thoughts
While this pattern offers valuable insights into potential trend reversals, it's essential to complement it with technical indicators and robust risk management for effective use. Also, be sure to explore other patterns as they may look very similar but provide different signals.
FAQ
What Is a Bullish Engulfing Pattern?
A bullish engulfing pattern is a two-candlestick formation in technical analysis that suggests a potential reversal from a downtrend to an uptrend. It occurs when a large bearish candlestick is followed by a larger bullish candlestick that completely engulfs the body of the preceding bearish candle.
How Reliable Is the Bullish Engulfing Pattern?
The reliability of the bullish engulfing pattern as a reversal signal depends on various factors, including the overall market context, confirmation from other technical indicators, and the timeframe being analysed. While it can be a strong indication of a potential trend reversal, it is not foolproof and should be used in conjunction with other tools and fundamental analysis.
What Is a Bullish Engulfing Candle Trading Strategy?
The bullish engulfing candle strategy involves identifying this pattern at the end of a downtrend as a signal for a potential sentiment shift. Traders typically enter a buy position slightly above the high of the closing bar, with stop-loss levels set below the low or beneath nearby support levels. Take-profit levels are determined based on risk/reward ratios or key resistance levels.
Do Wicks Matter in Engulfing Candlesticks?
Yes, wicks matter in the formation. The wicks provide insights into price rejection and volatility. For a strong confirmation, the absence of long upper wicks suggests sustained buying pressure, reinforcing its validity as a reversal signal.
*Important: At FXOpen UK, Cryptocurrency trading via CFDs is only available to our Professional clients. They are not available for trading by Retail clients. To find out more information about how this may affect you, please get in touch with our team.
This article represents the opinion of the Companies operating under the FXOpen brand only. It is not to be construed as an offer, solicitation, or recommendation with respect to products and services provided by the Companies operating under the FXOpen brand, nor is it to be considered financial advice.

Bearish sign but we think it pushes to MAJOR RESISTANCEYesterday CRYPTOCAP:BTC formed a BEARISH ENGULFING. We've spoken on this pattern countless times.
However, we didn't bring it up because we didn't/don't think it's relevant.
WHY? Look at the paltry volume. Bitcoin volume is SUPER LOW.
BTC is still in Bullish mode from Late 2022.
---
We turned Bullish again on CRYPTOCAP:BTC around early April:
A) We saw that huge Bitcoin selloff 4/7
2) Which reversed that same day
3) Followed by some buying a couple days later
4) More BTC accumulation 4/21 when it was under 88k
Major resistance coming up soon.
Pause HIGHLY LIKELY.

Bitcoin Forecast: May 2025 OutlookMay 2025 has marked a strong upward trend for Bitcoin, with the leading cryptocurrency steadily trading in the $100,000–$105,000 range and hitting multi-month highs. This growth has been largely fueled by active accumulation from institutional investors, including exchange-traded funds (ETFs), reinforcing Bitcoin’s growing integration into the traditional financial system.
Institutional Demand as a Key Driver
A major factor behind Bitcoin’s recent surge is the increasing flow of capital from institutional investors. Large ETFs, such as those managed by BlackRock and Fidelity, have expanded their positions in BTC, sending a strong signal of confidence from established financial institutions. This has further boosted interest from retail investors and strengthened the overall bullish momentum.
Macroeconomic Context
Another significant influence is the market's anticipation of a potential interest rate cut by the U.S. Federal Reserve. A more dovish monetary policy stance would make riskier assets, including cryptocurrencies, more attractive, encouraging further investment in Bitcoin.
While the Fed is expected to make a rate decision in June, markets tend to price in such moves early, which is already being reflected in Bitcoin’s price trajectory.
Forecast: How Much Could Bitcoin Be Worth by End of May?
Given the current momentum and positive market sentiment, analysts suggest that Bitcoin could continue its ascent. Optimistic forecasts predict that BTC might reach $120,000–$130,000 by the end of the month, provided macroeconomic conditions remain favorable. Still, the inherent volatility of the crypto market means potential pullbacks should not be ruled out.
Conclusion
May 2025 could prove to be a pivotal month for Bitcoin. Increased institutional participation, supportive macroeconomic signals, and favorable technical indicators are all contributing to its ongoing rally. If the current trend continues, Bitcoin could set new all-time highs in the coming weeks.

If the price enter these red-marked zones!Gold Market Analysis (Engulfing & Zone-Based Strategy)
This analysis is based on a straightforward zone-trading method using engulfing patterns and filtered key levels. The marked zones on the chart highlight high-probability trading areas.
Red Zones (Sell Areas):
If the price enters these red-marked zones, we look for bearish confirmation to enter sell trades.
These zones are derived from the 4H timeframe, making them more reliable. If the market reacts from here, you can target around 60–80 pips in profit.
A second sell zone offers potential for a larger move—up to 150+ pips—if the price respects it.
Green Zones (Buy Areas):
If the price drops and enters the green-marked zone, it’s a signal to look for buy setups.
This area may deliver a strong bounce, potentially yielding 100+ pips.
There’s no need for complicated patterns or indicators—just follow the zones. If the price hits a zone and shows confirmation, you trade it.
Trade at your own risk DYOR!!

Mastering Candlestick Patterns - How to use them in trading!Introduction
Candlesticks are one of the most popular and widely used tools in technical analysis. They offer a visual representation of price movements within a specific time period, providing valuable insights into market trends, sentiment, and potential future price movements.
Understanding candlestick patterns is crucial for traders, as these formations can indicate whether a market is bullish or bearish, and can even signal potential reversals or continuations in price. While candlesticks can be powerful on their own, trading purely based on candlestick patterns can be challenging and risky.
-----------------------------------------------------------------------------------------------
What are we going to discuss:
1. What are candlesticks?
2. What are bullish candlestick patterns?
3. What are bearish candlestick patterns?
4. How to use candlestick patterns in trading?
-----------------------------------------------------------------------------------------------
1. What are candlesticks?
A candlestick in trading is a visual representation of price movement in a specific time period on a chart. It is a fundamental element used in technical analysis to study market trends, determine price levels, and predict potential future price movements. A single candlestick consists of four main components: the open, close, high, and low prices for that time period.
Here’s how a candlestick works:
- The Body: The rectangular area between the open and close prices. If the close is higher than the open, the body is green, indicating a bullish (upward) movement. If the close is lower than the open, the body is red, signaling a bearish (downward) movement.
- The Wick (high and low of the candle): The thin lines extending above and below the body. These represent the highest and lowest prices reached during the period. The upper wick shows the highest price, while the lower wick shows the lowest price.
- The Open Price: The price at which the asset began trading in that time period (for example, the start of a day, hour, or minute depending on the chart timeframe).
- The Close Price: The price at which the asset finished trading at the end of the period.
-----------------------------------------------------------------------------------------------
2. What are bullish candlestick patterns?
What is a Hammer Candlestick Pattern?
A hammer candlestick pattern has a small body near the top of the candle and a long lower wick, typically two to three times the length of the body. There is little to no upper wick. This formation shows that during the trading session, sellers managed to push the price significantly lower, continuing the downward momentum. However, buyers eventually stepped in with strong demand and drove the price back up near the opening level by the close.
What is an Inverted Hammer?
An inverted hammer has a small body near the bottom of the candle with a long upper wick, usually at least two to three times the size of the body, and little to no lower wick. This unique shape resembles an upside-down hammer, hence the name.
What is a Dragonfly Doji?
A dragonfly doji has a unique shape where the open, close, and high prices are all at or very close to the same level, forming a flat top with a long lower wick and little to no upper wick. This gives the candle the appearance of a "T," resembling a dragonfly.
What is a Bullish Engulfing?
A bullish engulfing candlestick consists of two candles. The first candle is bearish, indicating that sellers are still in control. The second candle is a large bullish candle that completely engulfs the body of the first one, meaning it opens below the previous close and closes above the previous open. This pattern reflects a clear shift in market sentiment. During the second candle, buyers step in with significant strength, overpowering the previous selling pressure and reversing the momentum. The fact that the bullish candle completely engulfs the previous bearish candle indicates that demand has taken over, signaling a potential trend reversal.
What is a Morning Star?
The morning star consists of three candles. The first is a long bearish candle, indicating that the downtrend is in full force, with strong selling pressure. The second candle is a small-bodied candle, which can be either bullish or bearish, representing indecision or a pause in the downtrend. Often, the second candle gaps down from the first, indicating that the selling pressure is subsiding but not yet fully reversed. The third candle is a long bullish candle that closes well above the midpoint of the first candle, confirming that buyers have taken control and signaling the potential start of an uptrend.
-----------------------------------------------------------------------------------------------
3. What are bearish candlestick patterns?
What is a Shooting Star?
A shooting star has a smal body near the low of the candle and a long upper wick, usually at least twice the size of the body, with little to no lower wick. This shape shows that buyers initially pushed the price higher during the session, continuing the upward momentum. However, by the close, sellers stepped in and drove the price back down near the opening level.
What is a Hanging Man?
A hanging man has a distinct shape, with a small body positioned near the top of the candle and a long lower wick, usually at least twice the length of the body. There is little to no upper wick. The appearance of this candle suggests that although there was strong selling pressure during the session, buyers managed to bring the price back up near the opening level by the close. Despite the recovery, the long lower wick shows that sellers were able to push the price down significantly at one point. This introduces uncertainty into the uptrend and can indicate that bullish momentum is weakening.
What is a Gravestone Doji?
A gravestone doji has a distinctive shape where the open, low, and close prices are all at or near the same level, forming a flat base. The upper wick is long and stretches upward. This shape resembles a gravestone, which is where the pattern gets its name.
What is a Bearish Engulfing?
A bearish engulfing candlestick pattern is a two-candle reversal pattern that typically appears at the end of an uptrend and signals a potential shift from bullish to bearish sentiment. The first candle is a smaller bullish candle, reflecting continued upward momentum. The second candle is a larger bearish candle that completely engulfs the body of the first one, meaning it opens higher than the previous close and closes lower than the previous open. This indicates that bears have taken control, overpowering the buyers, and suggests a potential downside movement.
What is an Evening Star?
An evening star is a bearish candlestick pattern that typically signals a potential reversal at the top of an uptrend. It consists of three candles and reflects a shift in momentum from buyers to sellers. The pattern starts with a strong bullish candle, showing continued buying pressure and confidence in the upward move. This is followed by a smaller-bodied candle, which can be bullish or bearish, and represents indecision or a slowdown in the uptrend. The middle candle often gaps up from the first candle, showing that buyers are still trying to push higher, but the momentum is starting to weaken. The third candle is a strong bearish candle that closes well into the body of the first bullish candle. This candle confirms that sellers have taken control and that a trend reversal could be underway. The more this third candle erases the gains of the first, the stronger the reversal signal becomes.
-----------------------------------------------------------------------------------------------
4. How to use candlestick patterns in trading?
Candlestick patterns are most useful when they appear at key levels, such as support, resistance, or significant trendlines. For instance, if a bullish reversal pattern like a hammer or bullish engulfing forms at a support level, it may indicate that the downtrend is losing momentum, and a reversal could be coming.
Trading based on candlestick patterns alone can be risky. To improve your chances of success, always seek additional confirmation from other technical analysis tools. Here are some common ones:
- Support and Resistance Levels: Look for candlestick patterns that form near key support or resistance levels. For instance, if the price reaches a support zone and a bullish reversal candlestick pattern forms, this may suggest a potential upward reversal.
- Fibonacci Retracement: Use Fibonacci levels to identify potential reversal zones. If a candlestick pattern appears near a key Fibonacci level (such as the Golden Pocket), it adds confirmation to the idea that the price may reverse.
- Liquidity Zones: These are areas where there is a high concentration of buy or sell orders. Candlestick patterns forming in high liquidity zones can indicate a stronger potential for a reversal or continuation.
- Indicators and Oscillators: Incorporating indicators like the Relative Strength Index (RSI), Moving Averages, MACD, or Stochastic RSI can help confirm the momentum of the price. For example, if a candlestick pattern forms and the RSI shows an oversold condition (below 30), this could indicate a potential reversal to the upside.
It’s crucial to wait for confirmation before entering a trade. After a candlestick pattern forms, it’s important to wait for the next candle or price action to confirm the signal. For example, if you spot a bullish reversal candlestick like a hammer at support, wait for the next candle to close above the hammer’s high to confirm that buyers are in control and a reversal is likely.
-----------------------------------------------------------------------------------------------
Thanks for your support.
- Make sure to follow me so you don't miss out on the next analysis!
- Drop a like and leave a comment!

$SOL Bullish Engulfing Candle on Weekly CloseBig Bullish Engulfing candle for Solana on the weekly close.
Needs to breakthrough EMA9 and claim as support.
If not, we could see an inverse head and shoulders reversal pattern formed ~$112 before the next leg up.

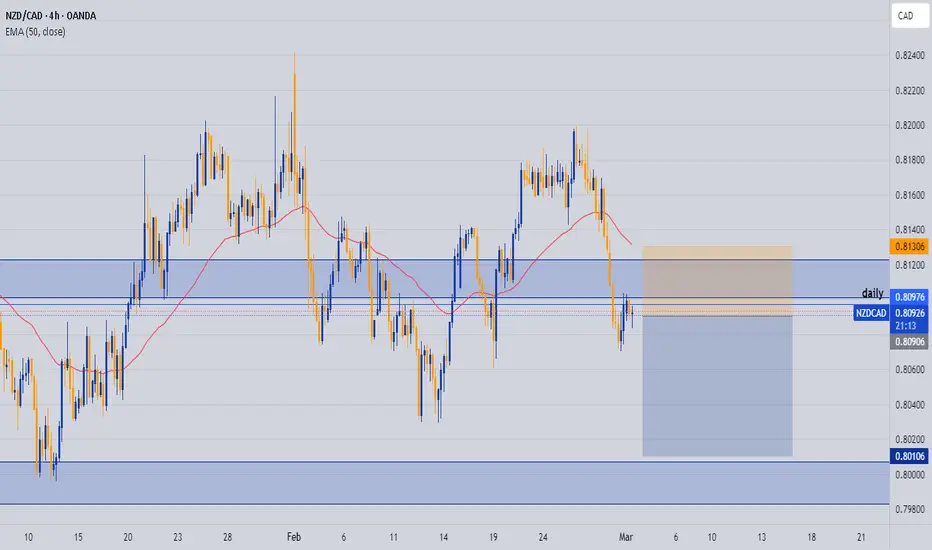
NZDCAD sell setupOANDA:NZDCAD Overall bias on NZDCAD is bearish, entry is based on the 4H bearish engulfing at the Daily AOI around 0.80976
Mastering Candlestick Patterns: Visual Guide for Traders
🔵 Introduction
Candlestick charts are among the most popular tools used by traders to analyze price movements. Each candlestick represents price action over a specific time period and provides valuable insights into market sentiment. By recognizing and understanding candlestick patterns, traders can anticipate potential price reversals or continuations, improving their trading decisions. This article explains the most common candlestick patterns with visual examples and practical Pine Script code for detection.
🔵 Anatomy of a Candlestick
Before diving into patterns, it's essential to understand the components of a candlestick:
Body: The area between the open and close prices.
Upper Wick (Shadow): The line above the body showing the highest price.
Lower Wick (Shadow): The line below the body showing the lowest price.
Color: Indicates whether the price closed higher (bullish) or lower (bearish) than it opened.
An illustrative image showing the anatomy of a candlestick.
🔵 Types of Candlestick Patterns
1. Reversal Patterns
Hammer and Hanging Man: These single-candle patterns signal potential reversals. A Hammer appears at the bottom of a downtrend, while a Hanging Man appears at the top of an uptrend.
Engulfing Patterns:
- Bullish Engulfing: A small bearish candle followed by a larger bullish candle engulfing the previous one.
- Bearish Engulfing: A small bullish candle followed by a larger bearish candle engulfing it.
Morning Star and Evening Star: These are three-candle reversal patterns that signal a shift in market direction.
Morning Star: Occurs at the bottom of a downtrend, indicating a potential bullish reversal. It consists of:
- A long bearish (red) candlestick showing strong selling pressure.
- A small-bodied candlestick (bullish or bearish) indicating indecision or a pause in selling. This candle often gaps down from the previous close.
- A long bullish (green) candlestick that closes well into the body of the first candle, confirming the reversal.
Evening Star: Appears at the top of an uptrend, signaling a potential bearish reversal. It consists of:
- A long bullish (green) candlestick showing strong buying pressure.
- A small-bodied candlestick (bullish or bearish) indicating indecision, often gapping up from the previous candle.
- A long bearish (red) candlestick that closes well into the body of the first candle, confirming the reversal.
2. Continuation Patterns
Doji Patterns: Candles with very small bodies, indicating market indecision. Variations include Long-Legged Doji, Dragonfly Doji, and Gravestone Doji.
Rising and Falling Three Methods: These are five-candle continuation patterns indicating the resumption of the prevailing trend after a brief consolidation.
Rising Three Methods: Occurs during an uptrend, signaling a continuation of bullish momentum. It consists of:
- A long bullish (green) candlestick showing strong buying pressure.
- Three (or more) small-bodied bearish (red) candlesticks that stay within the range of the first bullish candle, indicating a temporary pullback without breaking the overall uptrend.
- A final long bullish (green) candlestick that closes above the high of the first candle, confirming the continuation of the uptrend.
Falling Three Methods: Appears during a downtrend, indicating a continuation of bearish momentum. It consists of:
- A long bearish (red) candlestick showing strong selling pressure.
- Three (or more) small-bodied bullish (green) candlesticks contained within the range of the first bearish candle, reflecting a weak upward retracement.
- A final long bearish (red) candlestick that closes below the low of the first candle, confirming the continuation of the downtrend.
🔵 Coding Candlestick Pattern Detection in Pine Script
Detecting patterns programmatically can improve trading strategies. Below are Pine Script examples for detecting common patterns.
Hammer Detection Code
//@version=6
indicator("Hammer Pattern Detector", overlay=true)
body = abs(close - open)
upper_wick = high - math.max(close, open)
lower_wick = math.min(close, open) - low
is_hammer = lower_wick > 2 * body and upper_wick < body
plotshape(is_hammer, title="Hammer", style=shape.triangleup, location=location.belowbar, color=color.green, size=size.small)
Bullish Engulfing Detection Code
//@version=6
indicator("Bullish Engulfing Detector", overlay=true)
bullish_engulfing = close < open and close > open and close > open and open < close
plotshape(bullish_engulfing, title="Bullish Engulfing", style=shape.arrowup, location=location.belowbar, color=color.blue, size=size.small)
🔵 Practical Applications
Trend Reversal Identification: Use reversal patterns to anticipate changes in market direction.
Confirmation Signals: Combine candlestick patterns with indicators like RSI or Moving Averages for stronger signals.
Risk Management: Employ patterns to set stop-loss and take-profit levels.
🔵 Conclusion
Candlestick patterns are powerful tools that provide insights into market sentiment and potential price movements. By combining visual recognition with automated detection using Pine Script, traders can enhance their decision-making process. Practice spotting these patterns in real-time charts and backtest their effectiveness to build confidence in your trading strategy.

Short Re-entry Netflix (NFLX)Re-entry after previus stop
1)seasonality and presidential cycles (post election cycle )
2)overvalued conditions
4)bearish engulfing candle
