NZDUSD Bearish Engulfing 4HUsually take entries from 1 H chart although this setup was clearer to me on the 4H with the engulfing pattern at key resistance. Used a 50% limit order entry to get a better chance at 2:1 and above risk reward. FX:NZDUSD
Engulfing Candle

EURO/GBP: 3 Line Strike on the WeeklyWe have a confirmed Bullish 3 Line Strike on the Weekly as seen below as well as an Unconfirmed Bearish Engulfing on the Monthly i believe the Confirmed Weekly Bearish Pattern has given us a Potential Entry to try to catch the Monthly BAMM Move a bit early and if it plays out we will see the bottom of the overall range again which is near the .886 retrace.

#bitcoin $BTC printind the end of this bear market?BTC has been trending downwards for more than 200 days, and is currently printing a bullish engulfing candle on the weekly timeframe!
if we close this candle above the previous candle's open price, which is about $21038 , we can expect an uptrend to start, which is what happened last time we had a bullish engulfing candle at the end of a downtrend: last year, in July
let's hope we close above 21k tonight!!
could this be the end of the bear market?
I think it might be, but we of course need some more confirmation to be sure it really is
let me know what you think about this idea! personally opened a BTC long :)

Buy the support - Range Strategy (+ 3000 points)Hey everyone,
I'm very happy to share with you my first chart posted on TradingView. This is a bullish setup on USOIL based on several elements that i've found through technical analysis. Usually the winning rate of this type of trade is around 70%, so if having a correct management of risk its a very profitable idea.
Buy Setup USOIL :
- price ranging between 90 and 120
bounce on important support
- Ema bounce
- bullish engulfing
aiming for 124 lvl

DLF is ready for uptrend hey guys ,
DLF stock is ready for uptrend
as you can see that , this stock was moving in pattern called DESCENDING TRIANGLE
and now you can see that ,
this stock is at its LOWEST SUPPORT POINT ,
and this stock is also at the ,
VERY STRONG SUPPORT LINE.
One more point to buy this stock is that,
this stock is a BULLISH ENGULFING CANDLE ,
these 3 reasons are giving us confidence to buy this stock and earn HIGH RETURNS
BUT FIRST CONSIDER THE GLOBAL SITUATION,
I.E INFLATION
WAR BETWEEN UKRAINE AND RUSSIA ,
RISING BANK RATES ,
AND RISING EXPORT DUTIES ON OIL AND GAS
after considering these situations you can BUY this stock
AND pls guys , if u liked my analysis
comment, like and follow my account
😀😀

DE30 Trading idea with engulfingGuys I found this 1 min ago. the engulfing shows us the best way to earn. so just keep buying till monday!

Week 3 assignment (EXHIBIT B) for AAL by PROSHERIFFA Bullish Engulfing Pattern has been spotted on a 15-minute chart. The overall trend is looking bullish after a reversal took place.

Week 3 assignment (EXHIBIT A) for XOM by PROSHERIFFA Variation of Bullish Engulfing Pattern has been spotted on 1 hour chart. Take profit level is previous Lower High.

EURJPYPlease leave your comment for improve my analysis.
ATTENTION THIS ANALYSIS FOR MY EDUCATION ONLY NO SIGNAL PROVIDE.
This is My analisis for pair EURJPY
FX:EURJPY

XCHUSDT - 10x opportunityOn the weekly chart above:
1) RSI has been heavily oversold for quite some time.
2) Bullish divergence as drawn, RSI forming descending wedge.
3) Price has declined over 90% from ATH.
Also the 3D BTC pair below breaks out of resistance quite decisively and prints a bullish engulfing candle (Also BE candle printed on 1W BTC pair. Wow!)
Initial targets 41-54 USDT (1.5-1.95x) as marked by fib retracement
Timeframe: Weeks
Leverage: 3x at most for me (although with these signals printing the probability of more downside is very slim)
Hasta luego

Bitcoin has posted a Bullish engulfing.Hello, this is just a short analysis.
Bitcoin has started positive on the day and posted a Bullish engulfing yesterday, heading towards a positive week. I expect a correction to the upside to happen.
Target is at 20 EMA, currently at $24800.
Bitcoin has also found Fibonacci support at 0.786, 78,6% retracement at $17600 from $69000 to $3850.

GBPJPY longOANDA:GBPJPY
GBPJPY broke bearish structure on the 1H and price tested on a key support level with bullish engulfing candles

EURJPYPlease leave your comment for improve my analysis.
ATTENTION THIS ANALYSIS FOR MY EDUCATION ONLY NO SIGNAL PROVIDE.
This is My analisis for pair EURJPY
FX:EURJPY


AUDCAD Short Term Buy IdeaD1 - Price is bouncing higher from a key support zone.
Bullish divergence.
Engulfing candle pattern.
H1 - Bullish convergence.
No opposite signs.
Until the key support zone holds I expect short term bullish moves to happen here.

AUDUSD SHORTOANDA:AUDUSD
AUDUSD broke out of the key level of support,made a retest at 38.2%, made a bearish engulfing candle These confluences give a good bearish setup

QCOM-Has Two Bullish Patterns!Patterns Identified -Falling Wedge & Bullish Engulfing patterns weekly chart!
QCOM filled a gap from November 4, 2021. I can clearly see that QCOM is going through price correction (ranging). If you take a closer look it has popped out of the upper trend line slightly. Take a look at the yellow box to verify. I've identified a bullish engulfing that leads me to believe that the stock has potential to break the channel and move to the upside. However, if it breaks the bottom of our channel, then we should expect to see price go down. However, a falling wedge pattern was identified with confluences (rising volume and momentum).
Therefore, I am bullish on QCOM.
My entry will be based on these findings to include the patterns identified. A break of the recent candle and channel will be my signal to enter a swing position.
*This is not financial advice.
Freedom & peace is prosperity,
MrALtrades00
Gap up from November 4,2021
Falling Wedge
Bullish Engulfing inside Falling Wedge pattern!

CADJPY (-1.24%)Expect price to decrease for CADJPY currency. Price closed below the trend line and retested trend line with a bearish engulfing candlestick.

SHORT ON AUD/JPYOverall downtrend
Massive bearish candle coming from major resistance zone with room to fall.

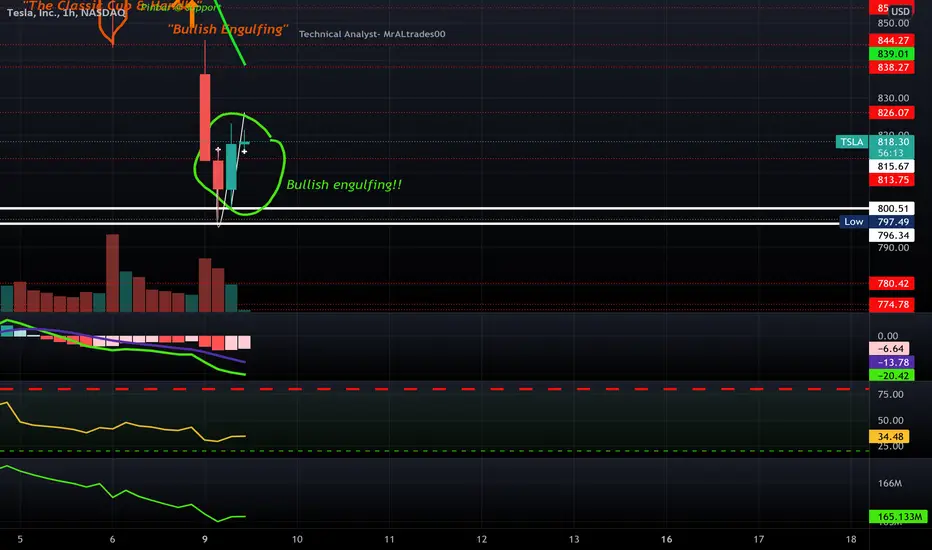
TSLA-Bullish Engulfing & Classic Cup & Handle PatternTesla (TSLA) has a bullish engulfing on the 1 HR chart and a "Classic Cup & Handle" pattern on the 5 minute chart!
Peace & Prosperity,
MrALtrades00
D1 BEARISH ENGULFINGNot actually looking to trade this but just an idea/call out so to speak this is where I would look to go short here and would place a sell limit, also taking into consideration the fundamentals at play with BOE and Yen too. But we'll see. again this isn't a trade i am taking just calling out something i am seeing and working on maybe taking these set ups one day but i need more reps in tbh

GBPCAD under selling pressure!Hello guys,
Based on the chart, the main trend is bearish and there is a strong bearish candle which shows the strong rejection of price from a resistance area.
So based on this scenario, opening sell positions at this area would be a good choice.
Note: This post will be update base on market reaction.
✅✅ If you found our analysis useful, please Like and Subscribe us to receive more signals in future. ✅✅
Good luck!

🟡 AUDUSD 4hr AU trading above fresh demand area, bullish engulf and divergence give solid evidence of buyers started to coming in.
💡what is your thought of this setup? write in the comment and lets discuss.
