XAUUSD Sell at 1988My previous trade hit SL. And now I go short at 1988, TP at 1968.
Not all trades will go well. We need to keep going!
Arigato!
Engulfing Candle

GBPJPY Downtrend H4I noticed something during the Valentines day at 14 Feb. Price already show Double Top Pattern & Engulf Sell .
So I sell at 157.25 and add a layer entry sell at 156.95 . TP 1 at 155.40, TP 2 at 153.55.
Follow the trend, I sell at 155.00 and reentry at 155.00 after the corrections. TP 1 at 153.40,TP 2 at 151.50.
Now i entry Sell at 152.900 . TP 1 at 151.500 , TP 2 at 150.500.
I also try to Swing sell position at Monthly Timeframe, I will share it later after this idea published.
Have a great day!

SCALPING SELL AT 2005 & LONG AT 1983I sell at 2005, TP at 1985, 200 pips.
Then I buy at 1983 TP 1 at 2016, 330 pips. TP 2 at 2036, 350 pips.
We'll see how the price action goes. If my buy position don't hit TP 2, I will go sell at 2016.

AUDUSD LONGOANDA:AUDUSD
AUDUSD just broke the bearish structure on the Daily chart.
It had formed a double bottom pattern and broke the neckline of the double bottom
and also closing above the previous Lower High breaking structure. Price further made
a 50.0% retest and candle closed as a bullish engulfing, confirming
a buy setup on AUDUSD.

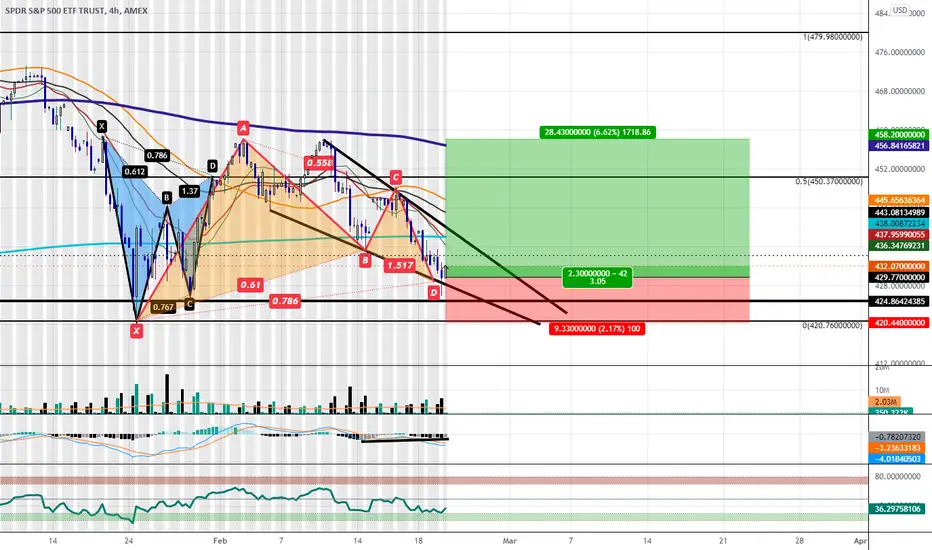
The $SPY is Potentially Setting up for Another Short-term BounceToday on the 4HR Timeframe we went down Below the Demand Line of a Falling Wedge Channel but ultimately closed back within the Channel then Bullishly Engulfed at the PCZ of a Bullish Gartley on the close of the next candle. We also showed slight hints of Bullish Divergence on the MACD whilst this was going on. This looks to be pretty good for any Market Bulls out there in the short to midterm but i we aren't completely out of the woods yet as the Macro is still Bearish. I will be looking for a Midterm bounce in the SPY but wont be targeting much higher than $450 before looking to see more continuation to the downside.
GBPUSD LONG ON WEEKLY 2/22/22If price holds orange support zone we have a chance at testing yellow resistance zone.
If Yellow support zone holds we may be able to touch the bottom of light green resistance zone.
Forming an inverse head and shoulders and a bull flag to confirm bullish bias.
Needs a bullish engulfing candle breaking out through the top of the pink channel or near the bottom of the pink channel for a higher risk to reward ratio.
Take profit at top of yellow(0.5 on fib) for low risk , and at the resistance of the light green(.618) for high risk
MacD on the weekly has a bullish cross over

Short idea $Oil $WTIMy reasons:
Classic Reversal Pattern, Head and Shoulder at H4.
Huge Bearish Engulfing on H4.
Confirm better by break below neckline, climb and reject below neckline.
Average Entry Price: > 90
SL: 92.00
TP1 : as in the pic (Measure the distance from Head to Neckline)
TP2 : ''
TP3 : ''

GPUSD ShortOANDA:GBPUSD
GBPUSD formed a double top, and broke structure(NECKLINE/SUPPORT)
and retraced at 78.6% and has created confluence with a resistance line
and a bearish engulfing candle formed creating a high probability confirmation
for a sell on GBPUSD.

ATOM SCALPING Atom seems to hit a strong support, while it has broken the Bearish trend line, I think the candlestick pattern( something like an imperfect bearish engulfing) form at the level of a dynamic resistance would lead the price to the support 25.67 to 25.38 USDT for the last time and after formation of a key level we could see growth to 27.49 to 27.67 resistance. also Follow line Indicator along with Hull moving average Band show some signs and signals of change in Trend, so after formation of fist candlestick pattern reversal patterns getting LONG position would be a good choice

GOOG: Time to buy the DIP? Complete analysis (H,D and W charts).Hello traders and investors! Let’s see how GOOG is doing today!
First, we see a good reaction today, in the 1h chart, as the support area between the two black lines at $ 2,667 - $ 2,651 is holding the price nicely.
Right now is a good time for a bullish reaction, and GOOG could fill the last gap at $ 2,747.65. However, in order to reverse, we must see a stronger bullish structure, because the trend is still bearish. We see nothing but lower highs/lows, and the 21 ema is descending as well.
This could be a sign of exhaustion, but it is too soon to tell. Let’s look for more clue in the daily chart:
What I find curious is that GOOG is dropping with low volume. Its volume has been below the average since Feb 8, indicating that it is not dropping because of sell pressure. Instead, it just looks weak, and the price will get more and more discounted, until GOOG becomes attractive again to investors.
The weekly chart offers more ideas:
In the weekly chart, GOOG did a Bearish Engulfing last week, just under its 21 ema – not a good sign. It seems it could drop more, maybe to the previous support level at $ 2,492.84, but this is where things get dangerous.
If GOOG loses this support, it might trigger this Head & Shoulders chart pattern, and this will officially trigger a bear market on GOOG. Of course, this scenario wasn’t triggered yet, but it is important to pay attention to the signs it is giving to us right now.
I’ll keep you guys updated on this, so, remember to follow me to not miss any of my future analyses.

Engulfing Candlestick PatternEngulfing candlestick is formed when it completely engulfs the previous more than one candle but be considered an engulfing candlestick pattern because in Engulfing at least one candle must fully engulf.
Types of Engulfing Candlestick Pattern
Bullish Engulfing Pattern
Bearish Engulfing Pattern
#1 Bullish Engulfing Pattern
Bullish Engulfing pattern consists of two candle formations, the first candle is the small body and the second candle is the bigger. The second big candle should be fully engulfed than the previous small candle. This is called the bullish engulfing pattern.
#2 Bearish Engulfing Pattern
Bearish Engulfing pattern consists of two candle formations, the first candle is a small Bullish candle and the second is the bigger bearish Candle than the previous bullish candle. The Second big bearish candle should fully engulf the previous one or more small candles. This is called a bearish engulfing pattern.

GBPUSD Sell analysis. 100% going to work outwe got huge divergence, fundamentals also match, COT reports. we got a valid OB. QM Pattern. downtrend. trendline. everything in general is all their, im watching liquidity to be engineered and then im going to go in. trade safe and enjoy this analysis im 100% sure it will work out

GBPUSD LongOANDA:GBPUSD
Price broke structure with a bullish engulfing in the 4H
Retraced at 61.8% making a new Higher Low
The 8MA crossed over the 21 EMA indicating that the are more buyers than sellers

IBKR share reversal pattren spotted.Hello dear fellow traders !
Today i spotted a reversal bearish engulfing pattren in interactive broker stock, as we can see in chart that after a minor uptrend prices has reversed and form a candle which looks like sellers are totally in control and share can continue towards down trend and we can get 3% to 4% in profit's.
Thank you.....

SLP-USDT UpdateIt seems like SLPUSDT had a false breakout and the resistance line is still intact. It is probably in a correction phase after a great run up.
There is a battle going on in the circled area.
A bearish engulfing pattern is present on the daily so can expect more downside action possibly to the 50DMA unless trendline is successfully broken with the retest of the line.
* Not financial advice. Please do your own DD.

GBPUSDOANDA:GBPUSD
GBPUSD was in a consolidation on the 15 min chart and price broke structure and retested creating support and retraced of the 38.2% fib PRZ level. A bullish engulfing candle on the 1H added an extra confirmation for a but setup

Bitcoin Bullish Engulfing + RecoveryAfter a clear bullish engulfing forming in the January weekend of 22nd, 23rd with continuation there after, there are several factors to be considered:
1. Possible solid bottom has been formed at ~35,000
2. Bitcoin has broken the major resistance at ~41,500 with a lot more ease than expected, dictating a more easy uptrend towards ~44,000
After breaking the ~41,500 resistance, Bitcoin now has to form a new support which is not yet forming nor beginning. This is to be expected in the upcoming weeks.
The highlight, Bitcoin has just broken the down trend which started back in November 2021. If it continues on this path, we could see an easy continuation to ~50,000 as bullish sentiment is rebuilding.
The key conclusion to be taken is that Bitcoin has not yet formed a new support line as its base for this uptrend.

GBPUSD BullishOANDA:GBPUSD
GBPUSD broke the resistance level with a bullish engulfing on the 1H, then retested with another bullish engulfing candle on the 15min


$SPY Bearish Engulfing on the monthly $SPY Bearish Engulfing on the monthly
There you have it. January closed with one of the most reliable indicator of trend reversal - the bearish engulfing candle - on the monthly chart.
——————
I am not your financial advisor, but I will happily answer questions and analyze to the best of my ability but ultimately the risk is on you. Check out my ideas, but also do your own due diligence.
I have a huge tolerance for volatility so please know that. If you’re new to my trade setups please try them on a small scale first. Then go in with a risk you’re comfortable with.
I am not a bull. I am not a bear. I just see what I see in the charts and I don’t pay too much attention to the noise in the news.
If you want me to analyze any stock or ETF just leave me a comment and I’ll do it if I can. (If I have time)
And most importantly… Have fun, y’all!!
(\_/)
( •_•)
/ >🚀

Tech Sector Setting Up for Big Monthly Bearish PullbackWe have a Bearish Engulfing on the Monthly along side with extreme amounts of RSI Bearish Divergence and soon the MACD will be crossing bearishly for the first time since 2018. In the past the monthly bearish crossing has lead to at least a 30% correction back down to the 55 Month SMA.
One last thing to note is that if this Monthly Candle continues down a little further and closes below the open of October 2021, this pattern will be upgraded from just a simple Bearish Engulfing to being a Bullish Three Line Strike visible on the Monthly Timeframe which is a very bearish pattern as One Month would have Erased the gains of the Prior 3 Months and at that point you almost have a Guarantee that the Tech Sector will see a much more Sustained Correction the Downside.

Analysis GBPUSD (Overall down Side)Hello Traders, GU looks like a very much a down trend for the past week. Therefor, trading it to the down side would be your best bet in your favor. As you can see the the candles are retracing to mitigate anything to bring back in profit to continue to a sell/short. Possibly would hit to the 38% to the 50% retracement to reach to the target area. According to the RSI, there is a divergence which it let me know that it is retracing. It also shows the engulfing candle to the retracement area around the Quarter point and making LH and LL's.
Beware: news is coming out for all the USD pairs. It is a red flag. starts 1/26/2022 2:00pm EST time.
Thank you for reading!

EUR/USD - 25/01/2022 *FOLLOW UP*And were in!
Not the entry I was waiting for but we always have to adapt to the markets. Entered this after price rejected the interim level retest and engulfed the previous candle.
Let's see how this gets on.
What positions are you guys looking at, let me know.
