3 Potential Indicators of HUGE Gainz!!1. High Demand Area - Every time price has been in this purple box area it has made BIG to moderate upward moves.
2. The biggest Parabolic upside move for CROUSD was after the bullish engulfing candle as marked. Now we could close today at another bullish engulfing candle again.. which means that we might expect similar up action to follow like last time (to a price of around USD 1.00 or above). I say that because the last time we saw a bullish engulfing candle in this high demand area in this same order - we experienced this massive parabolic up-move on 4 consecutive days - reaching a price level of 96 cents.
3. This play perfectly lines up with the stochastic RSI momentum as demonstrated, if the crossing of the blue line over the red line and then working upwards back into the zone away from "oversold" area and keeps moving up - buyers at current price may see really good profits perhaps a 2x of investment if reaching over a dollar after this potential bull run that I am expecting.
Engulfing Candle

AUD/USD - LongThe Aussie Dollar has been on a significant bear run and is starting to show signs of exhaustion.
Structurally speaking, the daily time frame raising channel is holding, with the lower/support trend-line being tested and forming a higher low.
The four-hour time frame just printed a bullish engulfing candle stick pattern at the test of the trend-line which I used as added confluence for a higher low swing.

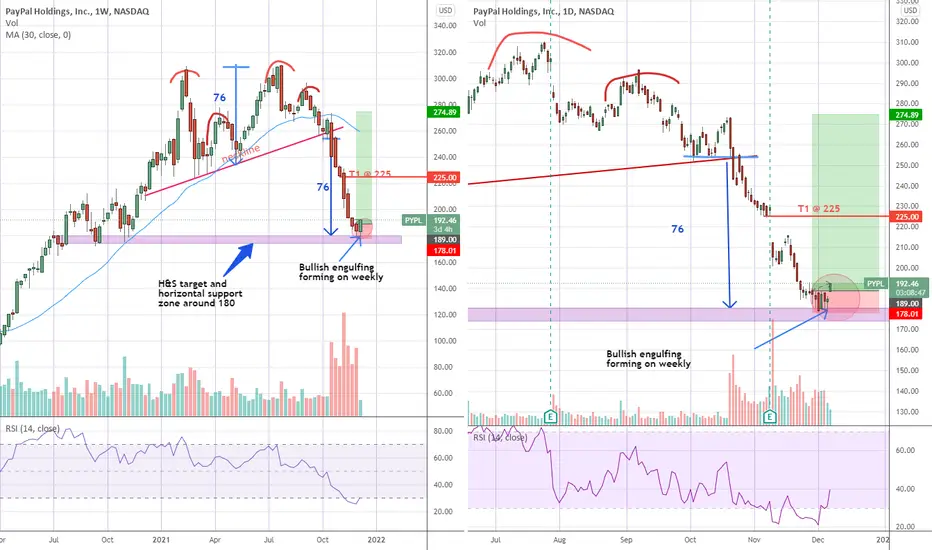
PYPL - could have bottomed outPYPL broke down from a messy Head & Shoulders formation of sorts (head-shoulder-head-shoulder) in Oct and had been trending down strongly since.
It eventually came down to about 180 on 1st Dec last week, which incidentally was it's H&S target and also a possible horizontal support zone here.
However we only see a decisive bounce off this level today, opening with a gap up, leading to the potential formation of a bullish engulfing candle on the weekly timeframe.
With a confluence of factors (H&S target, horizontal suppport and potentially bullish engulfing on weekly), I am fairly optimistic that it could have bottomed out.
I will venture a long today with initial stop stop slightly below $179. Will take partial profits around $225 (a gap fill) and protect remaining positions with trailing stops.
Disclaimer: TA is about improving our odds of a successful trade (not a guarantee). This is just my own analysis and opinion for discussion and is not a trade advice. Kindly do your own due diligence and trade according to your own risk tolerance and don't forget that money management is important! Thank you. Do give me a thumbs up if you agree. Feel free to let me know what you think! :)
XAUUSD D1 possible H&SAlthough xauusd is negative in monthly and weekly time frame, in daily time frame i see a Head and Shoulders formation possible.
The reasons listed below are what make me say gold will grow at least to 1807-1814:
1- D1 bull Engulfing Candlestick Pattern.
2- breakout of H4 down trendline.
3- H4 MacD Divergence
4- 1807 is the top of the left shoulder
I expect a pullback to 1771 (the 1st support level) the next 2 days before rising in a number of days to the TP proposed.
So i will order a buy limit at 1771 with a Sl below 1758 (the last Mn and W1 lows) plus H4 1 ATR points.
Please search hot to use ATR indicator for SL.
Feel free to comment with your own view ❤️

DEEPAK NITRITE - Bullish Engulfing at Retest - Swing TradeThe analysis is done on weekly TF hence price may take few weeks to few months in order to reach the targets.
Trade setup is explained in image itself.
The above analysis is purely for educational purpose. Traders must do their own study & follow risk management before entering into any trade
Checkout my other ideas to understand how one can earn from stock markets with simple trade setups. Feel Free to comment below this or connect with me for any query or suggestion regarding this stock or Price Action Analysis.

STRONG MOMENTUM in DEEPAK_NITRITENSE:DEEPAKNTR
current week candle showing good momentum.
CURRENT WEEKLY BULLISH CANDLE ENGULFED PREVIOUS WEEK BEARISH CANDLE , it may show good reversal towards its all time high.
it can be taken as short term trade. ready for a BIG MOVE.
do your own analysis before investing.

USDCAD Entry Price 1.28376 (Target Price 1.29490)USDCAD Foreign Currency Pair. Enter at 1.28376 and Exit at 1.29490.

GBP/USD Daily Bearish Engulfing playOn the daily today it looks like we are going to close as a bearish engulfing, of course this is a retail pattern none the less I'm looking to trade it...
First of if you drag a fib from high to low we get 61.8% fib confluence around 1.33071 which is also where a naked level is, perfect location for my order to be left. In this area there is also 50 ema which is another confluence I use to trade so they all seem to be stacking up in this area. Lastly ATR will be moving at market rollover this evening which should be within my stop for a extra bit of security...
My stop is beyond the high of the engulfing
Tp at D1 swing below market also around -27.2% fib
If price creates structure around 1.32874 ill be looking for a break and retest of this to play for the failure of the engulfing
Lmk what you think of this, this is the first idea I've ever posted lol


50 - 61% 4H Bullish Correction of Swing High to Swing Low.Here I have identified a Bullish Engulfing at SUPPORT AREA, considering the sell off that took place from 15th Nov through 19th Nov, a correction is expected towards 50 and 61% correction Level.

DASHBTC Target Price 0.00371661DASHBTC Crypto
TREND: Up
LEVEL: Trend Line Support, EMA 10 Support, EMA 20 Support

Bullish Gartley: Hidden Bullish Divergence: Weekly EngulfingThere is classic divergence on the daily and hidden divergence on the weekly at the PCZ of a Gartley.

#PLTR - Price possibly rebouncing from key support at 20$?Hi All, my main 3 take-outs from this analysis are the following:
1- Price possibly rebouncing from a key support of 20$ (price has been moving between 27$ and 20$ since a lot f time)
2- 4H chart shws engulfing bullish pattern as also an RSI in oversld territory, which might be a god sign of possible reversal from these levels
3- There are still two gaps at 24$ and 27$ (as also at 31$) that will be needed to be filled sooner or later
Not a financial advice, just personal opinion. Do your own due diligence and good luck!

GBPCAD SELLDOJI Candle for last 3 days, Price stuck at the daily resistance level. The daily candle is bearish engulfing. Signal for sell.

SILVER BUY!!!My reason for this analysis:
1) inverted head and shoulder break and retest.
2) Strong support level.
3) Bullish evidence
If you like my idea please like and subscribe for more crypto-currency and forex sinals.

4hr Bullish Engulfing Higher Low Above Bullish Shark PCZThe price and the RSI are attempting higher lows above the PCZ of a Bullish Shark and the 4 Hour is Bullishly Engulfing if price may attempt a breakout of the trendline after the closing of this Engulfing Candle and the RSI will attempt a rally above the 50 line.
My targets here will be the .786 and .886

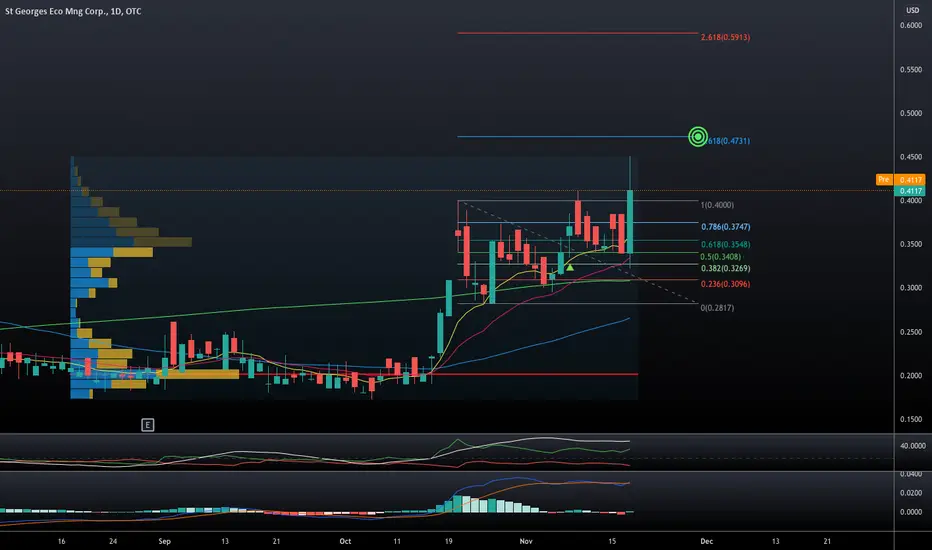
SXOOF Bullish AFWe have a MACD cross and a broad green bullish engulfing candle at the most recent close. The ADX and DI+ are both signaling a strong uptrend.
Targeting: .47 in the short term.
GBPCAD - Bullish Engulfing Setup (Daily)GBPCAD has formed a significant bullish engulfing on the daily time frame near a previous support level.
The engulfing candle engulfed 4 previous candles and closed Friday.
Clear accumulation reversal visible on the 1 hour time frame.
Expecting price to bounce off of the 50% retracement level.
SL set at engulfing candle body low.
TP set at 3X risk.

Slightly Late Bullish Gartley Entry on IntelThis entry is a little late on the daily but on the weekly we do have a bullish engulfing so on that timeframe this entry might not be considered very late. With the release of Windows 11 it seems that intel will be reclaiming some ground against AMD and the Gartley may be giving us a hint that it will.

WMT shortEntry price: 150-152$
Target price: 135-137$
Stop loss: 153-155$
Chart pattern: double top - the price formed the second top, thus the price reversal is very likely
Candlestick pattern: bearish engulfing
RSI: approaching 70 level, therefore, the price is almost overbought
Conclusions: the chart pattern, candlestick pattern and RSI suggest the trend reversal in the near future. Thus, the short position is recommended with the stop loss above the resistance level.
No financial advice

YFIIUSDT 4H long setup; Breakout of the desc trendlineTA explained
YFII broke out of the descending trendline. Bounced strong form the bottom with an engulfing bullish 4H candle.
Trade setup
Best entries: 3738.2 - 3810.0
TP1: 4010.7
TP2: 4105.4
TP3: 4286.1
SL: 3621.9
RR: 3.33
Max leverage: 3
—————
MDSquared Crypto Lounge
—————
Do Your Own Research (of course)
Trade at own risk (of course)
Only trade what you can afford to lose (of course)

Swing Trade CCLBuy NSE:CCL
Buy @ 385-390
Short term : 420
Mid Term : 450
Long Term : 520
Stop Loss : 350
Note: I am not a Sebi Registered Advisor. Please Consult with your Financial Advisor before Investing.
